I-SEM Daily Briefing — 30 July 2026
Table of Contents
Market Snapshot
| Metric | Value |
|---|---|
| Mean DAM Price | €159.05/MWh |
| Median Price | €154.91/MWh |
| Std Dev | €28.6/MWh |
| Peak Price | €214.01/MWh (20:00) |
| Min Price | €120.21/MWh (13:30) |
| Price Range | €93.8/MWh |
| Periods above €150 | 28 of 48 (58%) |
| Periods above €200 | 7 of 48 (15%) |
| Peak Avg (07–22) | €157.22/MWh |
| Off-peak Avg (22–07) | €162.12/MWh |
| Peak/Off-Peak Spread | €-4.9/MWh |
| Wind % of Demand | 19.4% |
| Wind Range | 9.3%–32.6% |
| Mean Demand | 3728 MW |
Price Profile #
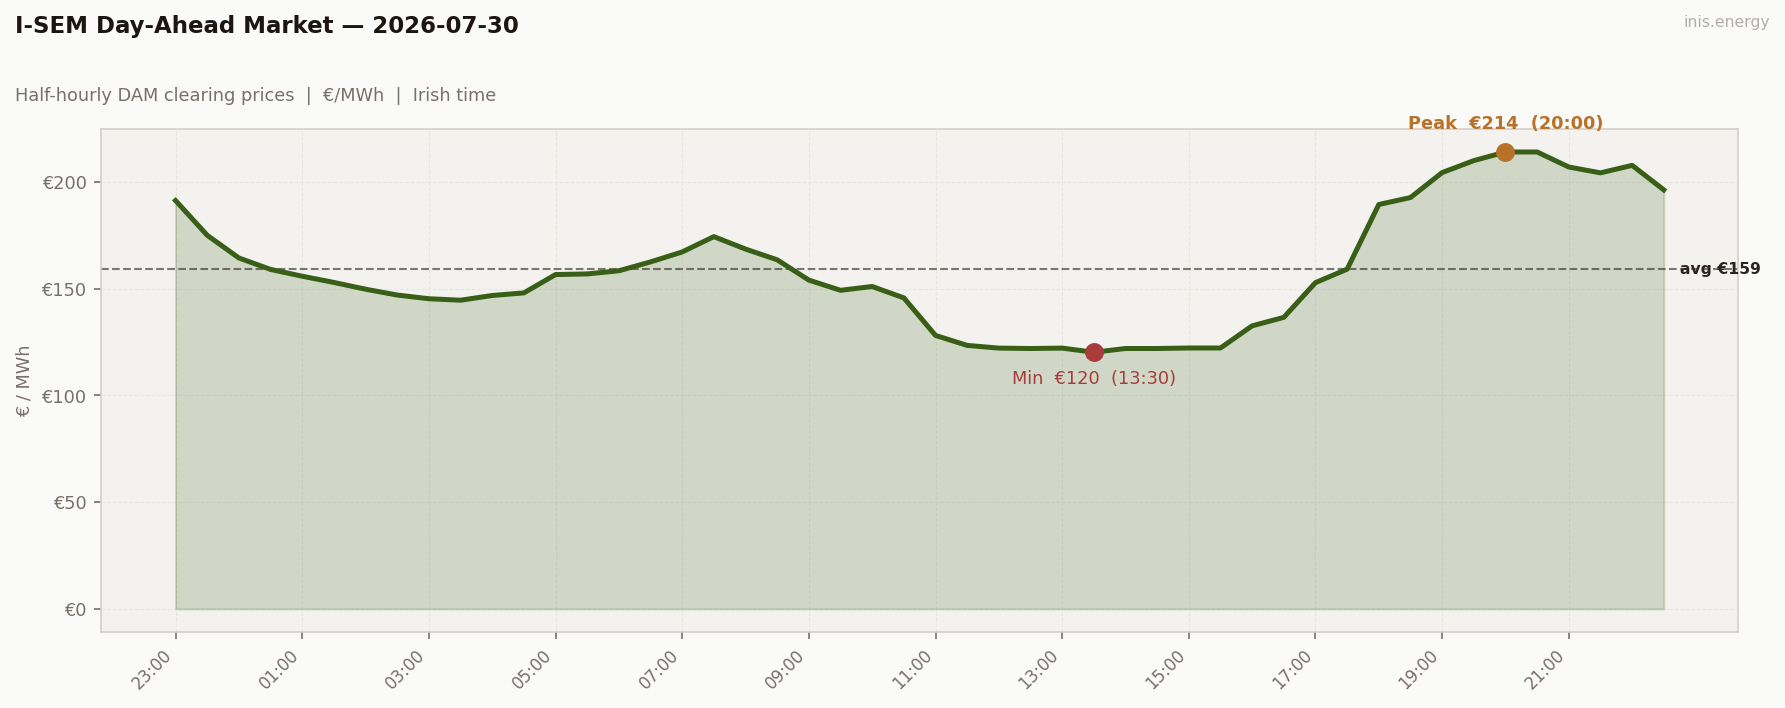
Std dev €28.6/MWh · Median €154.91/MWh · Periods above €150: 28 of 48 (58%)
Price vs Wind #
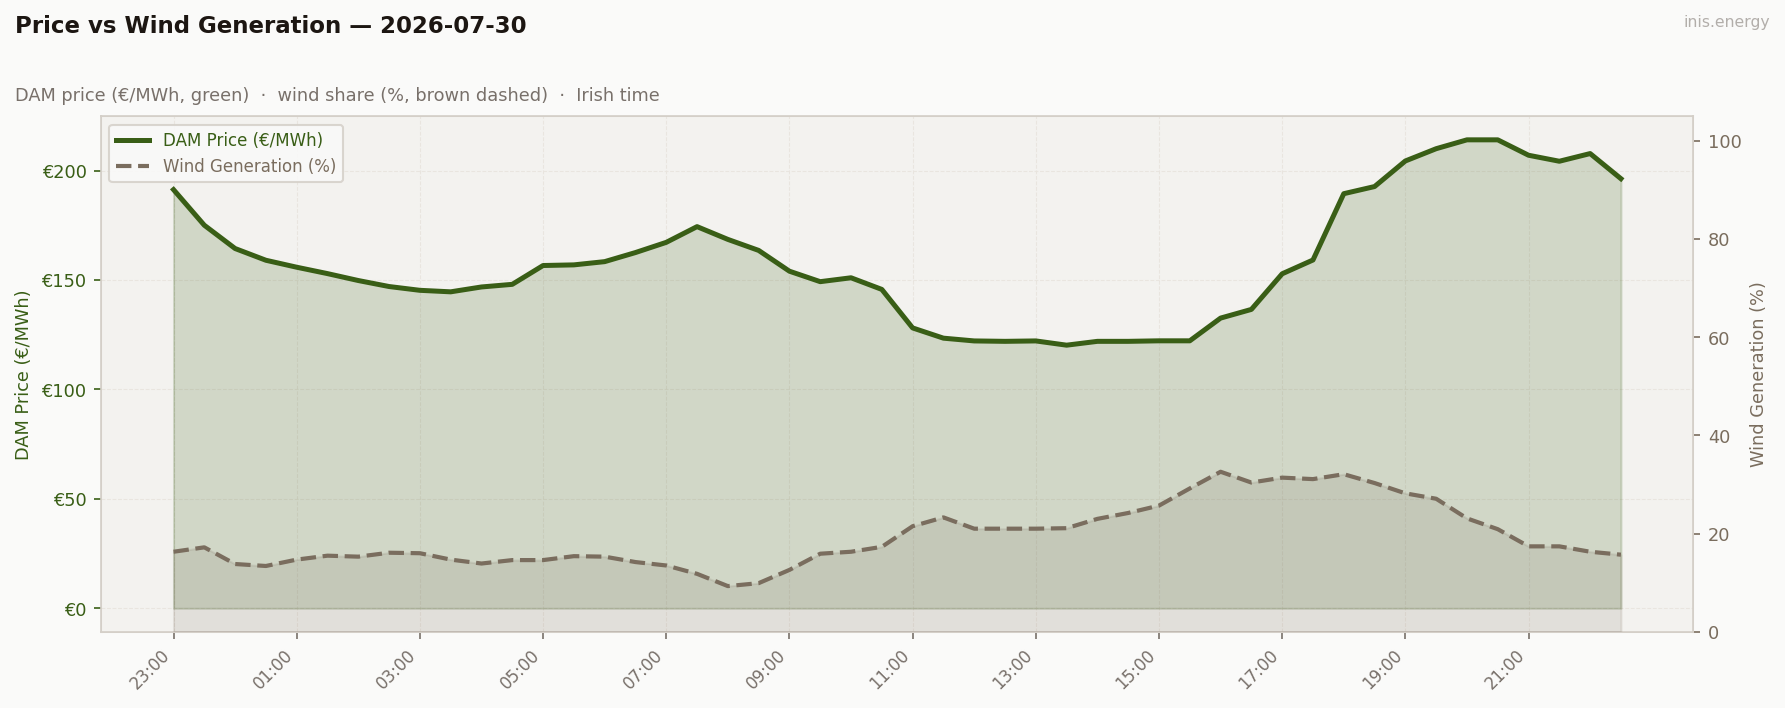
Mean wind: 19.4% · Range: 9.3%–32.6%
Week in Context #
Price Duration Curve #
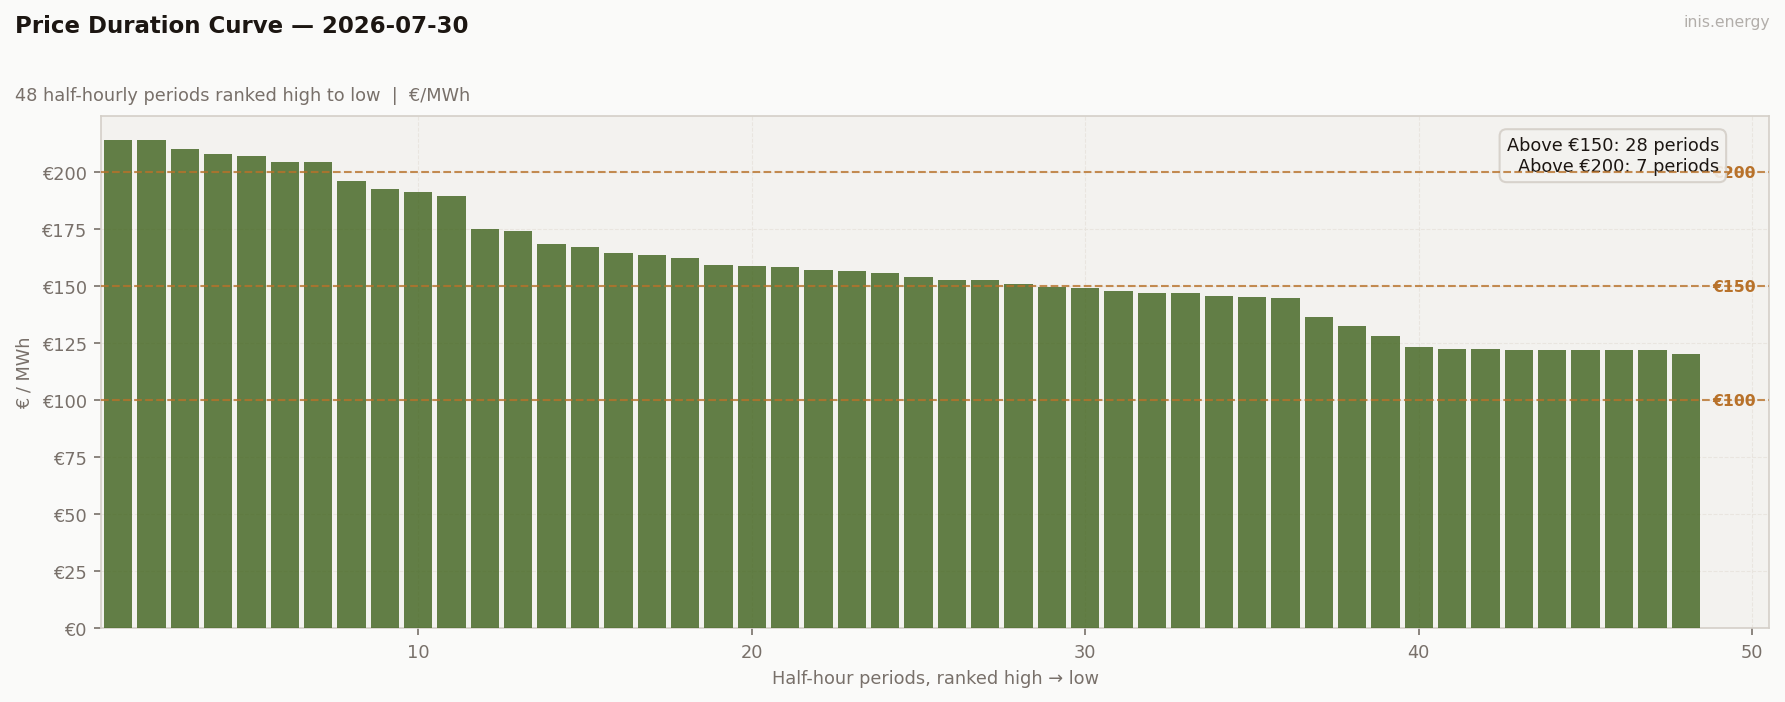
Periods above €150: 28 (58% of day) · Above €200: 7 (15% of day)
Peak / Off-Peak Spread #
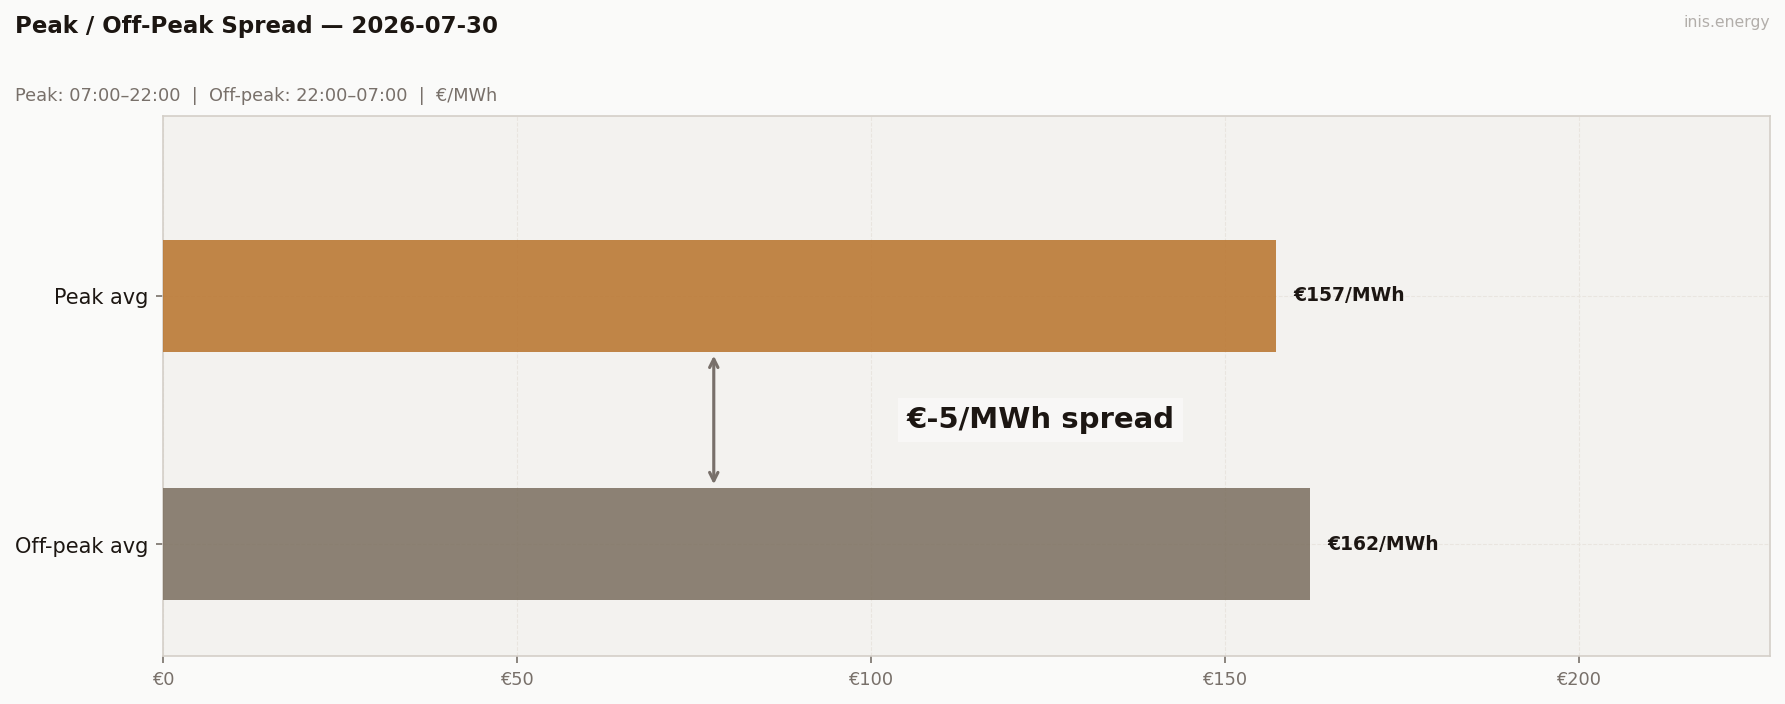
Peak avg (07:00–22:00): €157.22/MWh · Off-peak avg: €162.12/MWh · Spread: €-4.9/MWh
BESS Dispatch Signal #
| Price | Time | Energy | Value | |
|---|---|---|---|---|
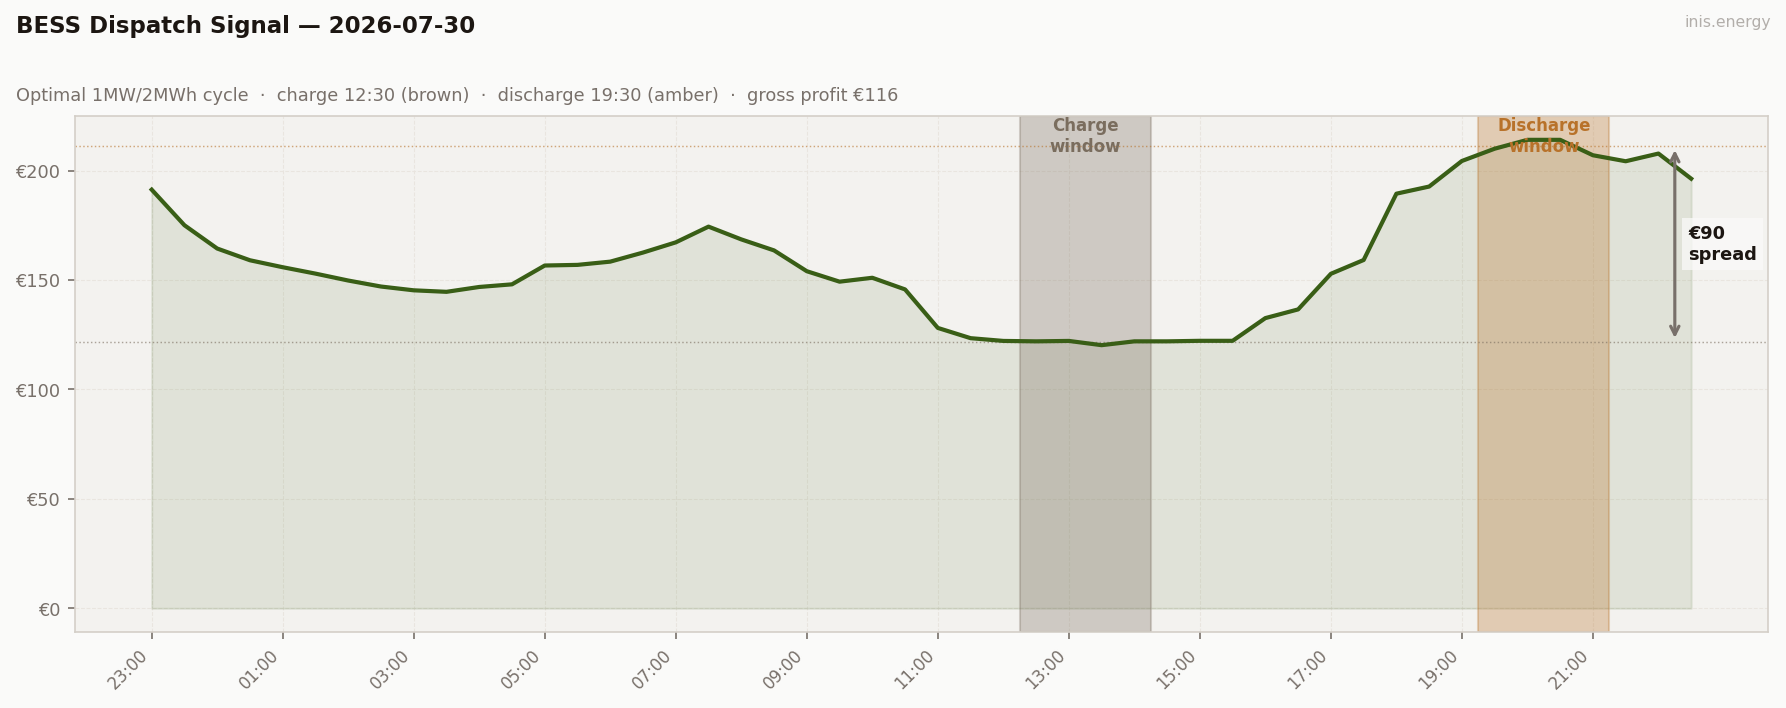
| Charge | €122/MWh | 12:30 | 2 MWh | −€243 |
| Discharge | €211/MWh | 19:30 | 1.7 MWh (85% RTE) | +€359 |
| Gross profit | €116 | |||
| Price spread | €90/MWh | ROI: 47.7% |
Simulated 1MW/2MWh battery, one optimal DAM cycle. Gross before network charges and capacity costs.
Commentary #
Wind spent the day climbing out of an overnight trough — 9.3% at 08:00, past 20% by 11:00, peaking at 32.6% mid-afternoon — and price followed it down almost tick for tick. The €121–122 plateau from 12:00 to 14:30 is as flat a trough as the week has produced, a full €37 under the day’s average. Wind then unwound just as fast into the evening, falling from 32% at 18:00 to 20.9% by 20:30, and price rebuilt itself into a proper spike: €189 by 18:00, €214.01 by 20:00, the day’s peak.
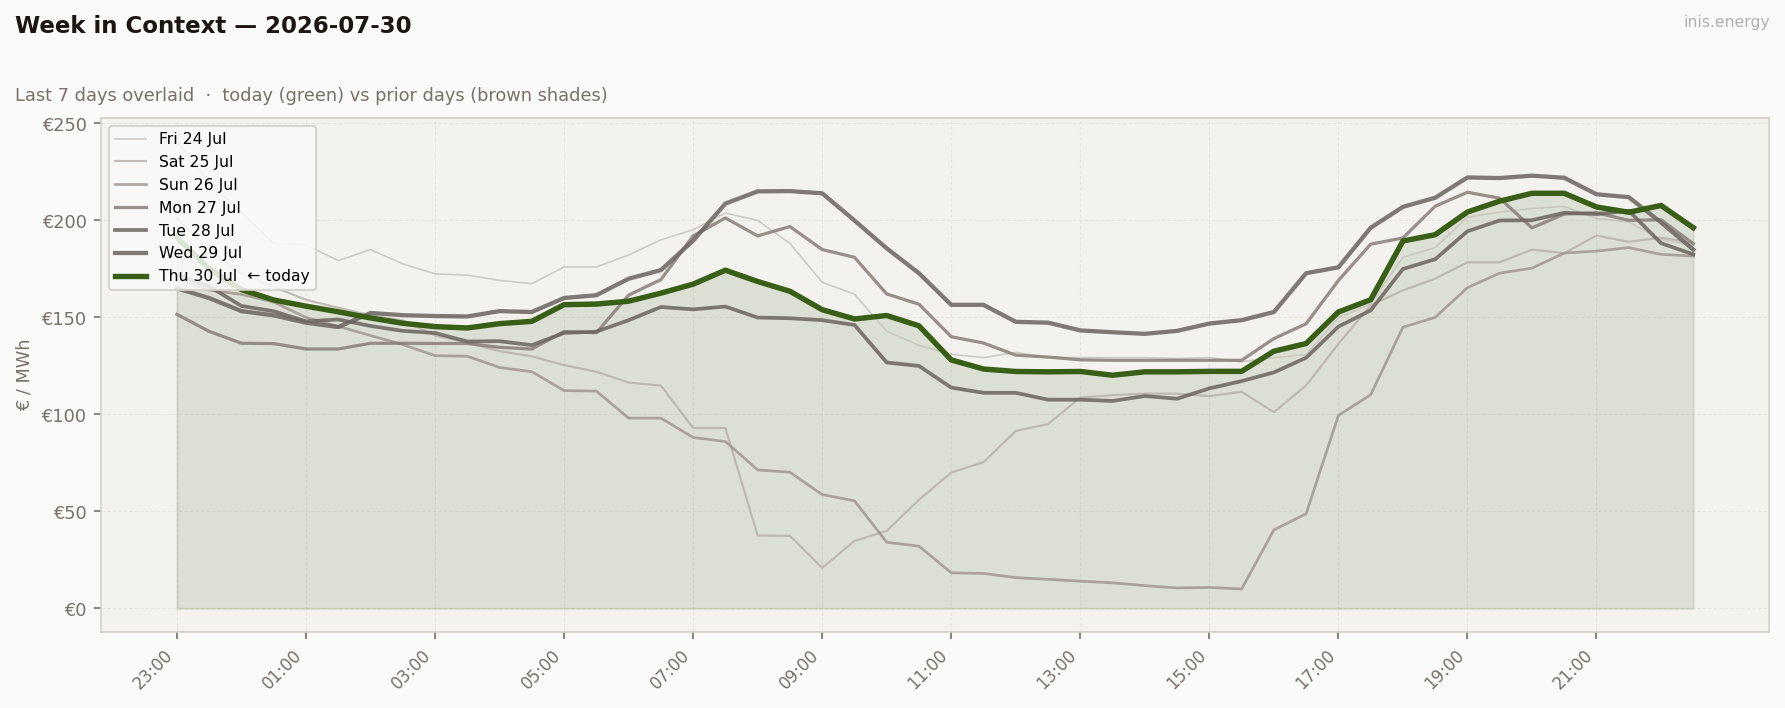
For once the peak/off-peak split reads negative — off-peak averaged €162.12, five euro above the daytime window — but that’s timing, not a genuine reversal. The overnight hours were still carrying yesterday evening’s high-price hangover while the 07:00–22:00 window swallowed the midday wind trough whole. Std dev held at €28.6, in line with the rest of the week, but the range was the widest yet at €93.8 — real shape, not just noise.
That shape is exactly what storage wants. Charging at €122 and discharging at €211 seven and a half hours later put €116 gross on the board at a 47.7% ROI, the best return since the 52%-wind day on the 26th. Two flat, low-wind days either side of this one made barely a third of that — give the market a proper trough to work with and the battery does its job.
Half-hourly data — 2026-07-30
| Period | Time | Price (€/MWh) | Wind % |
|---|---|---|---|
| 1 | 23:00 | 191.26 | 16.3% |
| 2 | 23:30 | 175.00 | 17.2% |
| 3 | 00:00 | 164.36 | 13.8% |
| 4 | 00:30 | 159.00 | 13.4% |
| 5 | 01:00 | 155.82 | 14.7% |
| 6 | 01:30 | 152.90 | 15.5% |
| 7 | 02:00 | 149.74 | 15.3% |
| 8 | 02:30 | 147.00 | 16.1% |
| 9 | 03:00 | 145.27 | 16.0% |
| 10 | 03:30 | 144.58 | 14.7% |
| 11 | 04:00 | 146.80 | 13.9% |
| 12 | 04:30 | 148.00 | 14.6% |
| 13 | 05:00 | 156.60 | 14.6% |
| 14 | 05:30 | 156.89 | 15.4% |
| 15 | 06:00 | 158.37 | 15.3% |
| 16 | 06:30 | 162.52 | 14.2% |
| 17 | 07:00 | 167.18 | 13.5% |
| 18 | 07:30 | 174.36 | 11.8% |
| 19 | 08:00 | 168.53 | 9.3% |
| 20 | 08:30 | 163.50 | 9.9% |
| 21 | 09:00 | 154.00 | 12.6% |
| 22 | 09:30 | 149.22 | 15.9% |
| 23 | 10:00 | 151.00 | 16.3% |
| 24 | 10:30 | 145.68 | 17.3% |
| 25 | 11:00 | 128.09 | 21.5% |
| 26 | 11:30 | 123.41 | 23.3% |
| 27 | 12:00 | 122.15 | 21.0% |
| 28 | 12:30 | 121.96 | 21.0% |
| 29 | 13:00 | 122.15 | 21.0% |
| 30 | 13:30 | 120.21 | 21.1% |
| 31 | 14:00 | 121.96 | 23.0% |
| 32 | 14:30 | 121.96 | 24.2% |
| 33 | 15:00 | 122.20 | 25.7% |
| 34 | 15:30 | 122.20 | 29.2% |
| 35 | 16:00 | 132.58 | 32.6% |
| 36 | 16:30 | 136.55 | 30.4% |
| 37 | 17:00 | 152.82 | 31.4% |
| 38 | 17:30 | 159.12 | 31.1% |
| 39 | 18:00 | 189.41 | 32.1% |
| 40 | 18:30 | 192.67 | 30.3% |
| 41 | 19:00 | 204.36 | 28.2% |
| 42 | 19:30 | 209.96 | 27.1% |
| 43 | 20:00 | 214.01 | 23.1% |
| 44 | 20:30 | 214.01 | 20.9% |
| 45 | 21:00 | 206.97 | 17.4% |
| 46 | 21:30 | 204.23 | 17.4% |
| 47 | 22:00 | 207.74 | 16.3% |
| 48 | 22:30 | 196.26 | 15.7% |
Compare your business electricity and gas rates in minutes with INIS Energy Brokers.
Compare rates