I-SEM Daily Briefing — 7 August 2026
Table of Contents
Market Snapshot
| Metric | Value |
|---|---|
| Mean DAM Price | €141.9/MWh |
| Median Price | €140.76/MWh |
| Std Dev | €23.55/MWh |
| Peak Price | €181.7/MWh (21:30) |
| Min Price | €109.0/MWh (11:30) |
| Price Range | €72.7/MWh |
| Periods above €150 | 17 of 48 (35%) |
| Periods above €200 | 0 of 48 (0%) |
| Peak Avg (07–22) | €138.49/MWh |
| Off-peak Avg (22–07) | €147.59/MWh |
| Peak/Off-Peak Spread | €-9.1/MWh |
| Wind % of Demand | 19.3% |
| Wind Range | 13.9%–26.3% |
| Mean Demand | 3699 MW |
Price Profile #
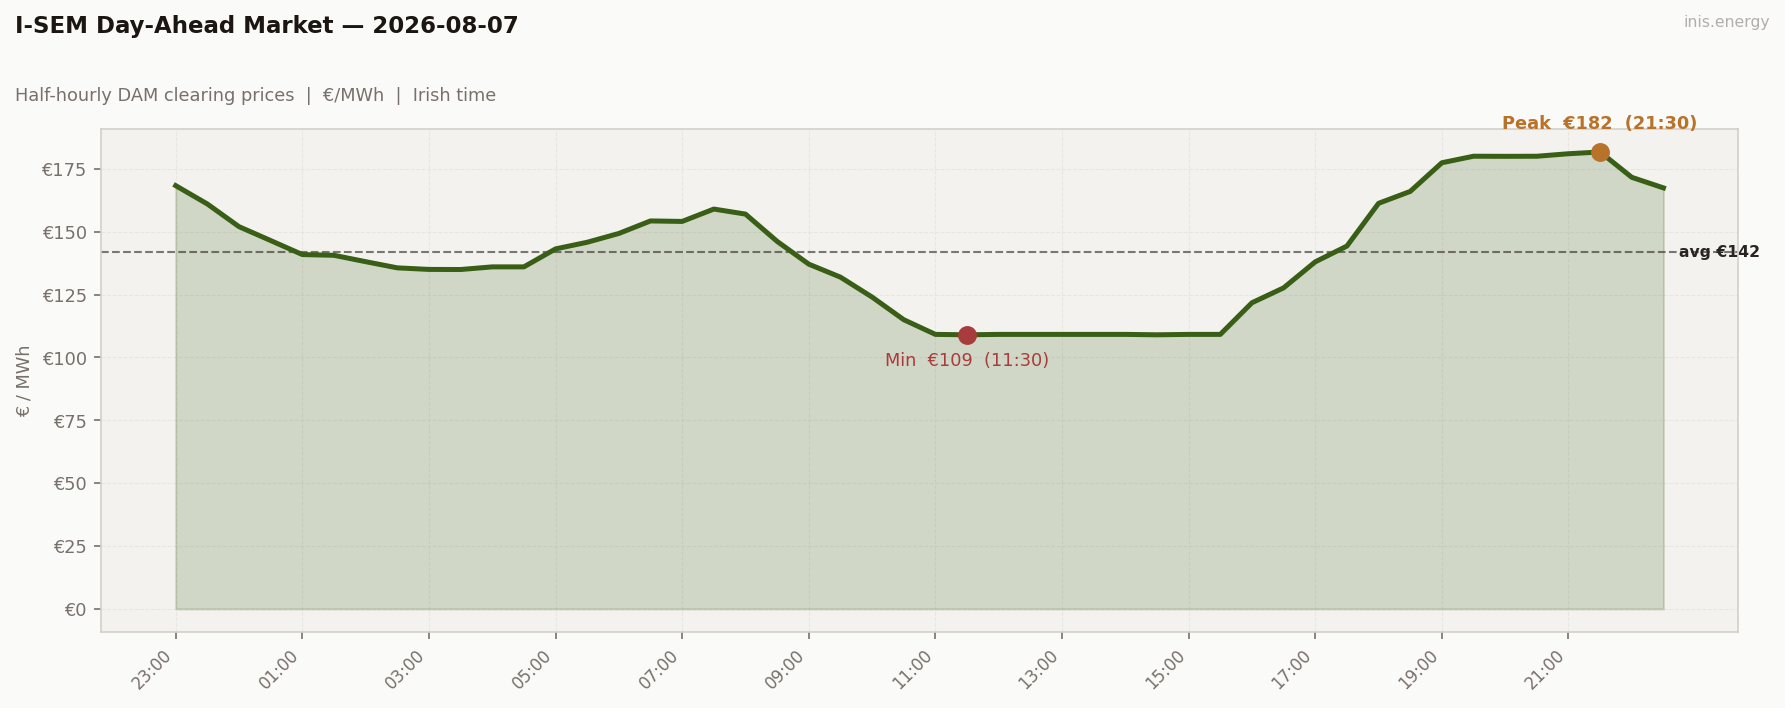
Std dev €23.55/MWh · Median €140.76/MWh · Periods above €150: 17 of 48 (35%)
Price vs Wind #
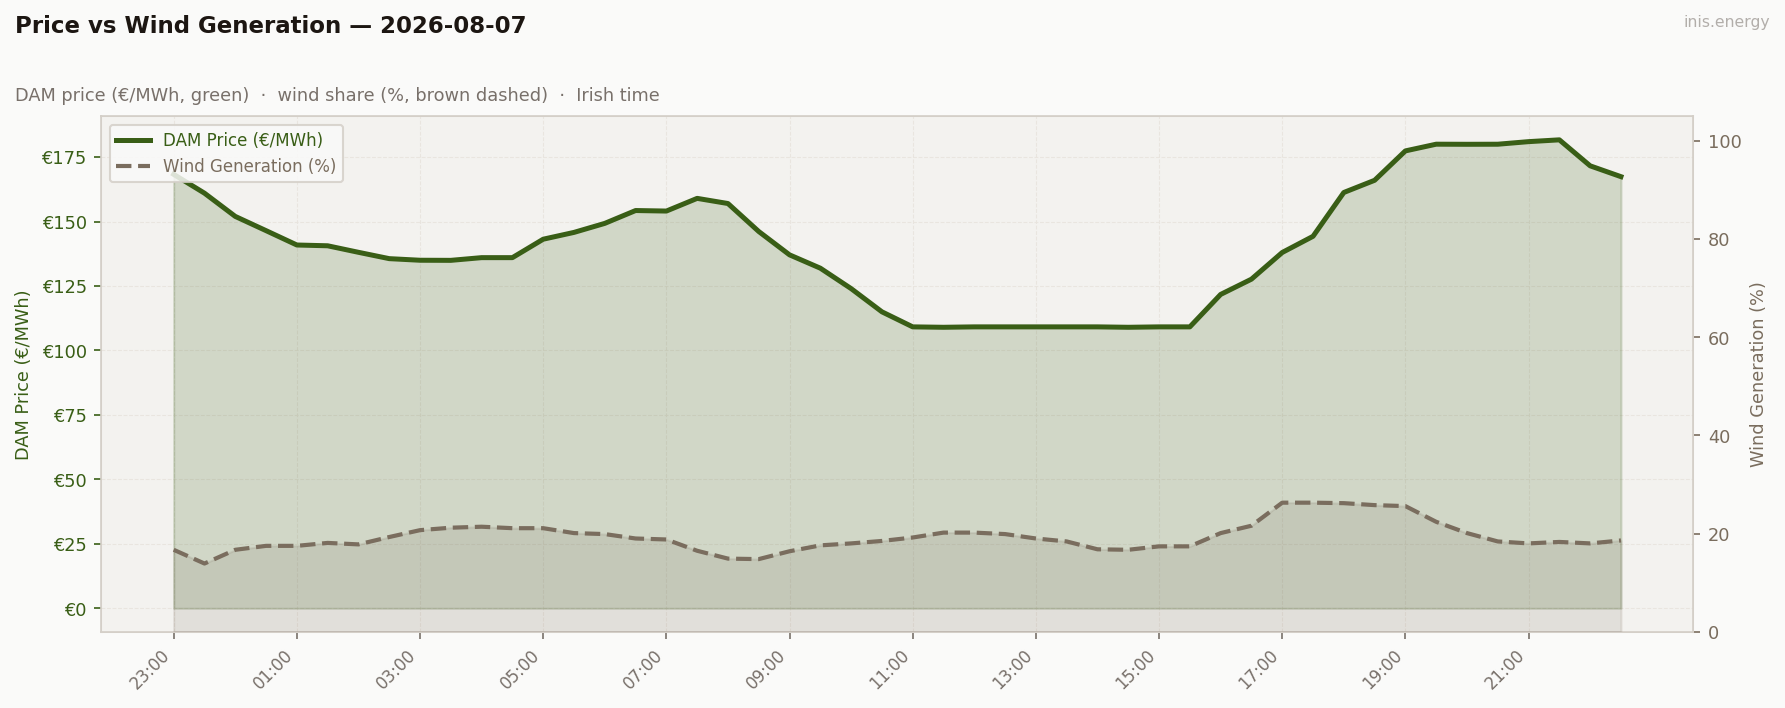
Mean wind: 19.3% · Range: 13.9%–26.3%
Week in Context #
Price Duration Curve #
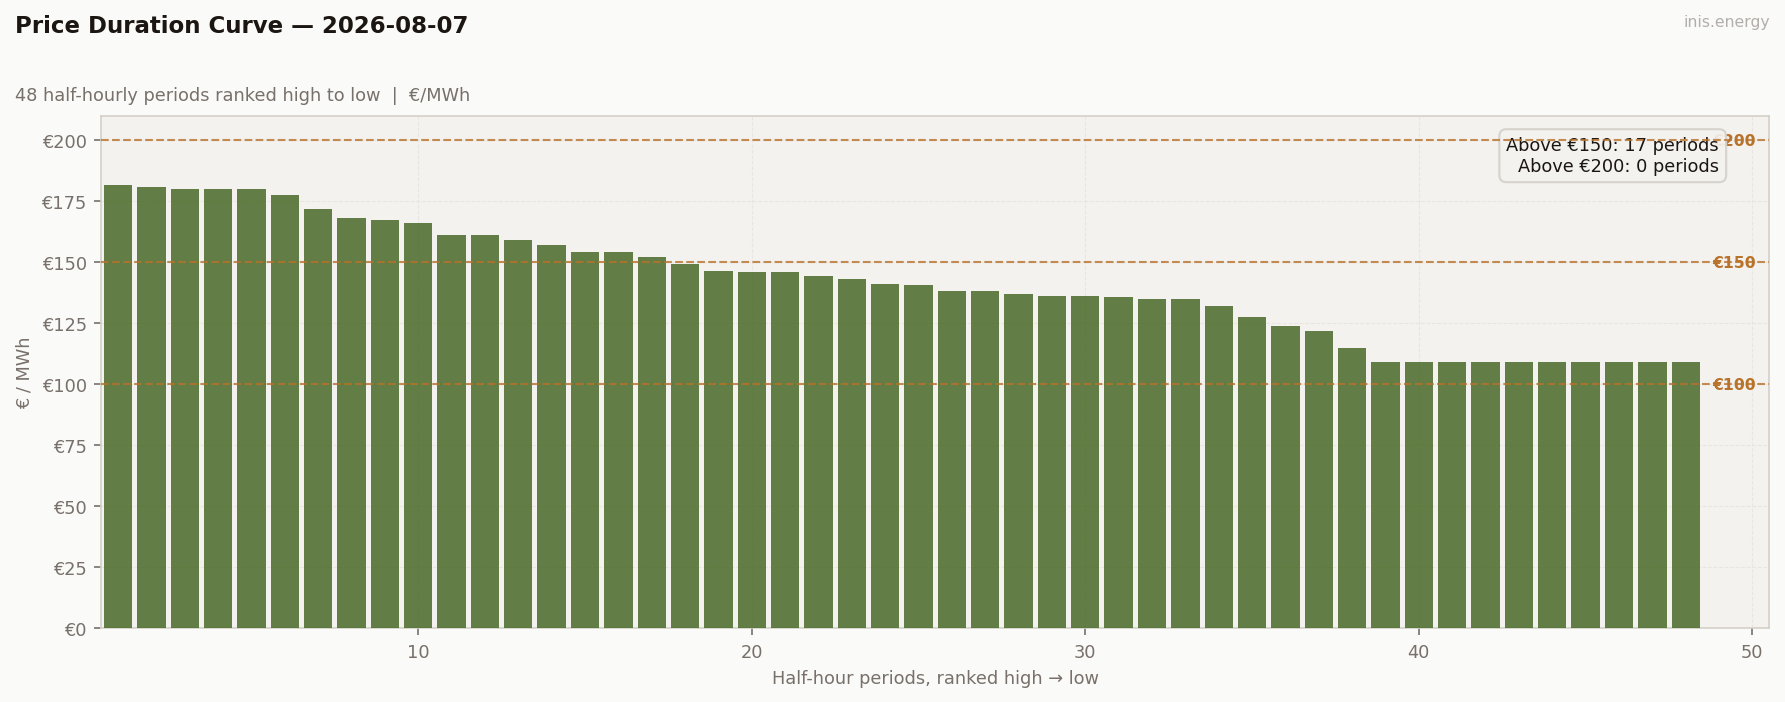
Periods above €150: 17 (35% of day) · Above €200: 0 (0% of day)
Peak / Off-Peak Spread #
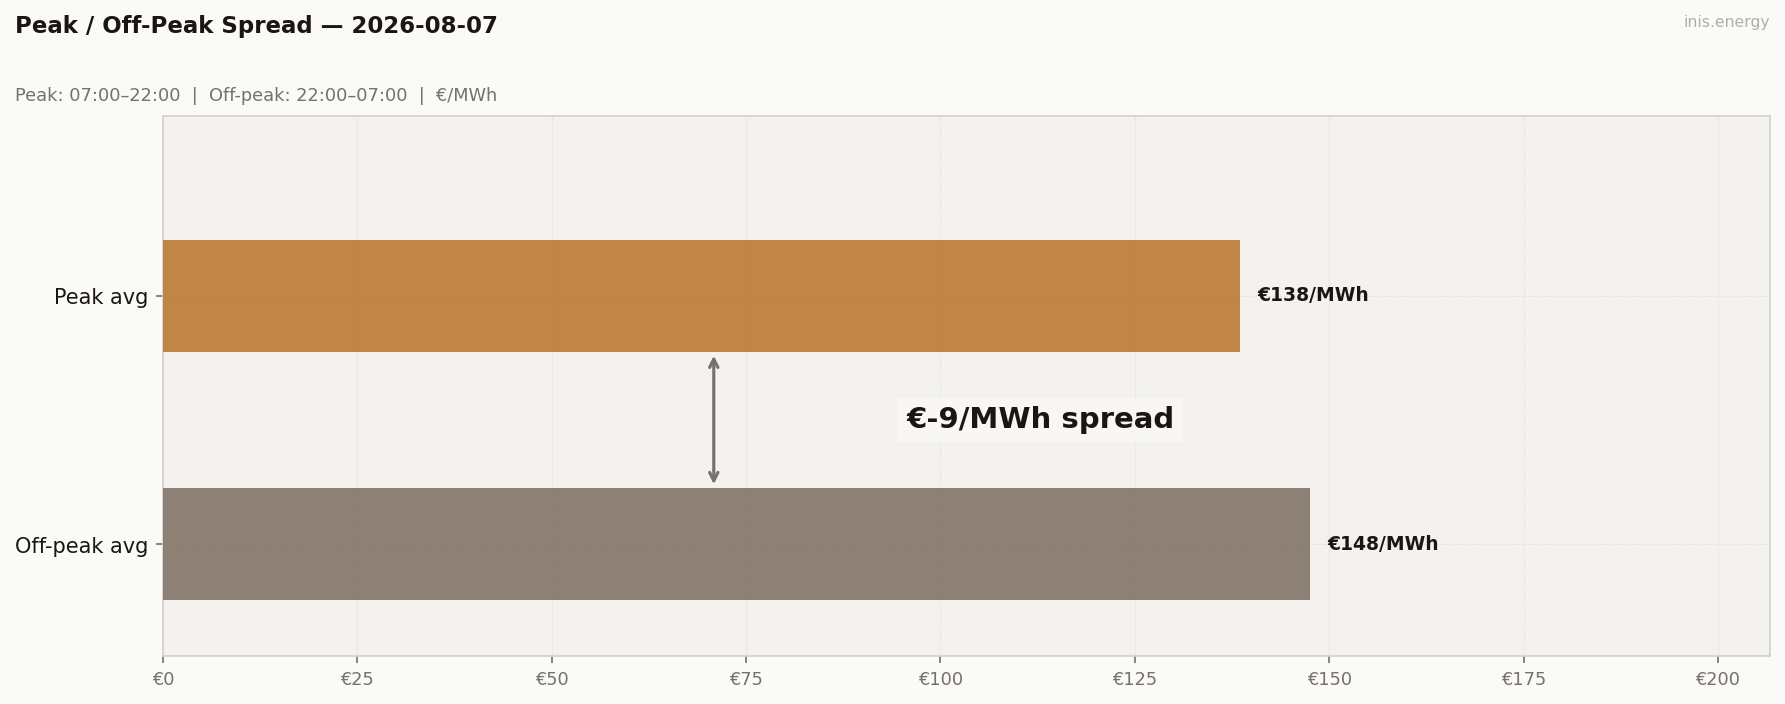
Peak avg (07:00–22:00): €138.49/MWh · Off-peak avg: €147.59/MWh · Spread: €-9.1/MWh
BESS Dispatch Signal #
| Price | Time | Energy | Value | |
|---|---|---|---|---|
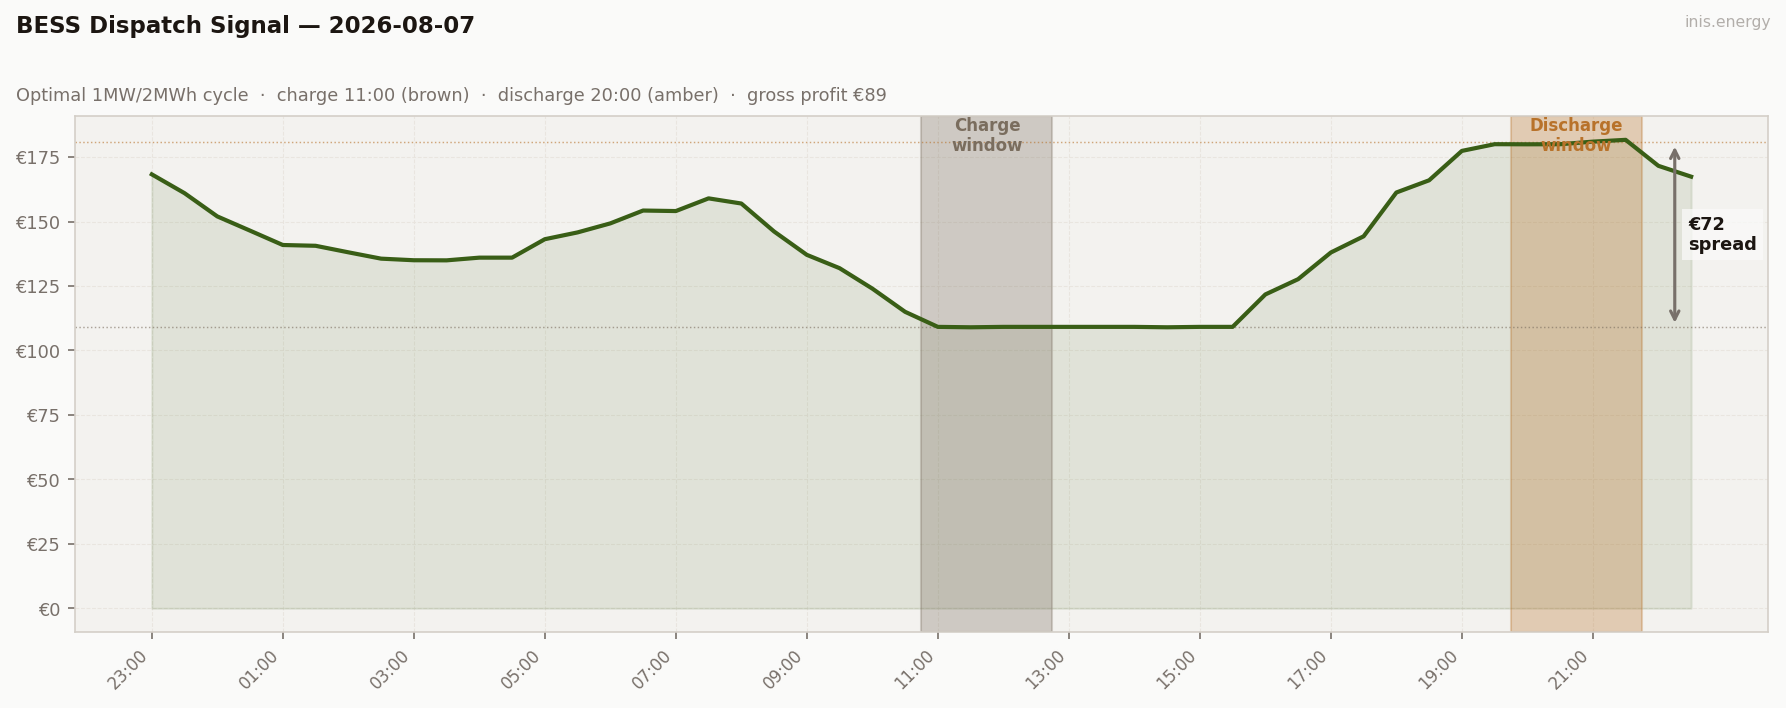
| Charge | €109/MWh | 11:00 | 2 MWh | −€218 |
| Discharge | €181/MWh | 20:00 | 1.7 MWh (85% RTE) | +€307 |
| Gross profit | €89 | |||
| Price spread | €72/MWh | ROI: 40.7% |
Simulated 1MW/2MWh battery, one optimal DAM cycle. Gross before network charges and capacity costs.
Commentary #
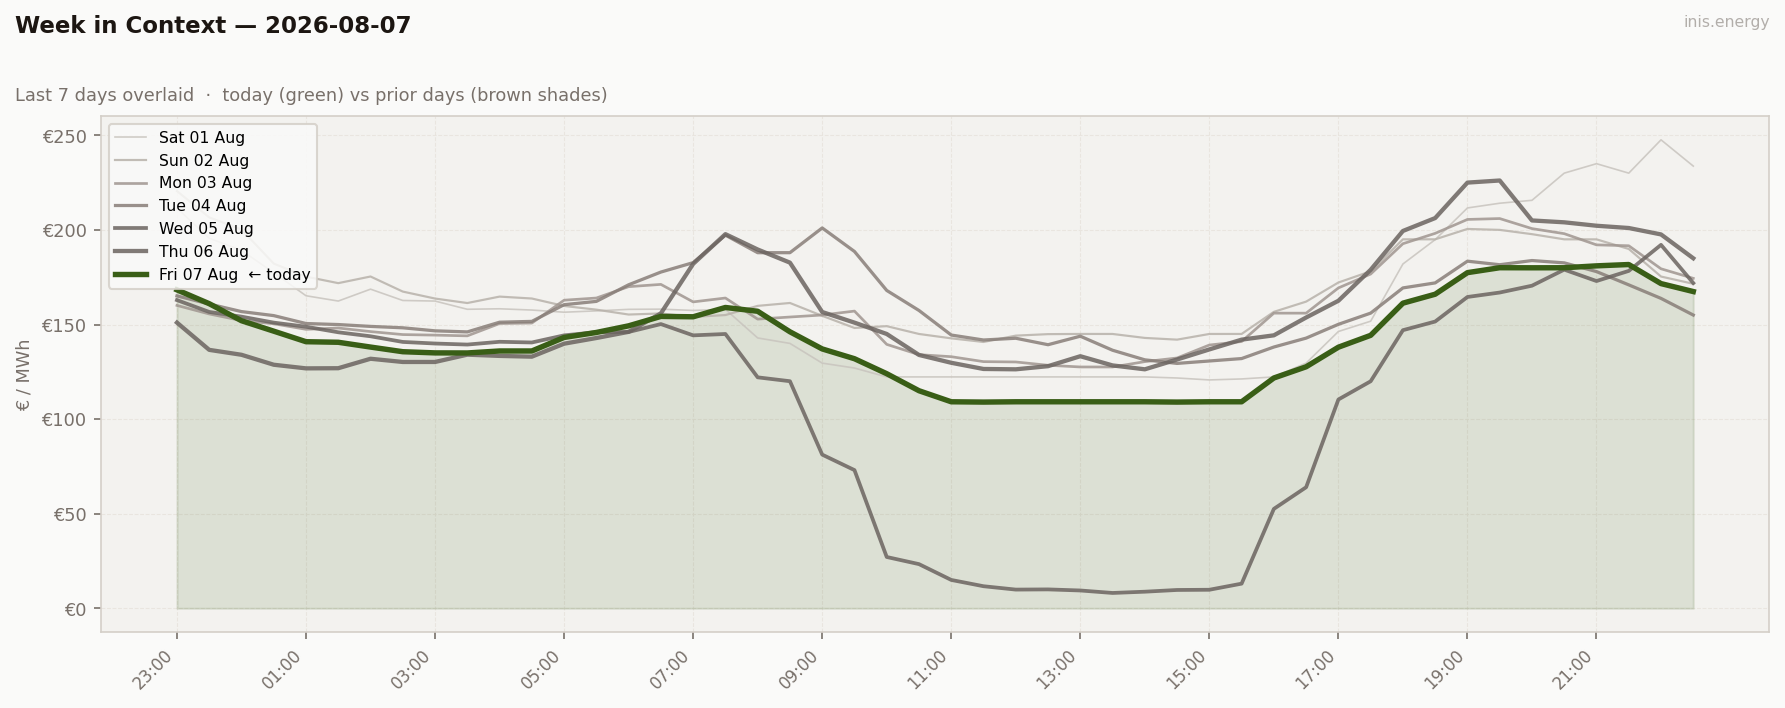
Friday backed off from Thursday’s extremes on both ends. Wind steadied into a moderate 19.3% band (13.9–26.3%), and the price curve reflects that mid-table calm: no period broke €200 for the first time since Monday, and the trough spent nearly two and a half hours pinned dead flat at €109.16 from 11:00 to 15:30 — about as featureless a midday plateau as this market produces.
That flat trough kept the peak/off-peak spread slightly negative (–€9.10): the overnight open at €168.31 and the pre-dawn ramp did more work than the modest €181.70 evening peak at 21:30. Std dev of €23.55 sits close to the week’s median, a day defined by the absence of a story rather than the presence of one.
Storage picked up a workmanlike €89 gross off that flat €109 floor and the evening high, a 40.7% ROI — nothing like Wednesday’s outlier, but a clean, repeatable spread all the same. After two days of extremes in opposite directions, the market found its footing.
Half-hourly data — 2026-08-07
| Period | Time | Price (€/MWh) | Wind % |
|---|---|---|---|
| 1 | 23:00 | 168.31 | 16.7% |
| 2 | 23:30 | 161.01 | 13.9% |
| 3 | 00:00 | 152.00 | 16.7% |
| 4 | 00:30 | 146.48 | 17.5% |
| 5 | 01:00 | 140.91 | 17.5% |
| 6 | 01:30 | 140.61 | 18.1% |
| 7 | 02:00 | 138.08 | 17.8% |
| 8 | 02:30 | 135.62 | 19.3% |
| 9 | 03:00 | 135.00 | 20.7% |
| 10 | 03:30 | 134.96 | 21.2% |
| 11 | 04:00 | 136.01 | 21.4% |
| 12 | 04:30 | 136.01 | 21.1% |
| 13 | 05:00 | 143.16 | 21.1% |
| 14 | 05:30 | 145.80 | 20.1% |
| 15 | 06:00 | 149.30 | 19.9% |
| 16 | 06:30 | 154.28 | 19.0% |
| 17 | 07:00 | 154.08 | 18.8% |
| 18 | 07:30 | 159.00 | 16.5% |
| 19 | 08:00 | 157.00 | 14.9% |
| 20 | 08:30 | 146.15 | 14.8% |
| 21 | 09:00 | 137.09 | 16.4% |
| 22 | 09:30 | 131.92 | 17.6% |
| 23 | 10:00 | 124.00 | 18.0% |
| 24 | 10:30 | 115.00 | 18.5% |
| 25 | 11:00 | 109.16 | 19.2% |
| 26 | 11:30 | 109.00 | 20.2% |
| 27 | 12:00 | 109.16 | 20.2% |
| 28 | 12:30 | 109.16 | 19.9% |
| 29 | 13:00 | 109.16 | 19.0% |
| 30 | 13:30 | 109.16 | 18.4% |
| 31 | 14:00 | 109.16 | 16.8% |
| 32 | 14:30 | 109.00 | 16.7% |
| 33 | 15:00 | 109.16 | 17.4% |
| 34 | 15:30 | 109.16 | 17.4% |
| 35 | 16:00 | 121.74 | 20.1% |
| 36 | 16:30 | 127.66 | 21.6% |
| 37 | 17:00 | 138.01 | 26.3% |
| 38 | 17:30 | 144.28 | 26.3% |
| 39 | 18:00 | 161.28 | 26.2% |
| 40 | 18:30 | 166.01 | 25.8% |
| 41 | 19:00 | 177.41 | 25.6% |
| 42 | 19:30 | 180.01 | 22.4% |
| 43 | 20:00 | 179.97 | 20.1% |
| 44 | 20:30 | 180.00 | 18.4% |
| 45 | 21:00 | 181.00 | 18.0% |
| 46 | 21:30 | 181.70 | 18.3% |
| 47 | 22:00 | 171.62 | 18.0% |
| 48 | 22:30 | 167.42 | 18.6% |
Compare your business electricity and gas rates in minutes with INIS Energy Brokers.
Compare rates