I-SEM Daily Briefing — 10 August 2026
Table of Contents
Market Snapshot
| Metric | Value |
|---|---|
| Mean DAM Price | €165.78/MWh |
| Median Price | €153.34/MWh |
| Std Dev | €31.03/MWh |
| Peak Price | €228.21/MWh (20:00) |
| Min Price | €130.99/MWh (11:30) |
| Price Range | €97.22/MWh |
| Periods above €150 | 26 of 48 (54%) |
| Periods above €200 | 9 of 48 (19%) |
| Peak Avg (07–22) | €172.01/MWh |
| Off-peak Avg (22–07) | €155.4/MWh |
| Peak/Off-Peak Spread | €16.61/MWh |
Price Profile #
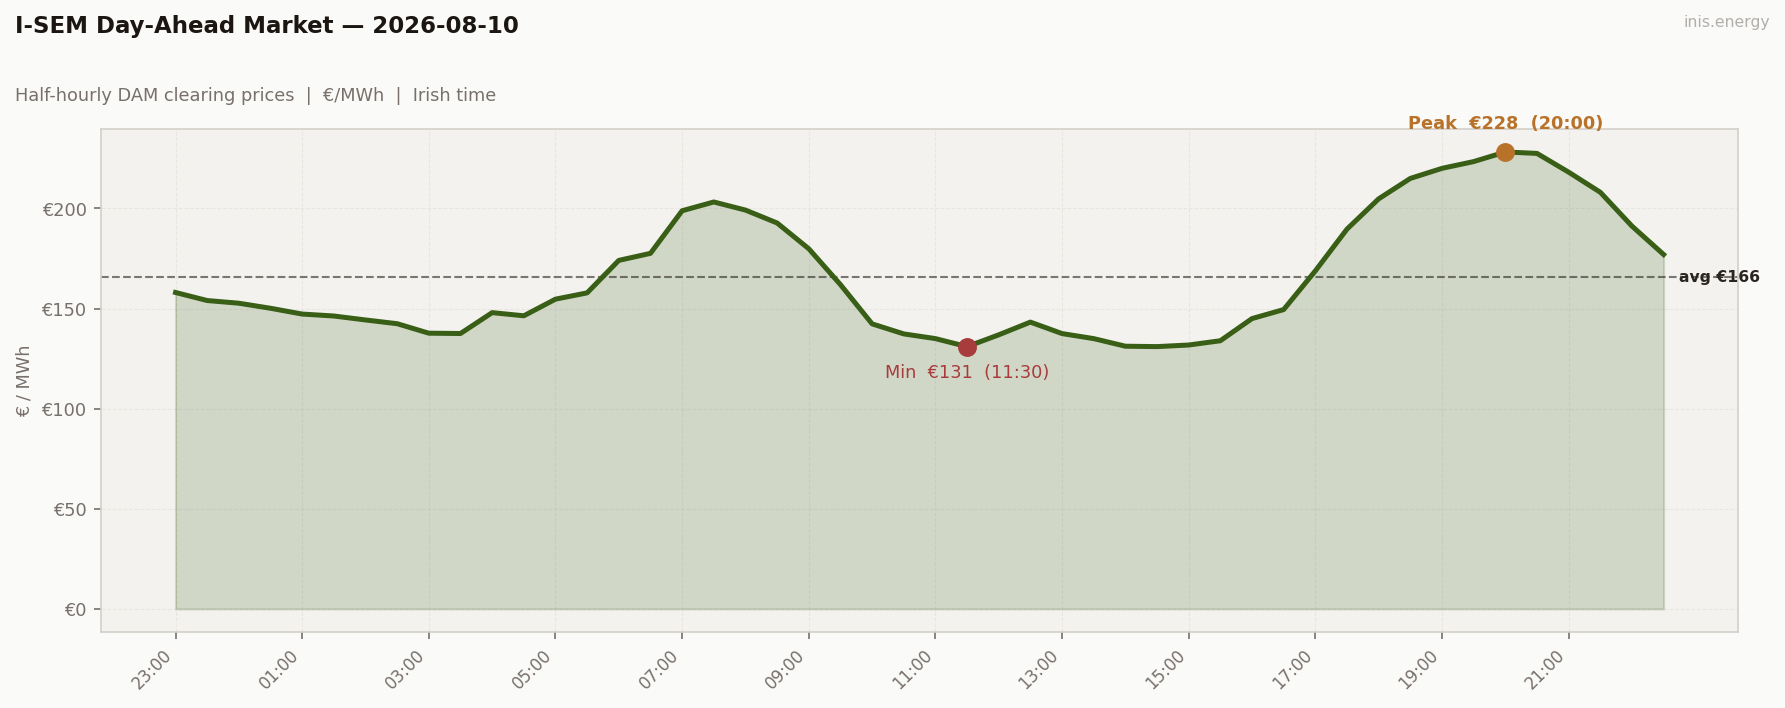
Std dev €31.03/MWh · Median €153.34/MWh · Periods above €150: 26 of 48 (54%)
Week in Context #
Price Duration Curve #
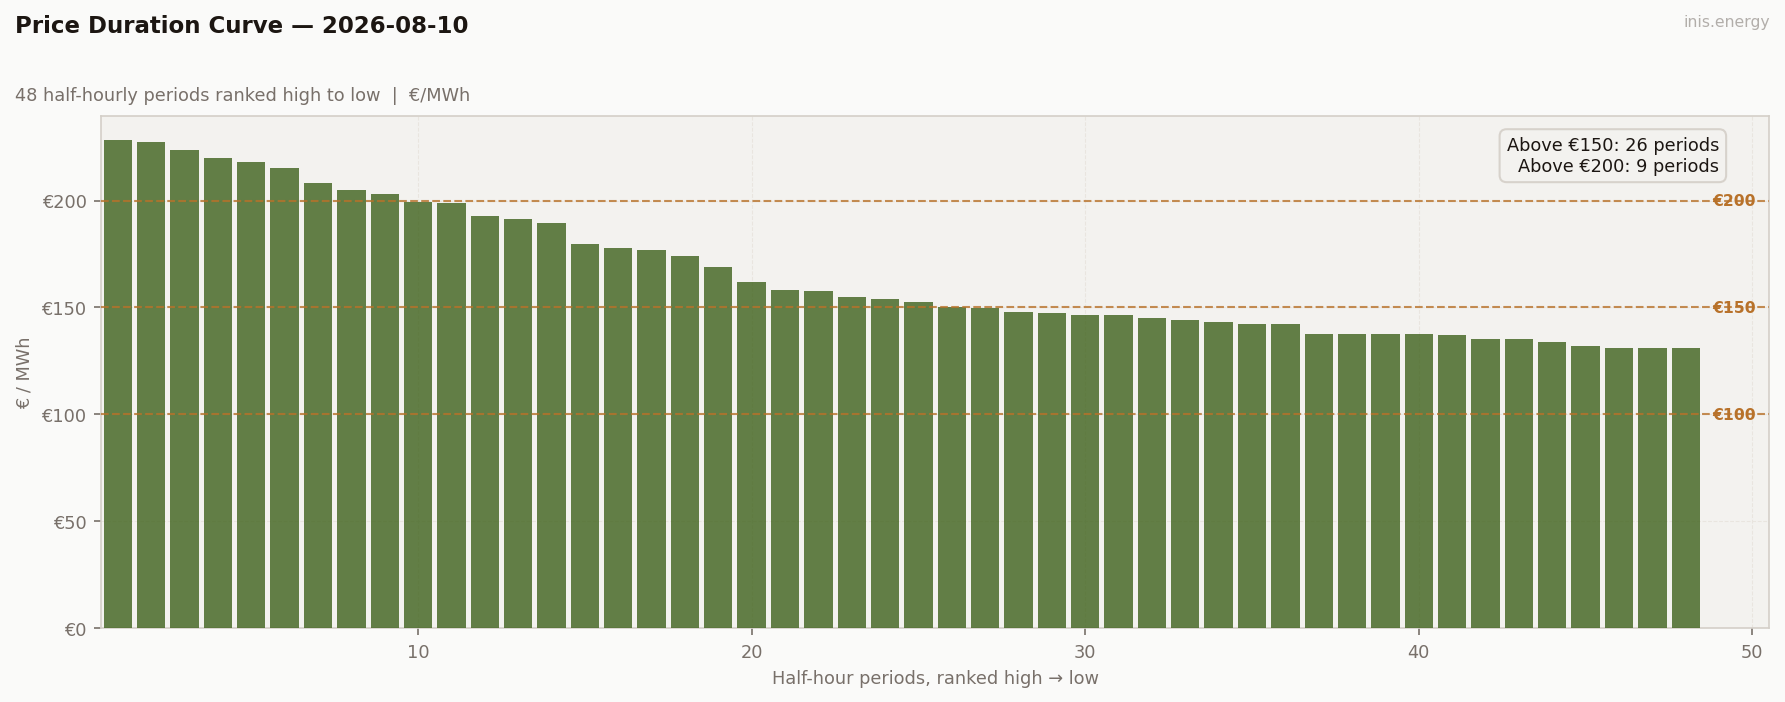
Periods above €150: 26 (54% of day) · Above €200: 9 (19% of day)
Peak / Off-Peak Spread #
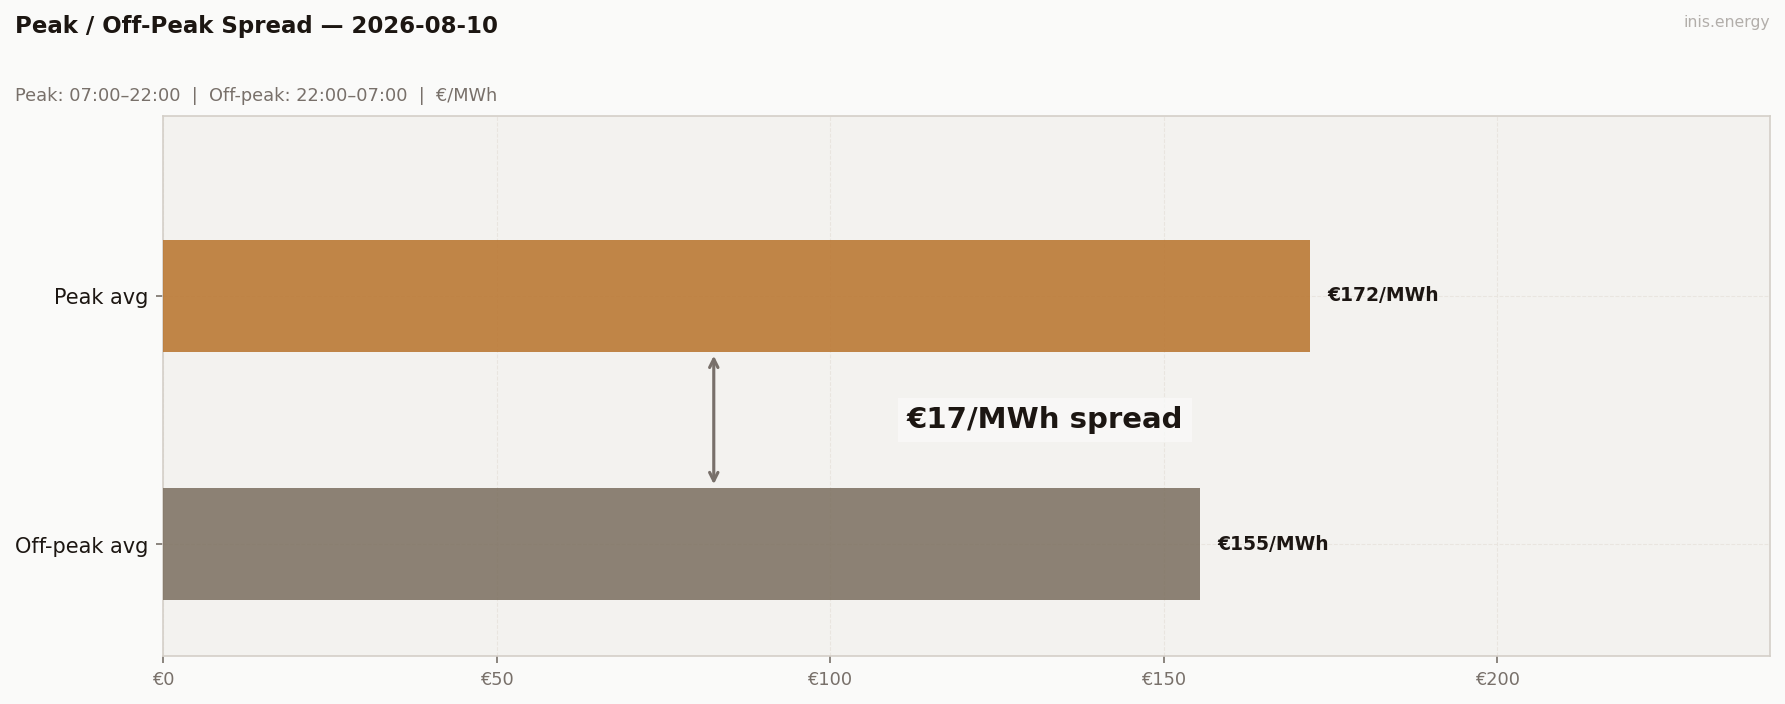
Peak avg (07:00–22:00): €172.01/MWh · Off-peak avg: €155.4/MWh · Spread: €16.61/MWh
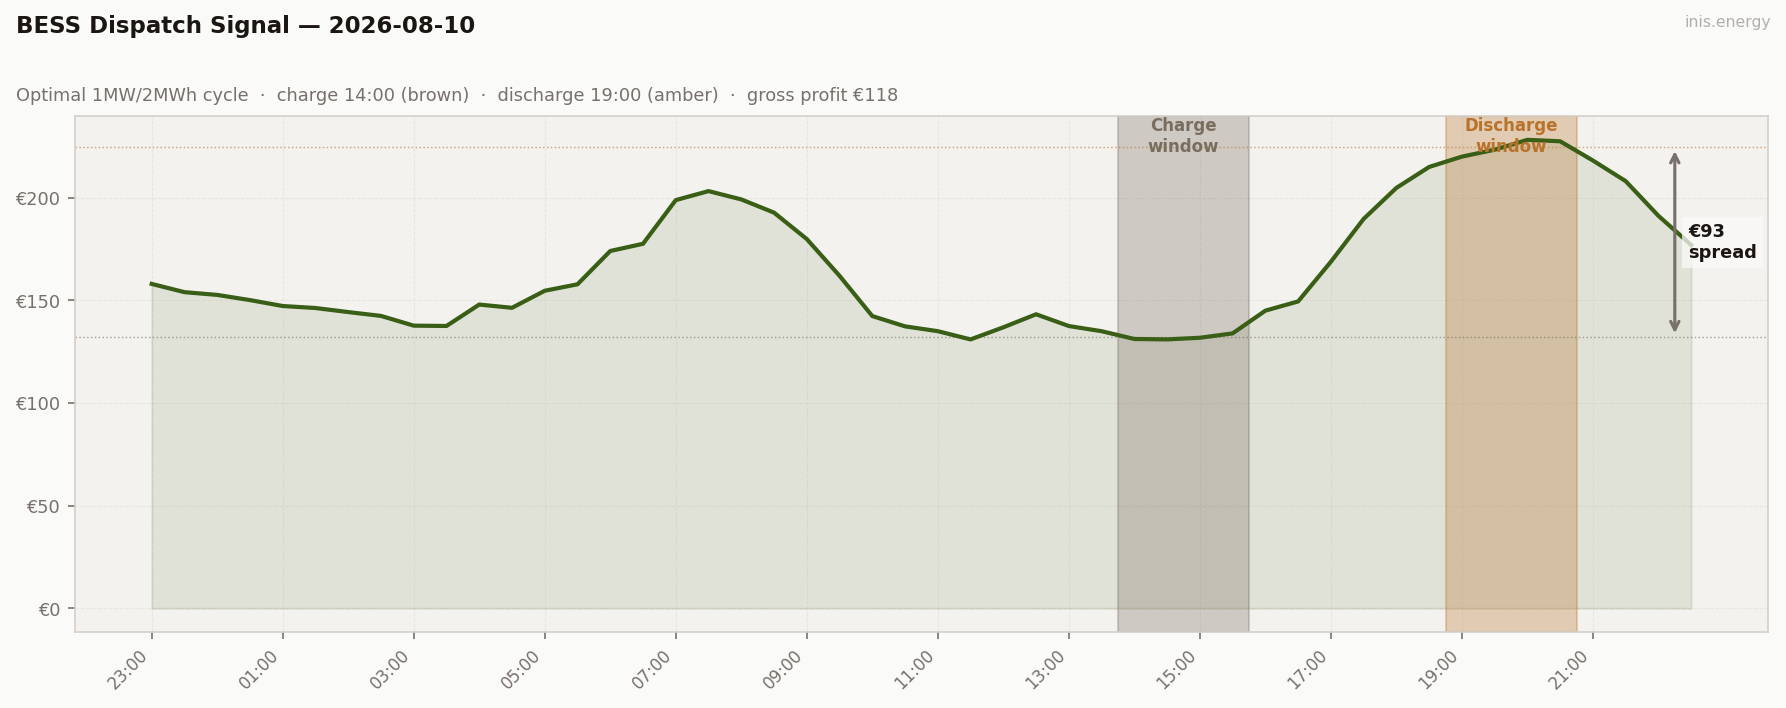
BESS Dispatch Signal #
| Price | Time | Energy | Value | |
|---|---|---|---|---|
| Charge | €132/MWh | 14:00 | 2 MWh | −€264 |
| Discharge | €225/MWh | 19:00 | 1.7 MWh (85% RTE) | +€382 |
| Gross profit | €118 | |||
| Price spread | €93/MWh | ROI: 44.8% |
Simulated 1MW/2MWh battery, one optimal DAM cycle. Gross before network charges and capacity costs.
Commentary #
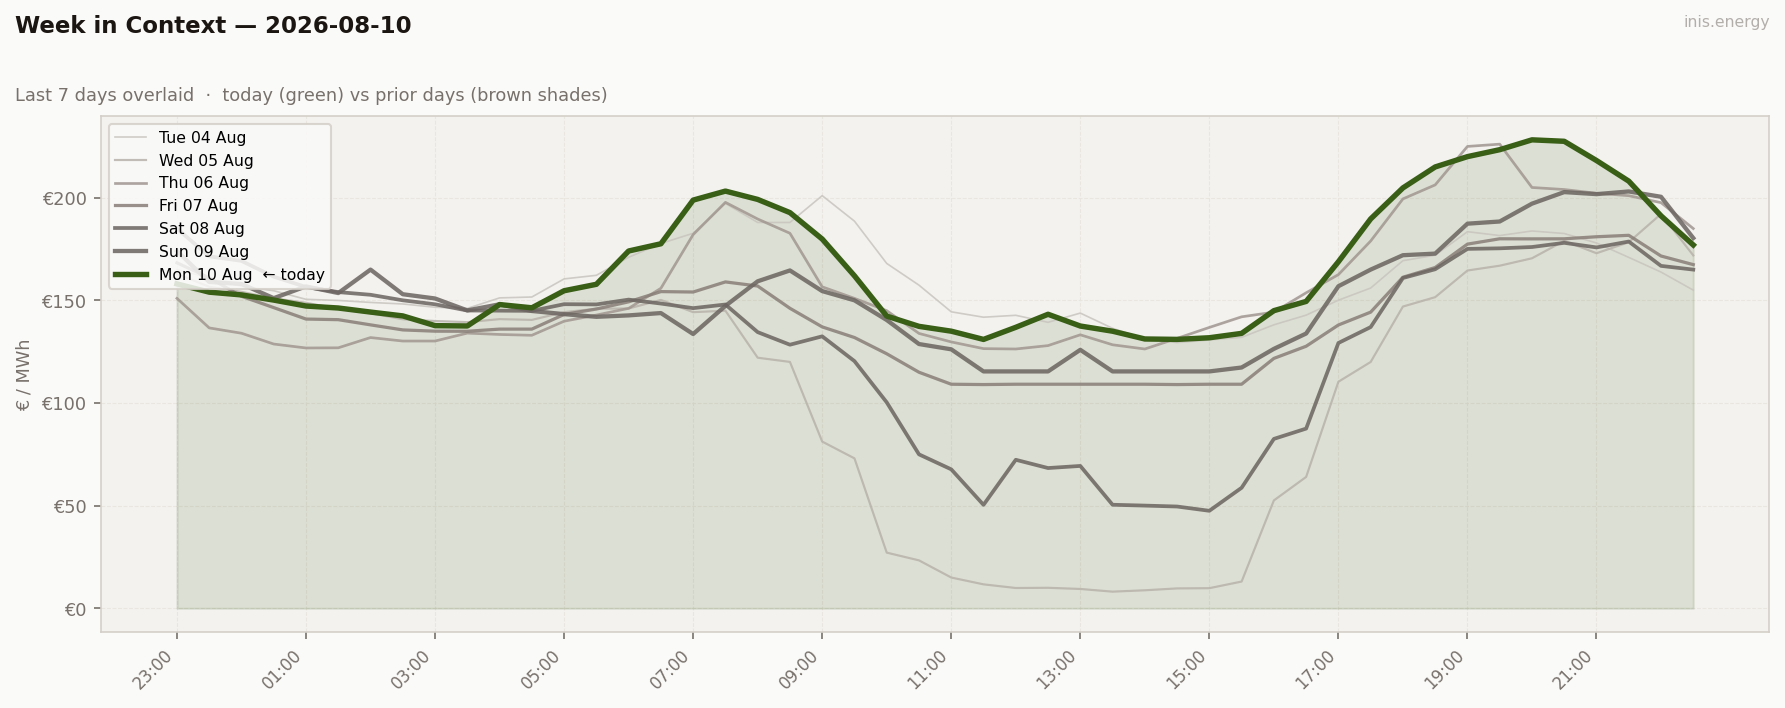
Monday brought the week’s most expensive day by every measure: mean €165.78, and a €228.21 peak at 20:00 — the highest single price of the week, edging out Thursday’s €226.11. The shape echoes the 4th’s double-hump — a steep pre-dawn ramp into a morning shoulder at €203.24 (07:30), a modest €130.99 midday trough at 11:30, then a hard afternoon build into the evening peak, holding above €200 from 18:00 clean through to 21:00.
Nine of 48 periods cleared €200 — nearly a fifth of the day — the most scarcity-priced periods of any day this week. Unlike the 4th, though, the evening hump here comfortably out-ran the morning one, and with both troughs and both peaks sitting inside the 07:00–22:00 window, the peak/off-peak spread came out positive at €16.61 — a proper, if pricier, version of Thursday’s shape.
Storage had its best gross of the week by absolute euros: €132 charge against a €225 discharge, €118 gross, 44.8% ROI. Return-on-capital sits below Wednesday’s and Saturday’s outliers, but in pure cash terms this was the week’s strongest single cycle — Monday demand meeting a gas-heavy stack made for an expensive, but reliably shaped, trading day.
Half-hourly data — 2026-08-10
| Period | Time | Price (€/MWh) |
|---|---|---|
| 1 | 23:00 | 158.03 |
| 2 | 23:30 | 154.01 |
| 3 | 00:00 | 152.67 |
| 4 | 00:30 | 150.15 |
| 5 | 01:00 | 147.26 |
| 6 | 01:30 | 146.29 |
| 7 | 02:00 | 144.31 |
| 8 | 02:30 | 142.44 |
| 9 | 03:00 | 137.70 |
| 10 | 03:30 | 137.54 |
| 11 | 04:00 | 147.97 |
| 12 | 04:30 | 146.39 |
| 13 | 05:00 | 154.70 |
| 14 | 05:30 | 157.84 |
| 15 | 06:00 | 174.06 |
| 16 | 06:30 | 177.58 |
| 17 | 07:00 | 198.85 |
| 18 | 07:30 | 203.24 |
| 19 | 08:00 | 199.19 |
| 20 | 08:30 | 192.75 |
| 21 | 09:00 | 179.88 |
| 22 | 09:30 | 161.97 |
| 23 | 10:00 | 142.36 |
| 24 | 10:30 | 137.35 |
| 25 | 11:00 | 135.00 |
| 26 | 11:30 | 130.99 |
| 27 | 12:00 | 136.89 |
| 28 | 12:30 | 143.24 |
| 29 | 13:00 | 137.51 |
| 30 | 13:30 | 134.99 |
| 31 | 14:00 | 131.20 |
| 32 | 14:30 | 131.00 |
| 33 | 15:00 | 131.80 |
| 34 | 15:30 | 133.93 |
| 35 | 16:00 | 145.00 |
| 36 | 16:30 | 149.50 |
| 37 | 17:00 | 168.83 |
| 38 | 17:30 | 189.69 |
| 39 | 18:00 | 204.80 |
| 40 | 18:30 | 215.00 |
| 41 | 19:00 | 220.03 |
| 42 | 19:30 | 223.41 |
| 43 | 20:00 | 228.21 |
| 44 | 20:30 | 227.50 |
| 45 | 21:00 | 218.13 |
| 46 | 21:30 | 208.09 |
| 47 | 22:00 | 191.19 |
| 48 | 22:30 | 177.00 |
Compare your business electricity and gas rates in minutes with INIS Energy Brokers.
Compare rates