I-SEM Daily Briefing — 13 August 2026
Table of Contents
Market Snapshot
| Metric | Value |
|---|---|
| Mean DAM Price | €196.14/MWh |
| Median Price | €179.35/MWh |
| Std Dev | €49.4/MWh |
| Peak Price | €312.1/MWh (19:30) |
| Min Price | €138.5/MWh (14:30) |
| Price Range | €173.6/MWh |
| Periods above €150 | 40 of 48 (83%) |
| Periods above €200 | 19 of 48 (40%) |
| Peak Avg (07–22) | €204.52/MWh |
| Off-peak Avg (22–07) | €182.17/MWh |
| Peak/Off-Peak Spread | €22.35/MWh |
| Wind % of Demand | 9.9% |
| Wind Range | 5.8%–17.2% |
| Mean Demand | 4059 MW |
Price Profile #
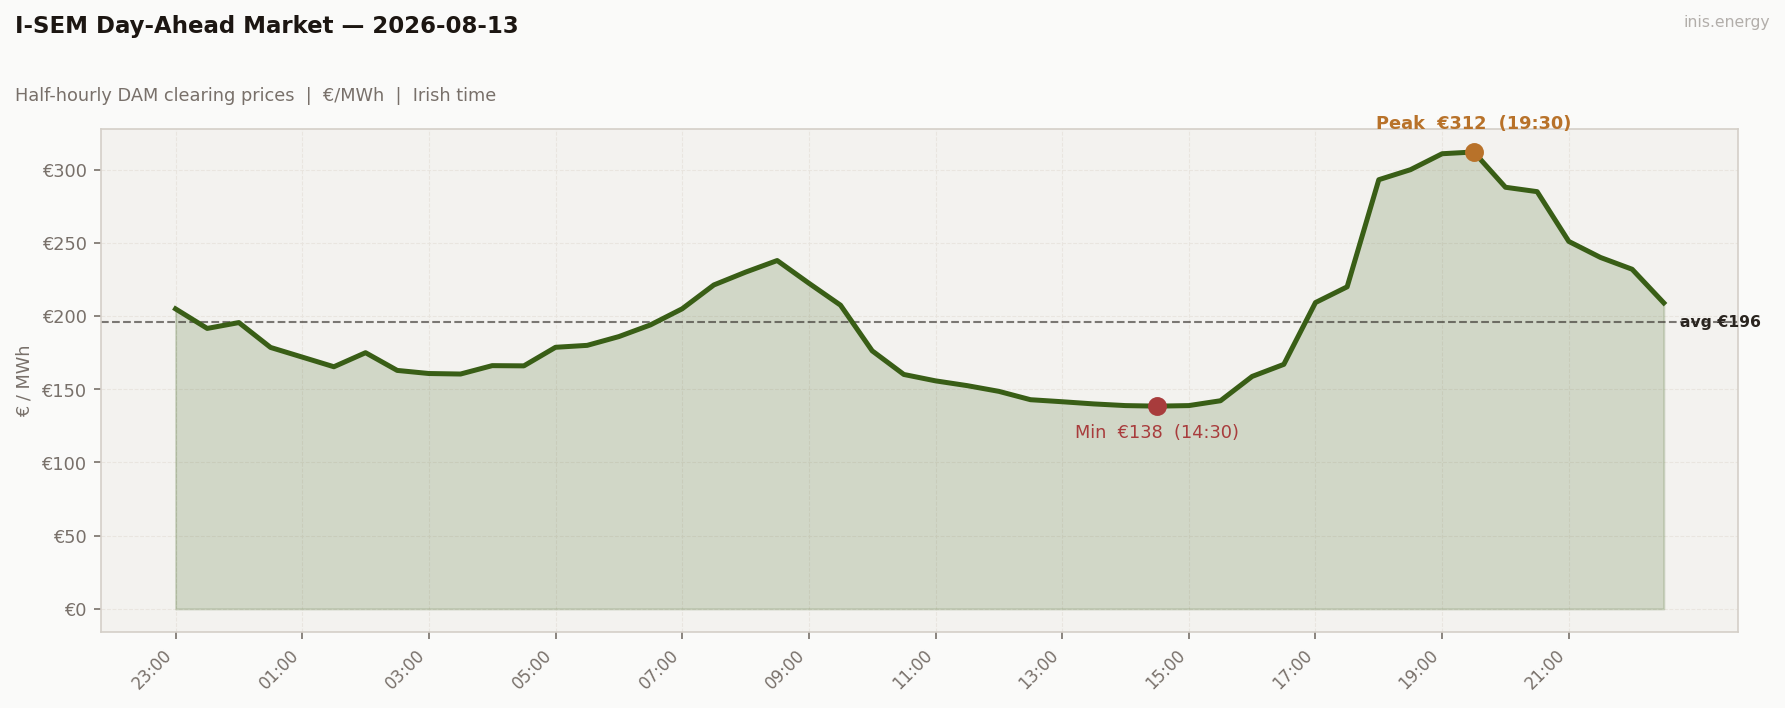
Std dev €49.4/MWh · Median €179.35/MWh · Periods above €150: 40 of 48 (83%)
Price vs Wind #
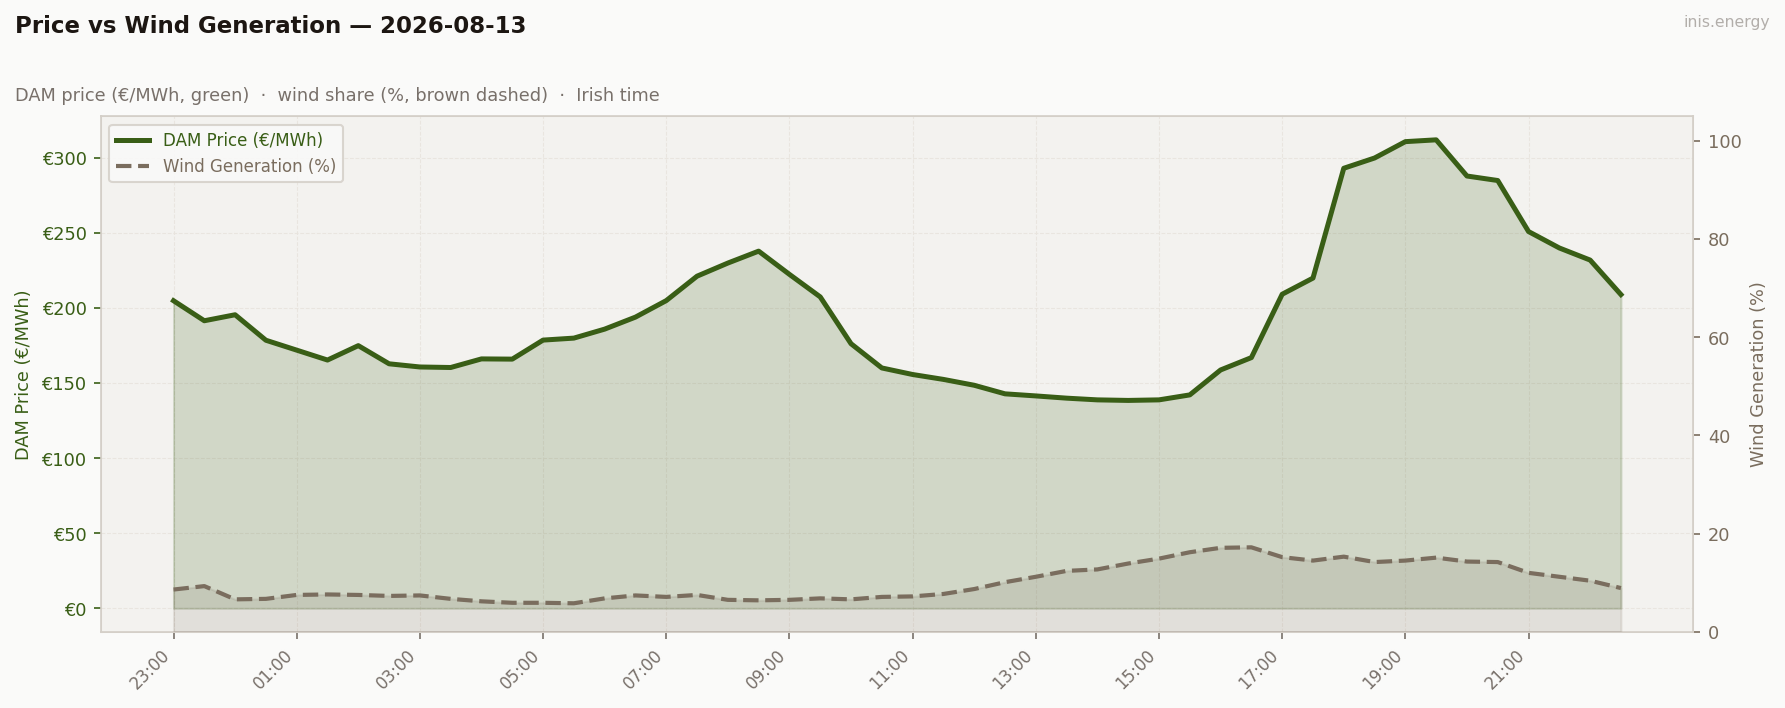
Mean wind: 9.9% · Range: 5.8%–17.2%
Week in Context #
Price Duration Curve #
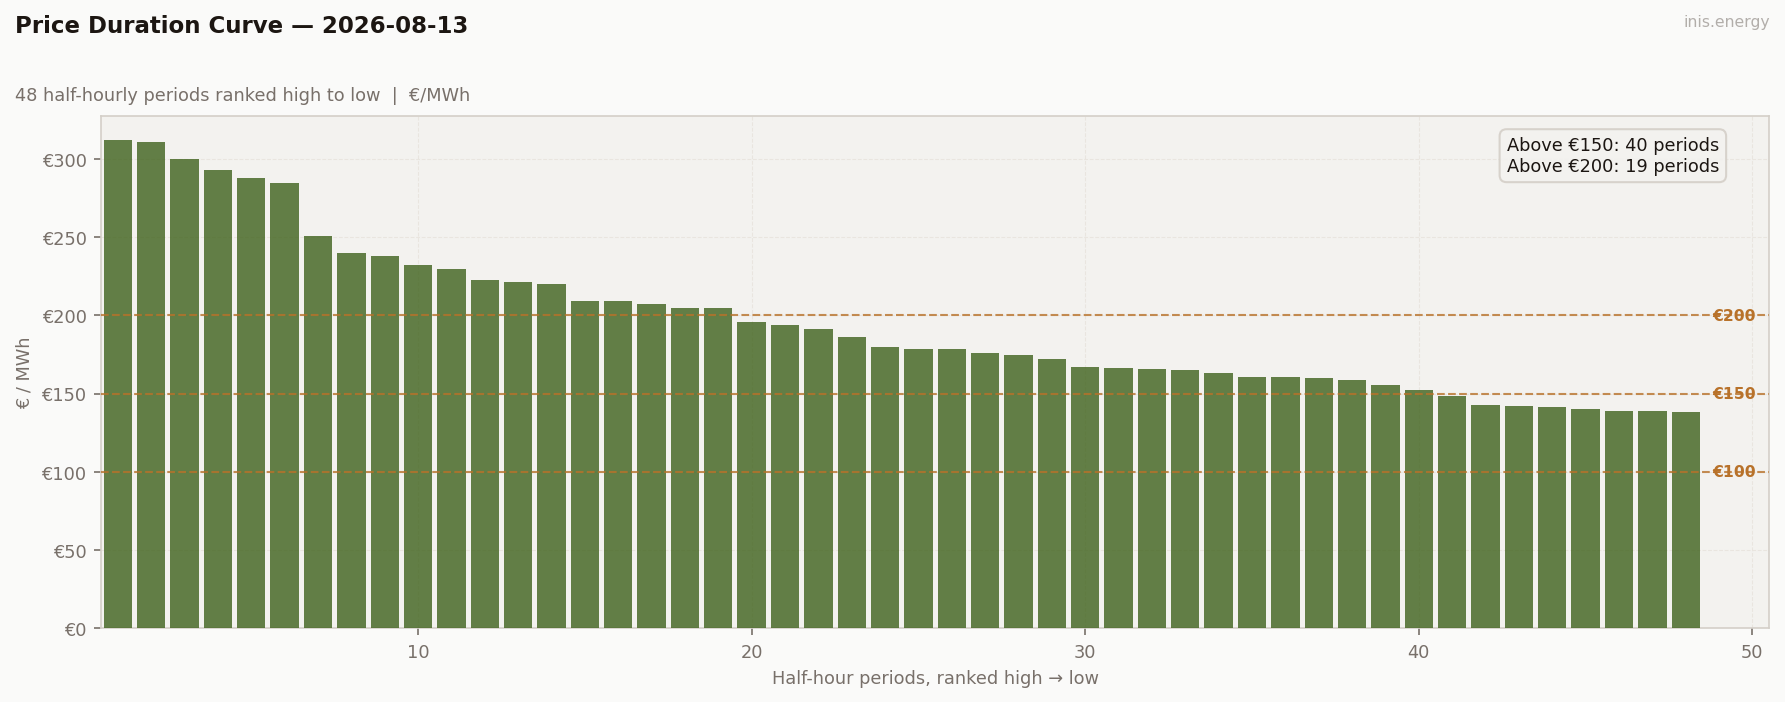
Periods above €150: 40 (83% of day) · Above €200: 19 (40% of day)
Peak / Off-Peak Spread #
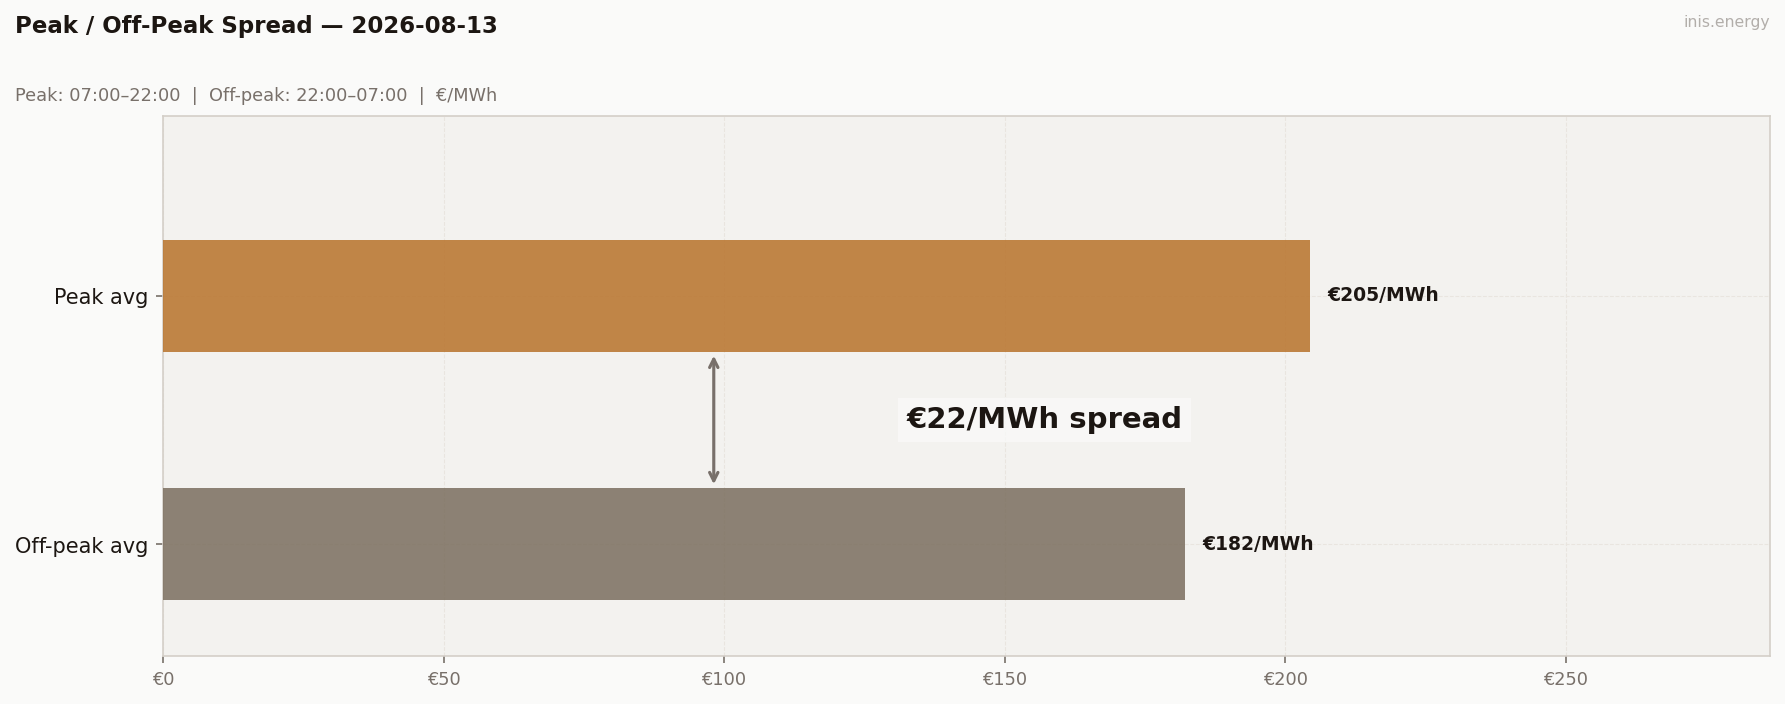
Peak avg (07:00–22:00): €204.52/MWh · Off-peak avg: €182.17/MWh · Spread: €22.35/MWh
BESS Dispatch Signal #
| Price | Time | Energy | Value | |
|---|---|---|---|---|
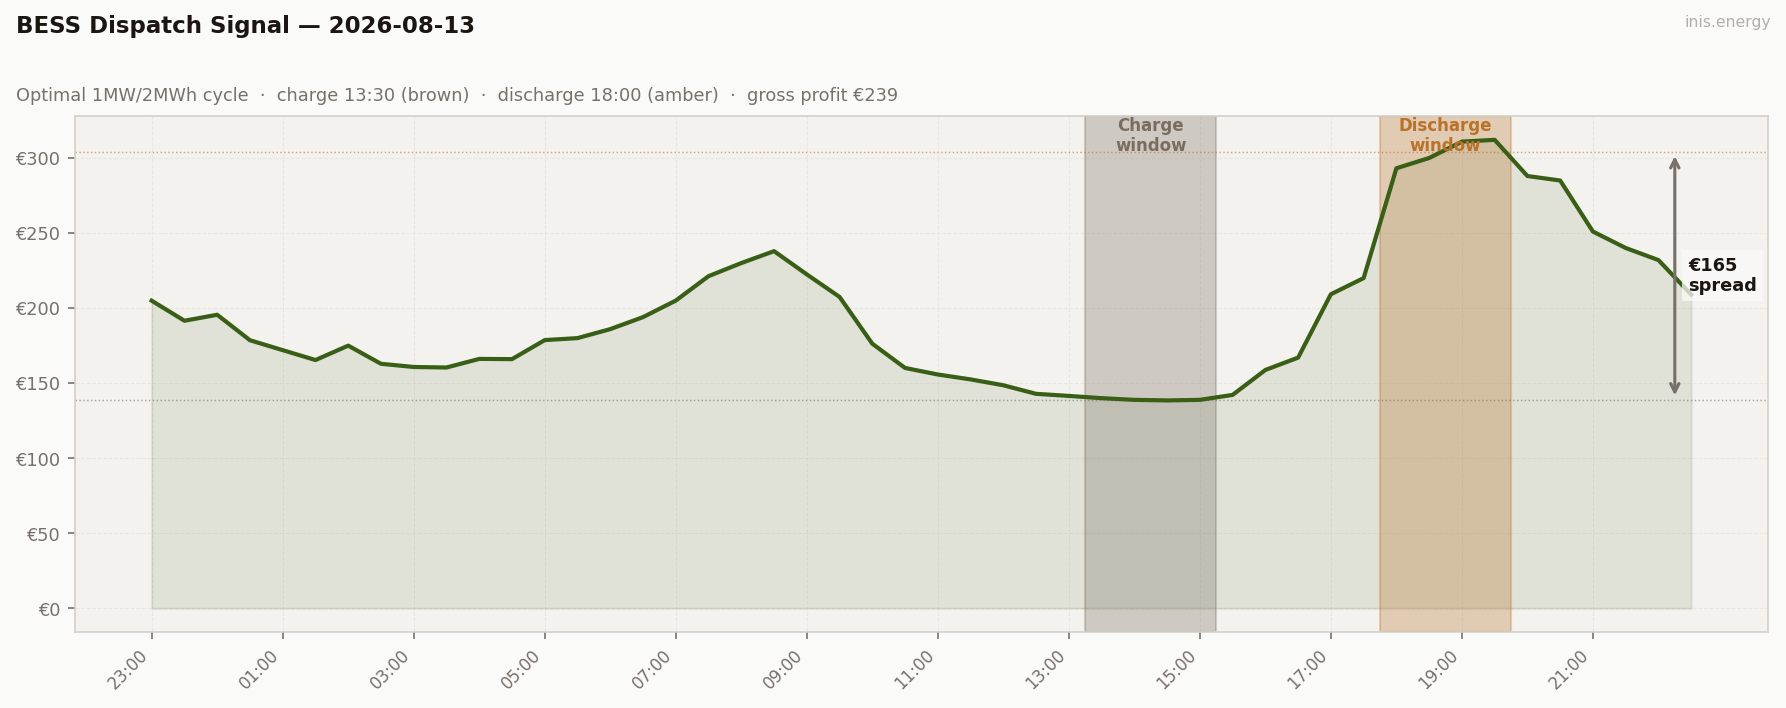
| Charge | €139/MWh | 13:30 | 2 MWh | −€278 |
| Discharge | €304/MWh | 18:00 | 1.7 MWh (85% RTE) | +€517 |
| Gross profit | €239 | |||
| Price spread | €165/MWh | ROI: 85.8% |
Simulated 1MW/2MWh battery, one optimal DAM cycle. Gross before network charges and capacity costs.
Commentary #
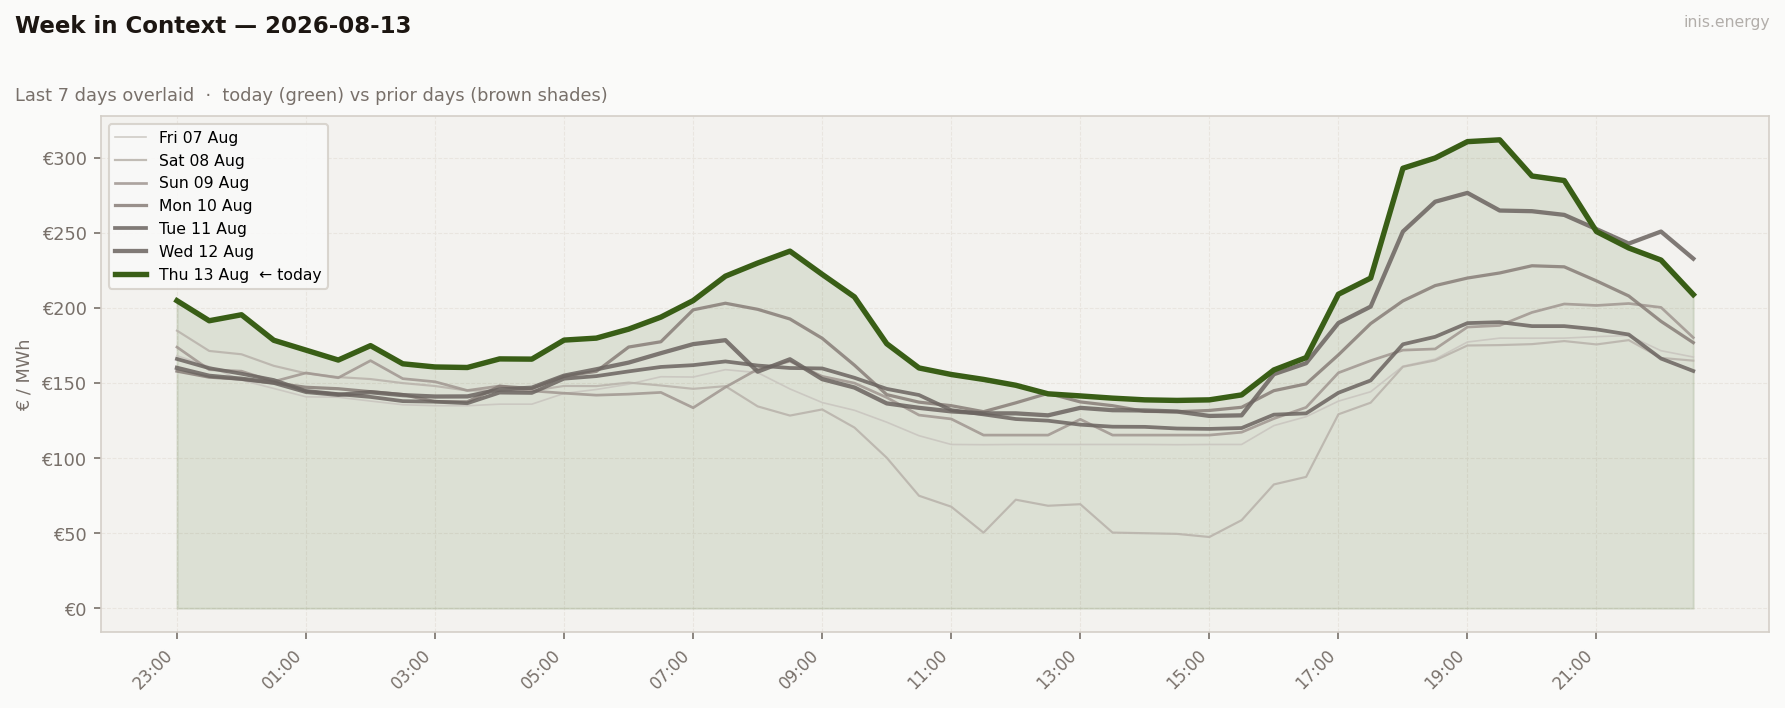
Thursday delivered the week’s clearest scarcity signal. Wind collapsed to 9.9% (5.8–17.2%, never breaking out of single digits-to-teens all day) and the market priced it accordingly: mean €196.14, the week’s highest, on a peak of €312.1 at 19:30 — also the week’s highest. Forty of forty-eight periods cleared above €150 (83%) and nineteen above €200 (40%), the most scarce day so far. Low wind alone doesn’t set the ceiling — it removes the buffer, and thermal plant does the rest once evening demand arrives.
Storage had a strong day of it: charge at 13:30’s €139 trough, discharge into the 18:00 ramp at €304, for €239 gross and 85.8% ROI. The cause-and-effect chain is direct here — the lower the wind, the wider the trough-to-peak spread, the better the battery does.
Half-hourly data — 2026-08-13
| Period | Time | Price (€/MWh) | Wind % |
|---|---|---|---|
| 1 | 23:00 | 204.93 | 8.6% |
| 2 | 23:30 | 191.58 | 9.3% |
| 3 | 00:00 | 195.57 | 6.6% |
| 4 | 00:30 | 178.59 | 6.7% |
| 5 | 01:00 | 172.00 | 7.5% |
| 6 | 01:30 | 165.40 | 7.6% |
| 7 | 02:00 | 175.00 | 7.5% |
| 8 | 02:30 | 162.90 | 7.3% |
| 9 | 03:00 | 160.78 | 7.4% |
| 10 | 03:30 | 160.43 | 6.7% |
| 11 | 04:00 | 166.16 | 6.2% |
| 12 | 04:30 | 166.01 | 5.9% |
| 13 | 05:00 | 178.69 | 5.9% |
| 14 | 05:30 | 180.01 | 5.8% |
| 15 | 06:00 | 186.00 | 6.8% |
| 16 | 06:30 | 194.00 | 7.4% |
| 17 | 07:00 | 205.00 | 7.1% |
| 18 | 07:30 | 221.27 | 7.5% |
| 19 | 08:00 | 230.01 | 6.5% |
| 20 | 08:30 | 237.95 | 6.4% |
| 21 | 09:00 | 222.47 | 6.5% |
| 22 | 09:30 | 207.46 | 6.8% |
| 23 | 10:00 | 176.28 | 6.6% |
| 24 | 10:30 | 160.13 | 7.1% |
| 25 | 11:00 | 155.77 | 7.2% |
| 26 | 11:30 | 152.50 | 7.7% |
| 27 | 12:00 | 148.60 | 8.7% |
| 28 | 12:30 | 142.89 | 10.1% |
| 29 | 13:00 | 141.50 | 11.2% |
| 30 | 13:30 | 140.01 | 12.4% |
| 31 | 14:00 | 138.87 | 12.7% |
| 32 | 14:30 | 138.50 | 13.9% |
| 33 | 15:00 | 138.87 | 14.9% |
| 34 | 15:30 | 142.18 | 16.2% |
| 35 | 16:00 | 158.79 | 17.1% |
| 36 | 16:30 | 167.03 | 17.2% |
| 37 | 17:00 | 209.24 | 15.2% |
| 38 | 17:30 | 220.00 | 14.5% |
| 39 | 18:00 | 293.16 | 15.3% |
| 40 | 18:30 | 300.00 | 14.2% |
| 41 | 19:00 | 310.90 | 14.5% |
| 42 | 19:30 | 312.10 | 15.1% |
| 43 | 20:00 | 288.00 | 14.3% |
| 44 | 20:30 | 285.00 | 14.2% |
| 45 | 21:00 | 251.00 | 12.0% |
| 46 | 21:30 | 240.06 | 11.2% |
| 47 | 22:00 | 232.00 | 10.4% |
| 48 | 22:30 | 209.02 | 8.9% |
Compare your business electricity and gas rates in minutes with INIS Energy Brokers.
Compare rates