I-SEM Daily Briefing — 4 May 2026
Table of Contents
Market Snapshot
| Metric | Value |
|---|---|
| Mean DAM Price | €152.58/MWh |
| Peak Price | €213.69/MWh (21:00) |
| Min Price | €125.05/MWh (00:30) |
| Price Range | €88.64/MWh |
| Wind % of Demand | 13.0% |
| Mean Demand | 3633 MW |
Price Profile #
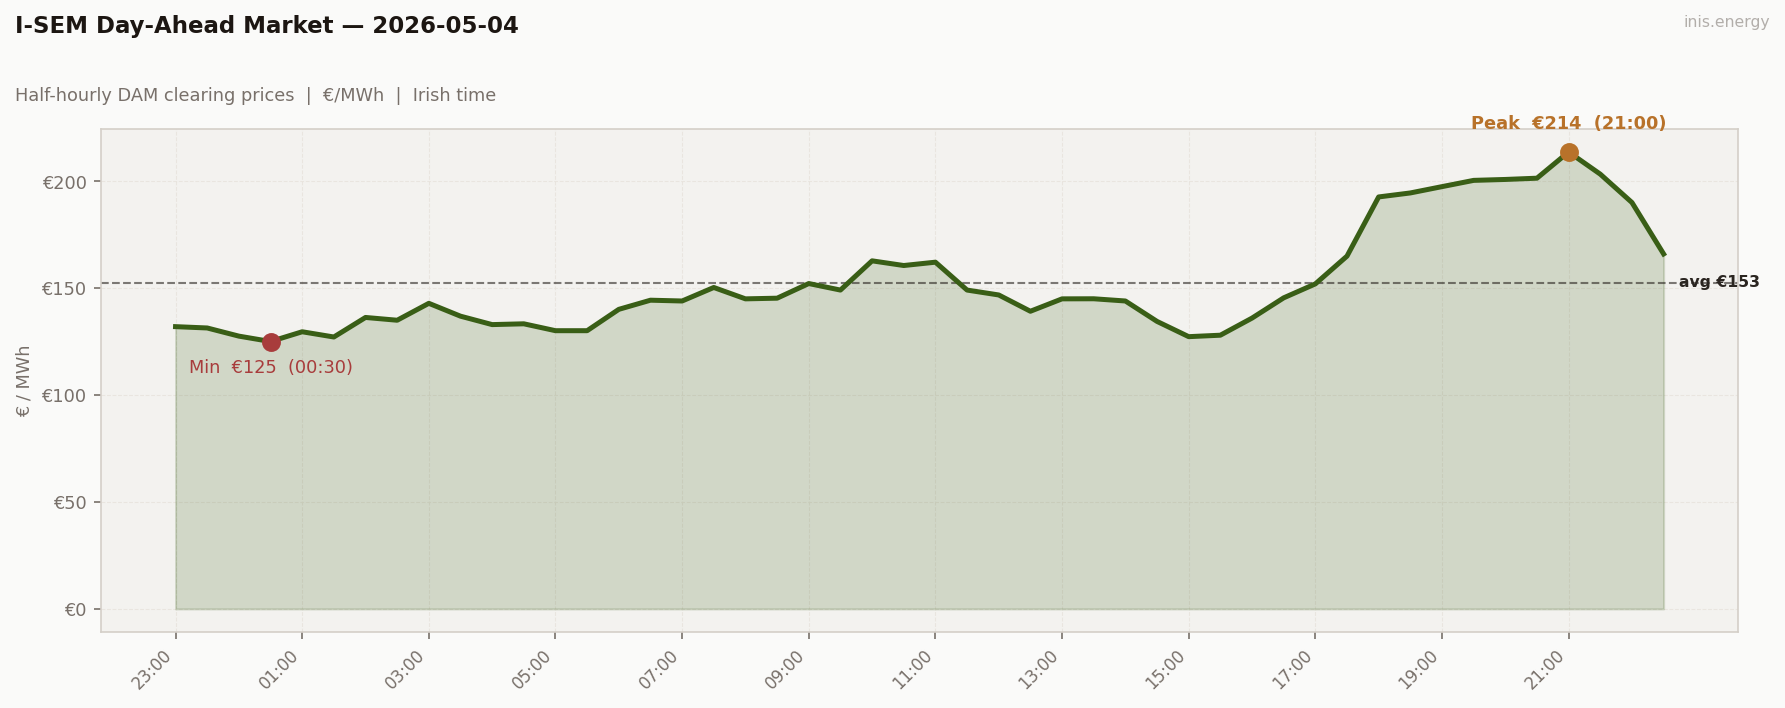
The effect of the bank holiday Monday is clear from the lack of a morning ramp that you’d expect from a typical weekday. Usually the commercial/industrial cycles waking up would create a thermal ramp that is not seen here. Our ramp today is high, and flat (€133/MWh at 06:00 up to €150/MWh at 09:00). It’s a high & flat overnight slope (€166 at 22:30 down to €135/MWh at 04:00), with a small residential peak (€214) at 21:00, and an average price of €153/MWh.
Price vs Wind #
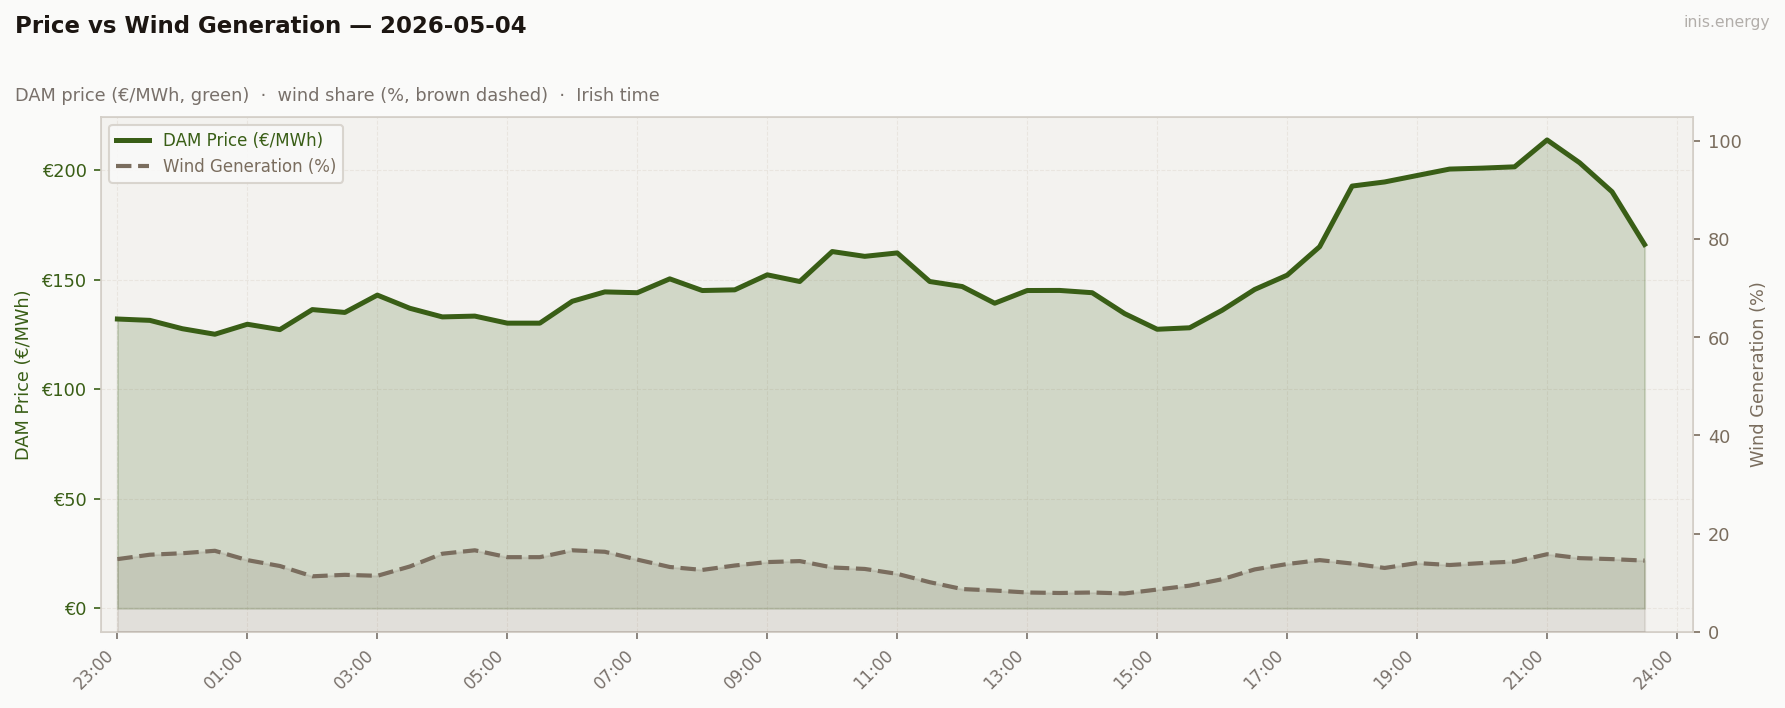
The Price vs Wind chart show a typical inverse of prices falling when the wind rises. Cannibalisation is not seen here with wind this low, as renewables did nothign to discipline price, so the system fell back on gas causing our high €125/MWh floor.
Worth nothing that since the wind fell so low, the few wind MWh that did generate, captured a high price. The opposite of cannibalisation.
Week in Context #
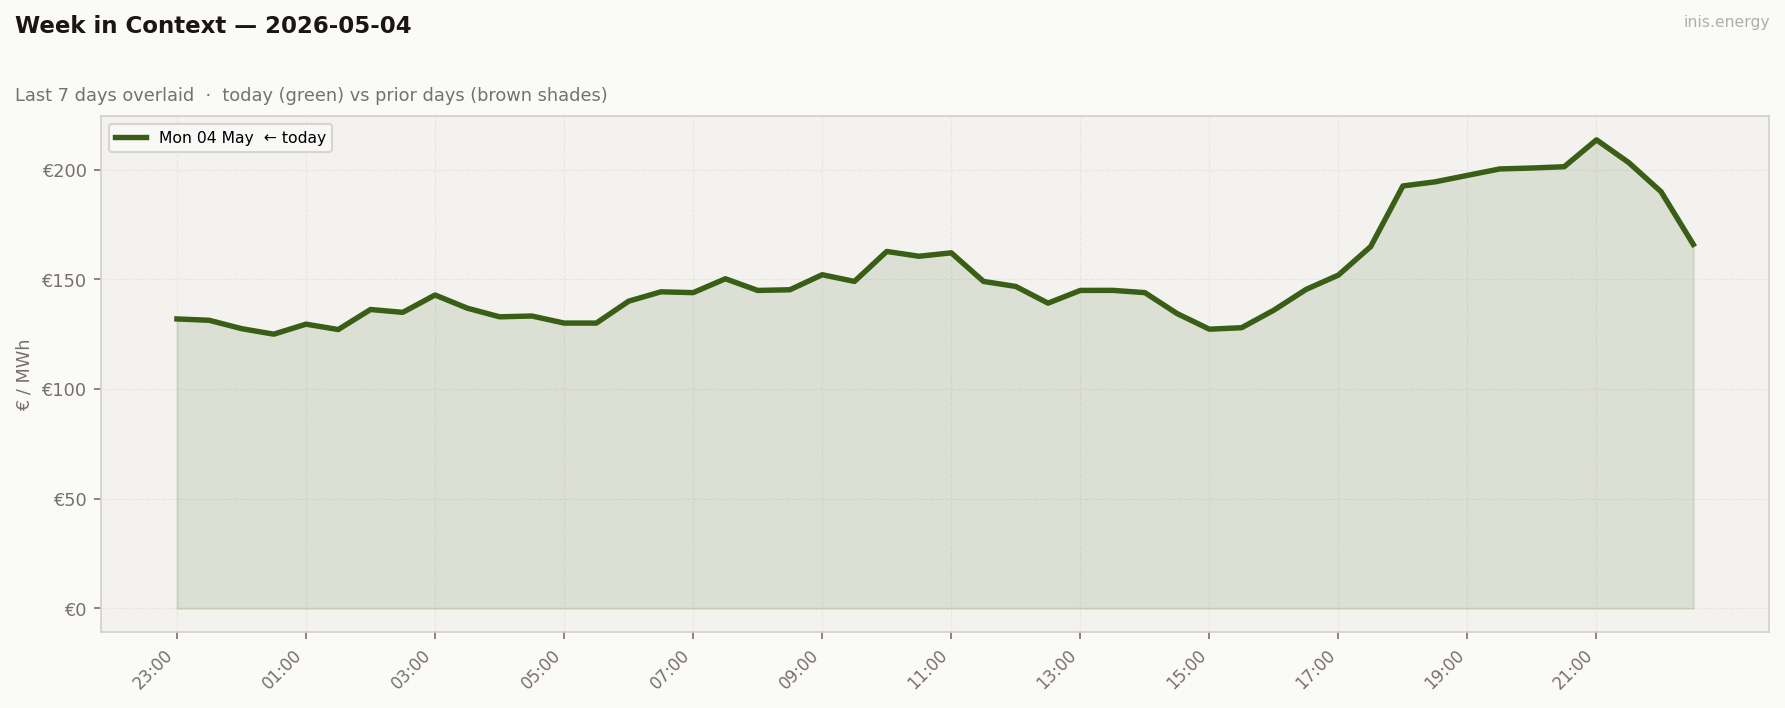
This is the blog’s first post, baseline starts here. Week in context will come later.
Price Duration Curve #
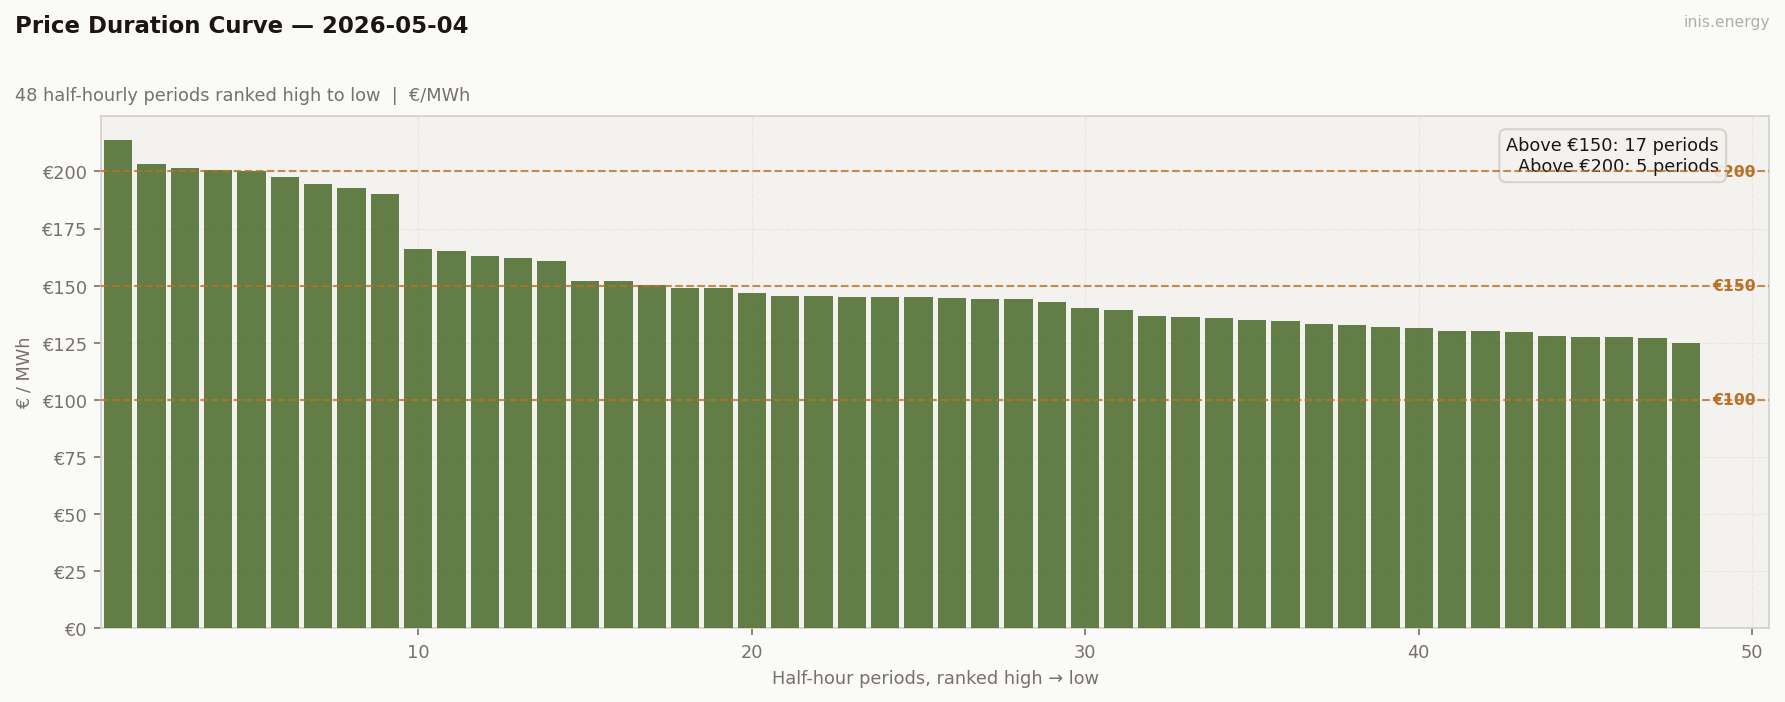
The PDC (Price Duration Curve) ranks oour 48 half-hour periods from high to low. Our curve here is high & flat, meaning Monday was expensive, stable, and provided little intra-day volatility.
There are modest to few scarcity hours, with only 4 periods barely breaking €200, and 13 periods more breaking over €150. What’s most important about this curve is it’s floor being lifted to €125. A well supplied market would be flat and low, whereas this is flat and expensive -> Little wind induces a gas-set day.
Our full range is €88/MWh
Peak / Off-Peak Spread #
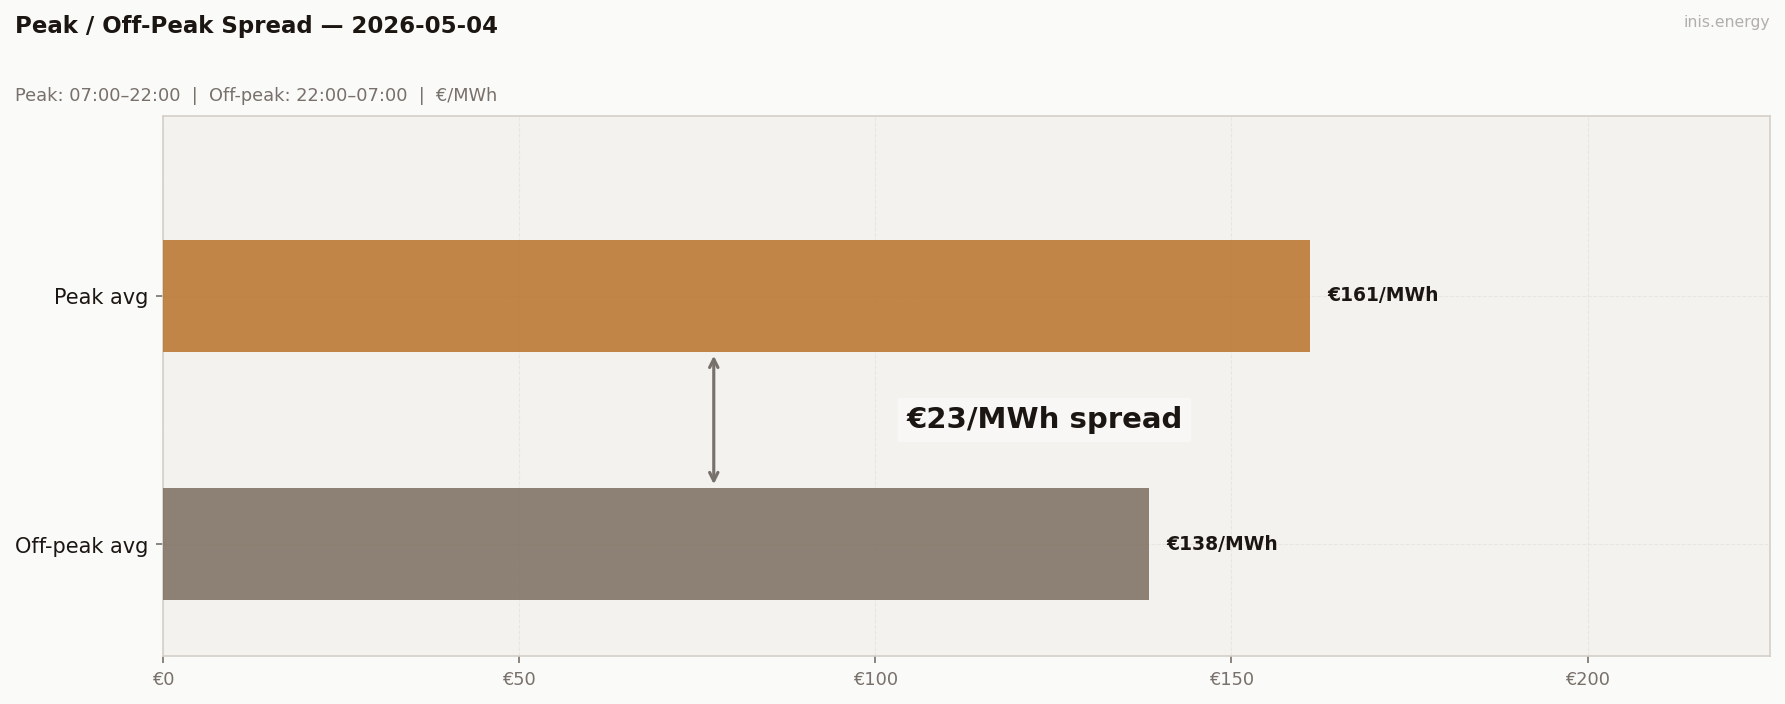
€Peak Avg: €161/MWh | €Off-Peak Avg: €138/MWh
This has a moderate spread that is being compressed from below. It’s brought up to a moderate spread due to the residential peak at 21:00 (€214) which lifts the peak-period average. The Off-Peak average is dragged up by the €125+ /MWh floor. This gave up no cheap off-peak window.
When the spread is compressed from below, there’s no cheap charge window for storage/BESS (Battery Energy Storage Systems). Despite the elevated price level, this is a poor day for flexibility.
BESS Dispatch Signal #
| Price | Time | Energy | Value | |
|---|---|---|---|---|
| Charge | €127/MWh | 00:00 | 2 MWh | −€255 |
| Discharge | €205/MWh | 20:00 | 1.7 MWh (85% RTE) | +€348 |
| Gross profit | €93 |
Simulated 1MW/2MWh battery, one optimal DAM cycle. Gross before network charges and capacity costs.
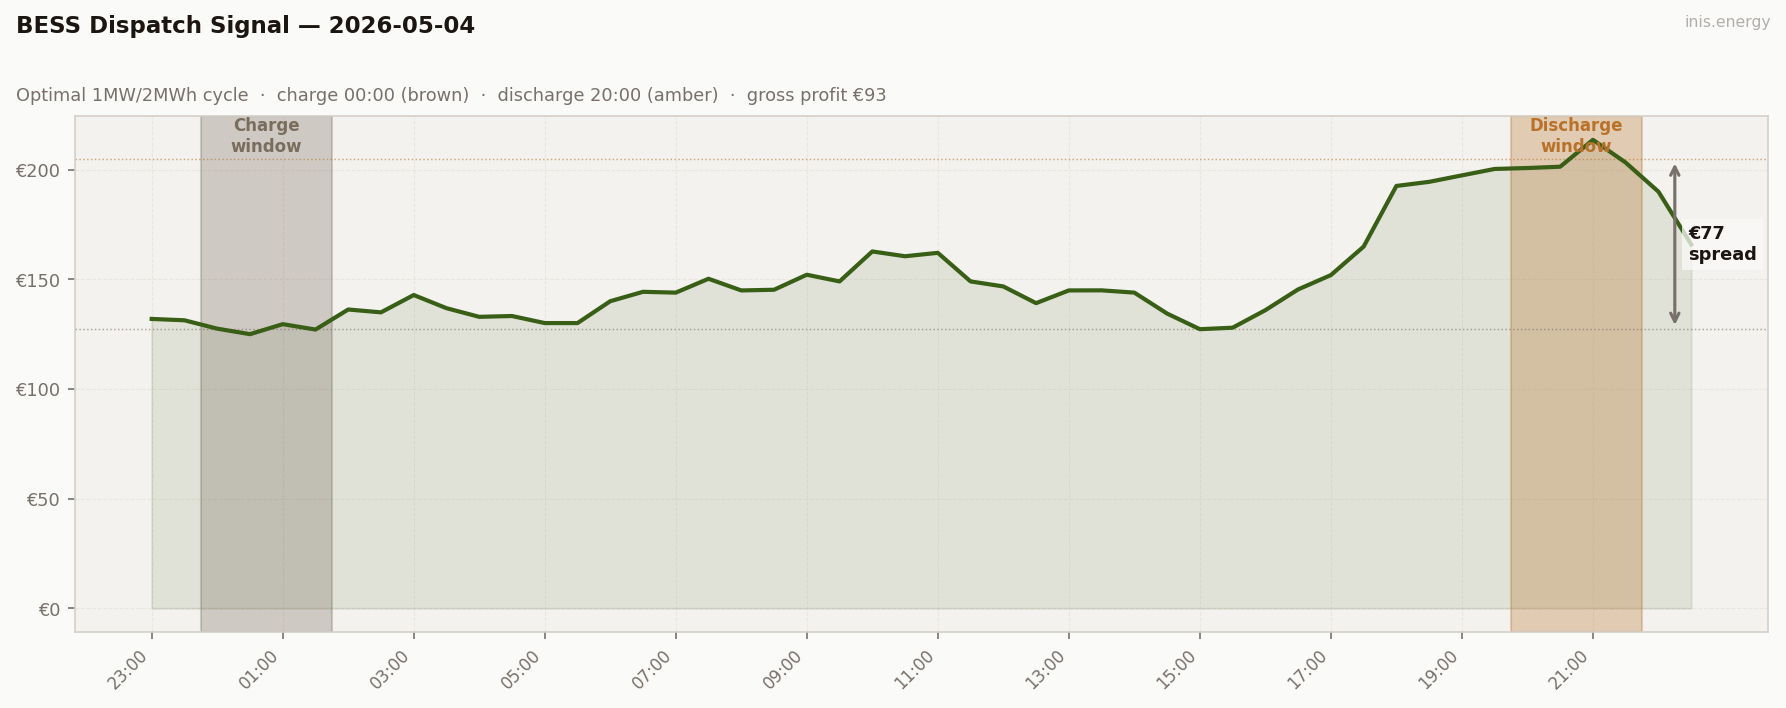
A €93 gross on a 1MW/2MWh cycle is mediocre, and the reason why is entirely due to the charge price.
[A 1MW/2MWh battery cycles means the battery can discarge for 1MW of power, and it can do that for 2hours before it’s empty. So it’s a battery with 1MW output power, and a 2MWh energy capacity].
A good BESS day charges near €20-40 on a windy night, and discharges into a €250+ MW/h peak. This Monday saw the battery being squeezed on both ends, providing no cheap trough. A €127 charge is barely above the €125 minimum, along with a lack of a scarcity spike (€205 discharge).
Due to heat and internal losses, you never get back what you put in. When I mention ‘85% rte’, I’m referring to a battery’s 85% round-trip efficiency, meaning when you put in 100 units, you only get back about 85 units. So for us, our already thin spread loses another chunk to the loss from the 85% rte that the battery goes through: €205 x 2 x 0.85 = €348 revenue €127 x 2 = €255 cost -> €93 net
The same low wind that kept prices high (good for generators), destroyed the volatility that batteries live on. Storage revenue comes from volatility, not from price level. High prices with no spread are worthless to a battery.
Summary #
This May Bank Holiday Monday should have made cheap power. It didn’t. DAM prices averaged €152/MWh - high for a spring day - and never dropped below €125. The holiday demand was there (mean of 3,633MW, no morning ramp), but the supply side overruled it.
Wind, or the lack of it, was the reason why. At 13% of demand, wind was essentially a non-factor. With no renewable depth in the merit order, gas set the marginal price across all 48 periods. This is why our floor was high at €125 and why we saw no cannibalisation on the price vs wind chart.
The singular peak we did see was a residential peak; not a scarcity event. Nothing cleared €200 by much or for long. This was an orderly, thermally-priced day, not a stressed one.
For flexibility, and expensive day like today is not a good day. A simulated 1MW/2MWh battery earned just €93 gross - squeezed at both ends, with no cheap windows to charge (€127) and no spike to discharge into (€205). The takeaway for anyone involved in storage is that revenue is a result of volatility, not price level.
Low wind raises the floor for generators, and flattens the curve for batteries. It’ll be interesting to see if tomorrow, May 5th, inverts this.
Half-hourly data — 2026-05-04
| Period | Time | Price (€/MWh) | Wind % |
|---|---|---|---|
| 1 | 23:00 | 132.00 | 14.8% |
| 2 | 23:30 | 131.38 | 15.7% |
| 3 | 00:00 | 127.57 | 16.0% |
| 4 | 00:30 | 125.05 | 16.5% |
| 5 | 01:00 | 129.61 | 14.6% |
| 6 | 01:30 | 127.16 | 13.4% |
| 7 | 02:00 | 136.30 | 11.3% |
| 8 | 02:30 | 135.00 | 11.6% |
| 9 | 03:00 | 142.91 | 11.4% |
| 10 | 03:30 | 136.90 | 13.3% |
| 11 | 04:00 | 132.96 | 15.9% |
| 12 | 04:30 | 133.33 | 16.6% |
| 13 | 05:00 | 130.11 | 15.2% |
| 14 | 05:30 | 130.11 | 15.2% |
| 15 | 06:00 | 140.09 | 16.6% |
| 16 | 06:30 | 144.37 | 16.3% |
| 17 | 07:00 | 144.00 | 14.7% |
| 18 | 07:30 | 150.32 | 13.2% |
| 19 | 08:00 | 145.00 | 12.6% |
| 20 | 08:30 | 145.31 | 13.5% |
| 21 | 09:00 | 152.16 | 14.2% |
| 22 | 09:30 | 149.11 | 14.4% |
| 23 | 10:00 | 162.78 | 13.1% |
| 24 | 10:30 | 160.59 | 12.8% |
| 25 | 11:00 | 162.15 | 11.8% |
| 26 | 11:30 | 149.11 | 10.1% |
| 27 | 12:00 | 146.82 | 8.7% |
| 28 | 12:30 | 139.20 | 8.4% |
| 29 | 13:00 | 145.00 | 8.0% |
| 30 | 13:30 | 145.04 | 7.9% |
| 31 | 14:00 | 144.00 | 8.0% |
| 32 | 14:30 | 134.45 | 7.8% |
| 33 | 15:00 | 127.32 | 8.6% |
| 34 | 15:30 | 128.00 | 9.4% |
| 35 | 16:00 | 136.00 | 10.7% |
| 36 | 16:30 | 145.47 | 12.7% |
| 37 | 17:00 | 152.00 | 13.8% |
| 38 | 17:30 | 164.99 | 14.6% |
| 39 | 18:00 | 192.66 | 13.9% |
| 40 | 18:30 | 194.53 | 13.0% |
| 41 | 19:00 | 197.48 | 14.0% |
| 42 | 19:30 | 200.41 | 13.6% |
| 43 | 20:00 | 200.84 | 14.0% |
| 44 | 20:30 | 201.43 | 14.3% |
| 45 | 21:00 | 213.69 | 15.8% |
| 46 | 21:30 | 203.31 | 15.0% |
| 47 | 22:00 | 190.05 | 14.8% |
| 48 | 22:30 | 166.00 | 14.5% |
Compare your business electricity and gas rates in minutes with INIS Energy Brokers.
Compare rates