I-SEM Daily Briefing — 5 May 2026
Table of Contents
Market Snapshot
| Metric | Value |
|---|---|
| Mean DAM Price | €173.95/MWh |
| Median Price | €169.56/MWh |
| Std Dev | €18.72/MWh |
| Peak Price | €232.0/MWh (07:30) |
| Min Price | €146.81/MWh (05:00) |
| Price Range | €85.19/MWh |
| Periods above €150 | 47 of 48 (98%) |
| Periods above €200 | 6 of 48 (12%) |
| Peak Avg (07–22) | €181.8/MWh |
| Off-peak Avg (22–07) | €160.87/MWh |
| Peak/Off-Peak Spread | €20.93/MWh |
| Wind % of Demand | 8.5% |
| Wind Range | 4.4%–15.7% |
| Mean Demand | 3940 MW |
Price Profile #
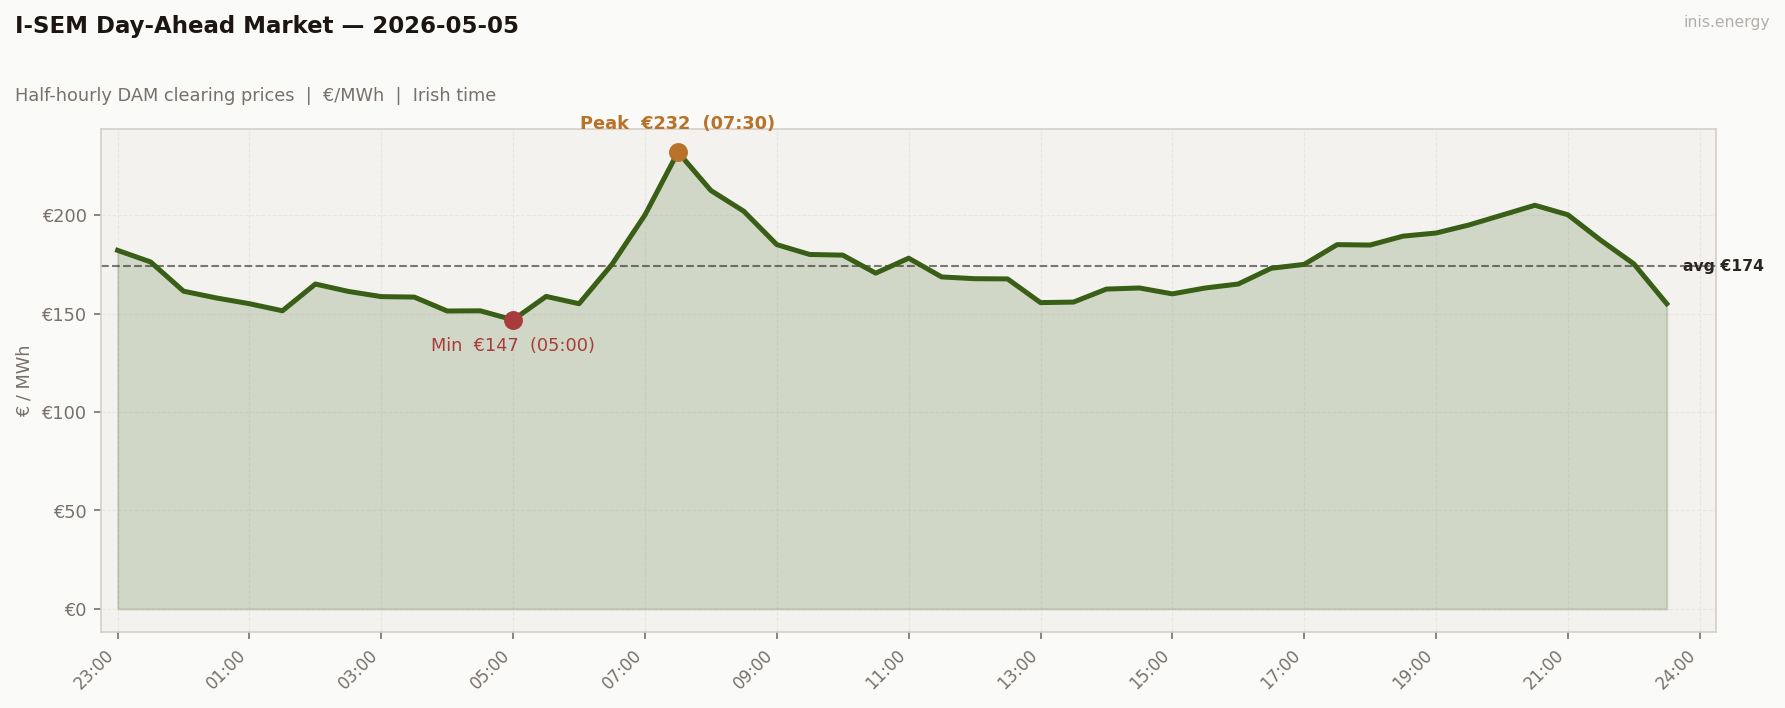
Std dev €18.72/MWh · Median €169.56/MWh · Periods above €150: 47 of 48 (98%)
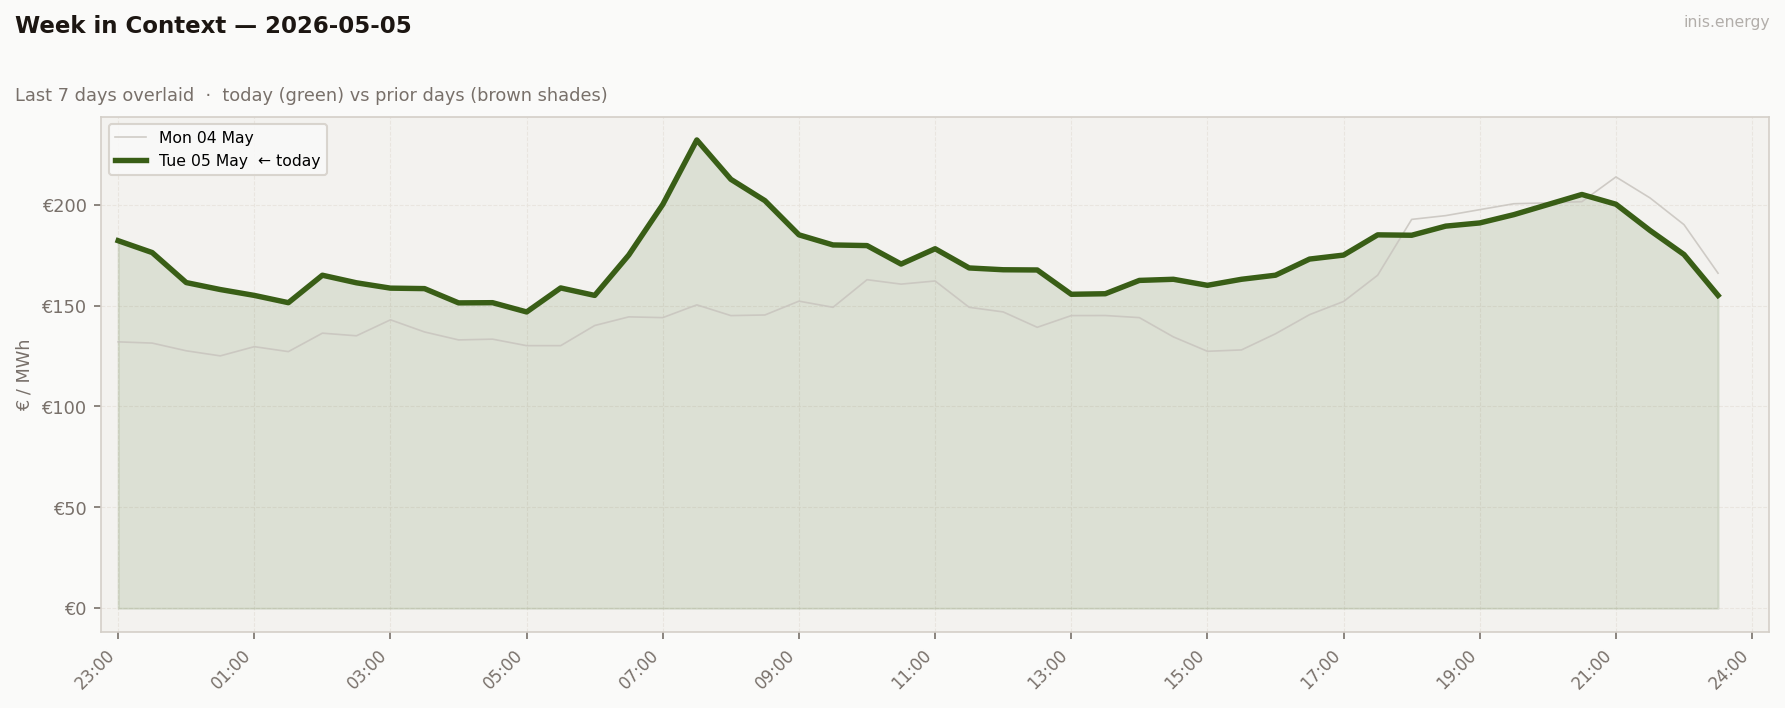
May 4th, Tuesday after the bank holiday. Yesterday we saw high, steady prices with a raised floor; poor for affordability and volatility. Today is actually worse. The floor lifted by €22, the mean lifted by €21, and wind somehow was lower.
Unlike yesterday, today’s profile has shape, and that shape starts with our morning thermal ramp: 05:00 (€146.81) → 07:30 (€232.00): +€85 in five half-hours. This ‘morning thermal ramp’ is the steep climb where gas plants ramp output (and more expensive units come online) to meet the early demand. Each plant that comes on sets a higher clearing price (the final market price after market clearing, all accepted generators are usually paid this price in a pay-as-clear market). Here, we can see prices climbed €85/MWh in 2.5 hours as wind fell from 7.9% to 4.7%, exactly as the morning demand was waking up.
Forming the end of our shape is the 2nd peak seen in the evening around 20:00-21:00 (€200-205). This is a classic working day shape, and worth nothing the higher morning peak. Indications of a tight morning supply margin.
The mid-section is flat and soft (€155-170 from 13:00-16:00), due to the slight creep up wind and the demand switching to off-peak. It’s the closest relief from the wind trough (low wind driving up prices), and even then, the floor is €155.
Price vs Wind #
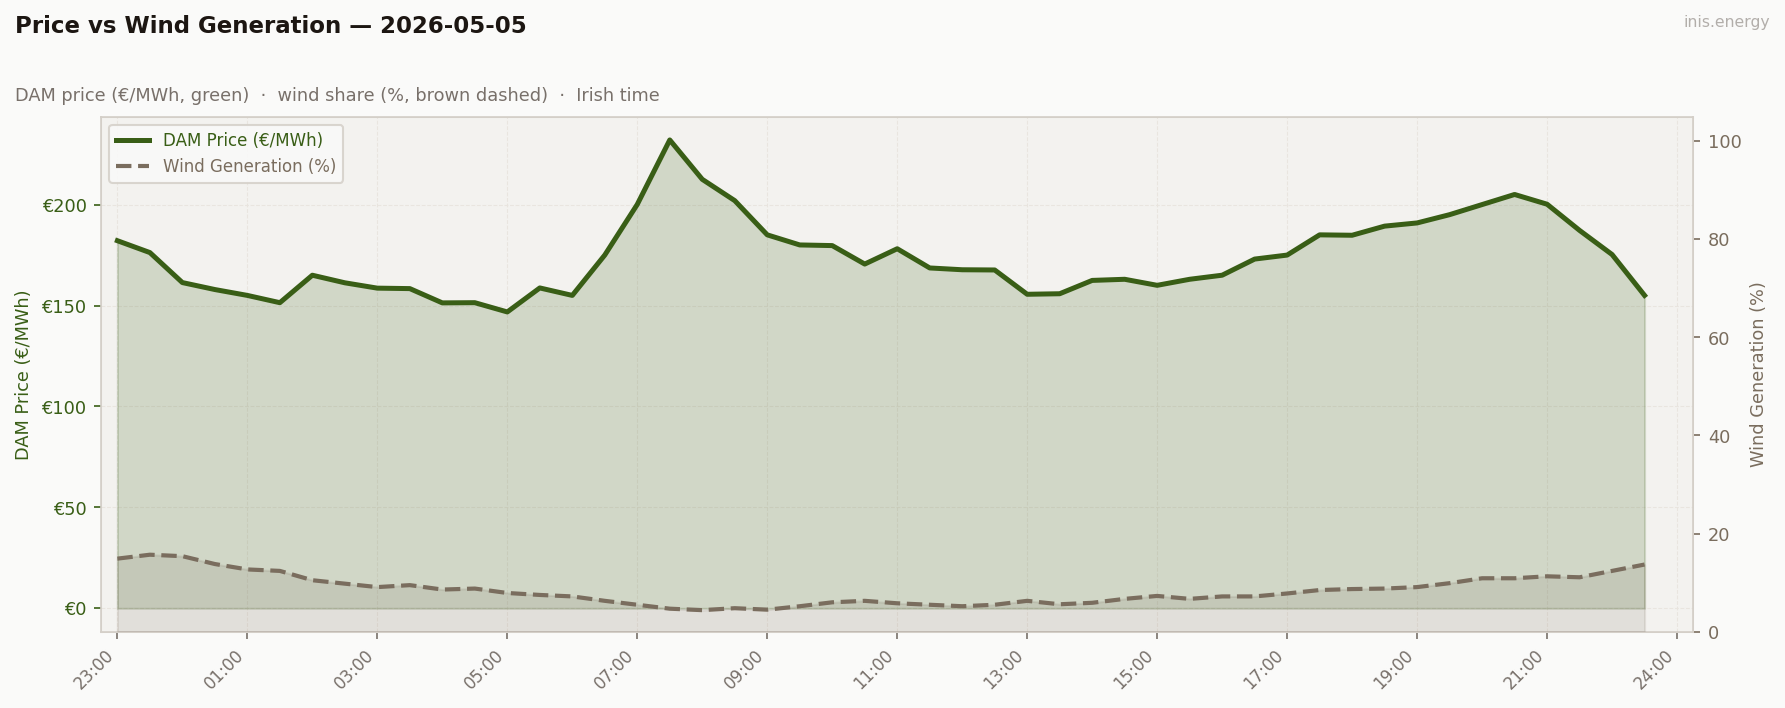
Mean wind: 8.5% · Range: 4.4%–15.7%
Wind was at it’s highest at 23:00-00:00 (14-15%), when demand was low (no value in it). Wind was at it’s lowest at 07:00-09:00 (4.4-5.5%), exactly when demand peaked. It then recovered late evening (12-14% by 22:00-22:30), just as demand was falling off. This is a nightmare situation for wind.
Wind Cannibalisation is the effect when high winds actually suppress the price that wind farms themselves get paid for. The more wind that comes in at near-zero, the further down the merit order the clearing price falls. What does this actually mean?
Well, Imagine the power market as a queue of generators lining up to sell their power, from cheapest to most expensive. This queue is the ‘merit order’. Each generator bids a price to sell electricity (wind, solar, gas, coal, etc). They’re ordered from lowest cost per MWh to highest cost per MWh. Demand will say ‘We need x amount of MW right now", so you start accepting the units on that queue, starting with the cheapest first, until demand is met. The price everyone gets paid is set by the last (most expensive) generator needed to meet that demand. That singular price is the ‘clearing price’.
So the more wind that comes in -> Lower clearing price -> each MWh of wind actually erns less money (since wind is paid the same clearing price as everyone else).
Today inverts that. Wind generated almost nothing during the cheap hours, and a bit more during the expensive hours. The Market/Mean Price, is the simple average price over all 24 hours (here about €173). The Capture Price, is the average price that wind actually got, weighted by its output each hour. So if wind mostly generates in high-price hours as it did today-> it’s capture price is above the mean.
Wind today was high in the wrong hours and low in the right ones. The result is the inverse of cannibalisation — wind’s capture price exceeds the daily mean. Renewables had a quietly profitable day; consumers paid for it.
Week in Context #
Price Duration Curve #
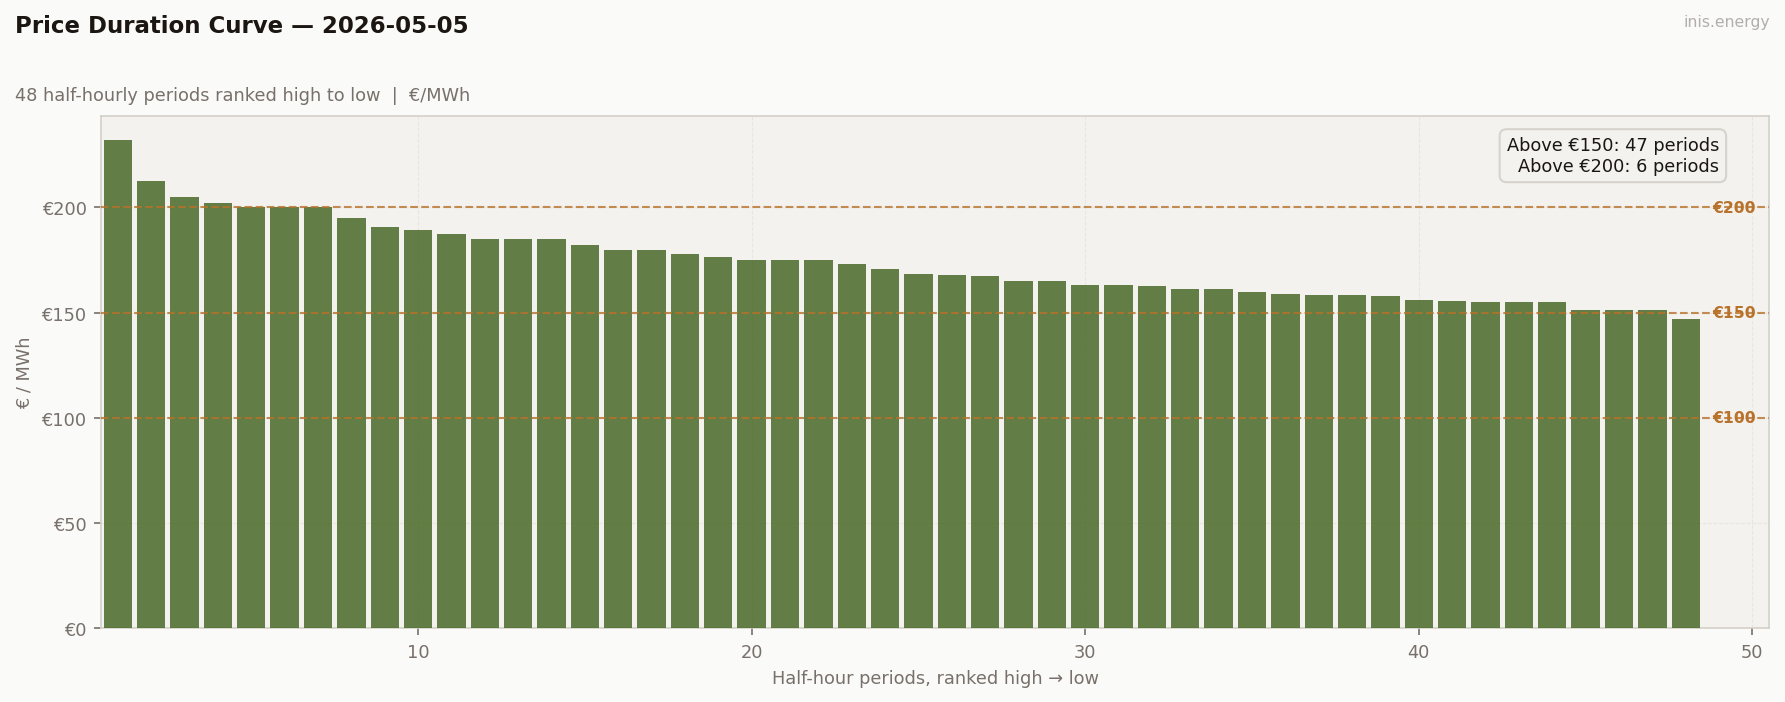
Today’s PDC scarcity hours tell the story of the day. 6 periods above €200, 40 more above €150, with a range of €85 (even lower than yesterday’s range of €88).
A high and flat day like today is thermally price-set all day. Few scarcity hours above €200, no cheap trough -> Bad for consumers and batteries; Quietly good for wind volume that did exist.
Only 1 of 48 periods cleared below €150
Periods above €150: 47 (98% of day) · Above €200: 6 (12% of day)
Peak / Off-Peak Spread #
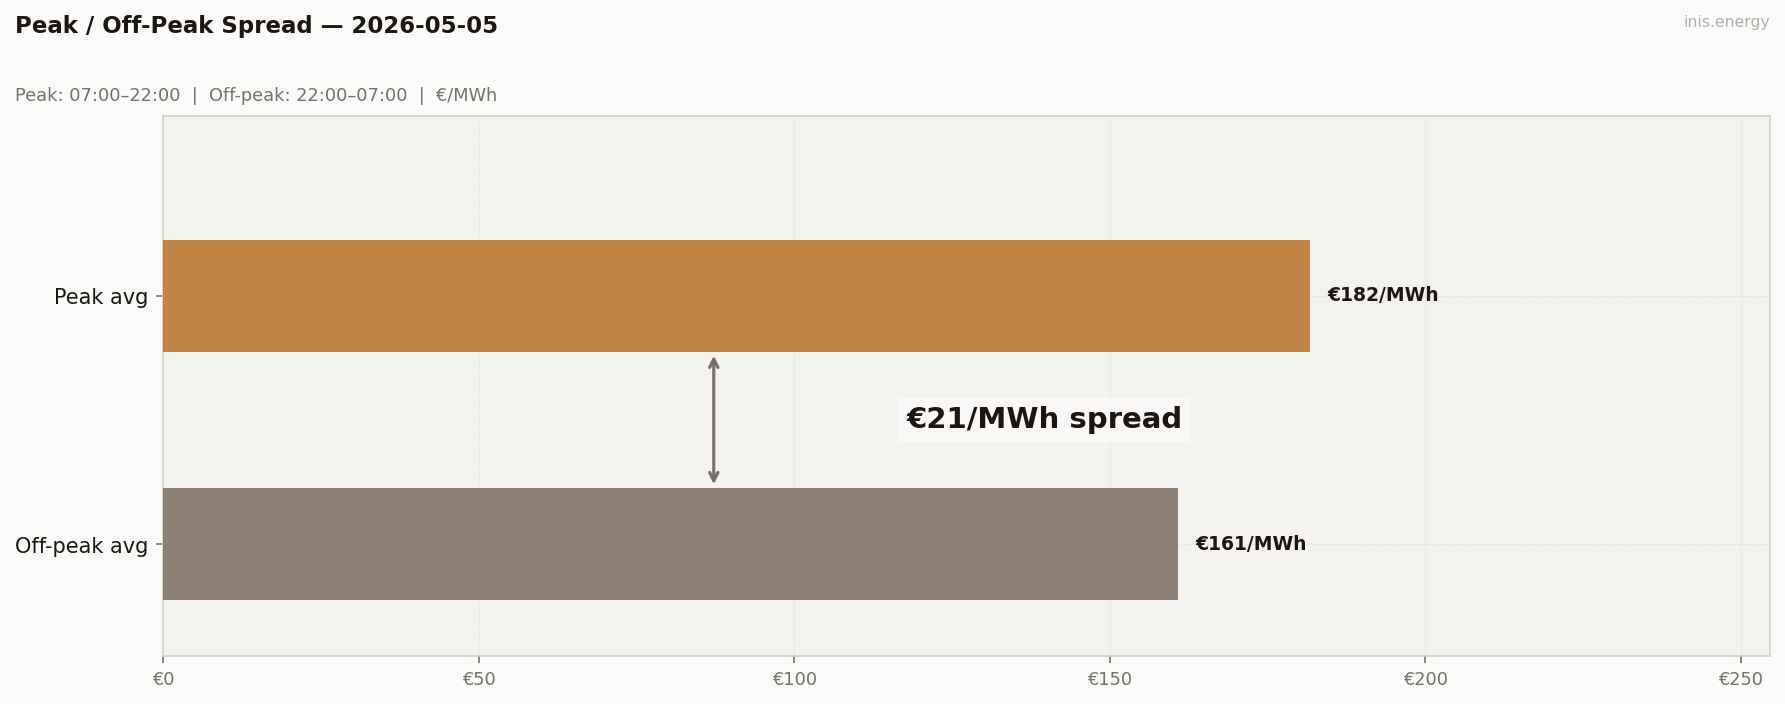
A good way to think of the peak-off-peak spread is ‘how much more expensive are the busy hours than the quiet hours’. Peak price: average price during high-demand hours. Off-peak price: average price during low-demand hours. Peak-off-peak spread: peak - off-peak price.
Here our spread is €20.93; Quite low. A ‘good’ spread on a working day can be €60-100+. Today’s is a quarter of that, why? Like yesterday, the high floor (€146 min) ate the spread from below. The peak period had genuine highs (€232) but they were brief, with the long off-peak hours staying expensive overnight.
A small spread like this provides less reward for flexibility or storage; arbitrage margins shrink. For consumers, time-of-use tariffs are less powerful as the price difference between peak/off-peak is reduced.
When calculating the spread, we take the average of the time windows, as batteries hold for windows; not single half-hours.
Today’s true arbitrage spread, meaning the number that you can actually profit from in intraday arbitrage, is €20.93. Our €85.19 figure is the headline, or the ‘show’ spread that people see, but after costs, fees, or reality checks, our real usable number is €20.93.
Peak avg (07:00–22:00): €181.8/MWh · Off-peak avg: €160.87/MWh · Spread: €20.93/MWh
BESS Dispatch Signal #
| Price | Time | Energy | Value | |
|---|---|---|---|---|
| Charge | €152/MWh | 03:30 | 2 MWh | −€304 |
| Discharge | €212/MWh | 07:00 | 1.7 MWh (85% RTE) | +€360 |
| Gross profit | €56 | |||
| Price spread | €60/MWh | ROI: 18.4% |
Simulated 1MW/2MWh battery, one optimal DAM cycle. Gross before network charges and capacity costs.
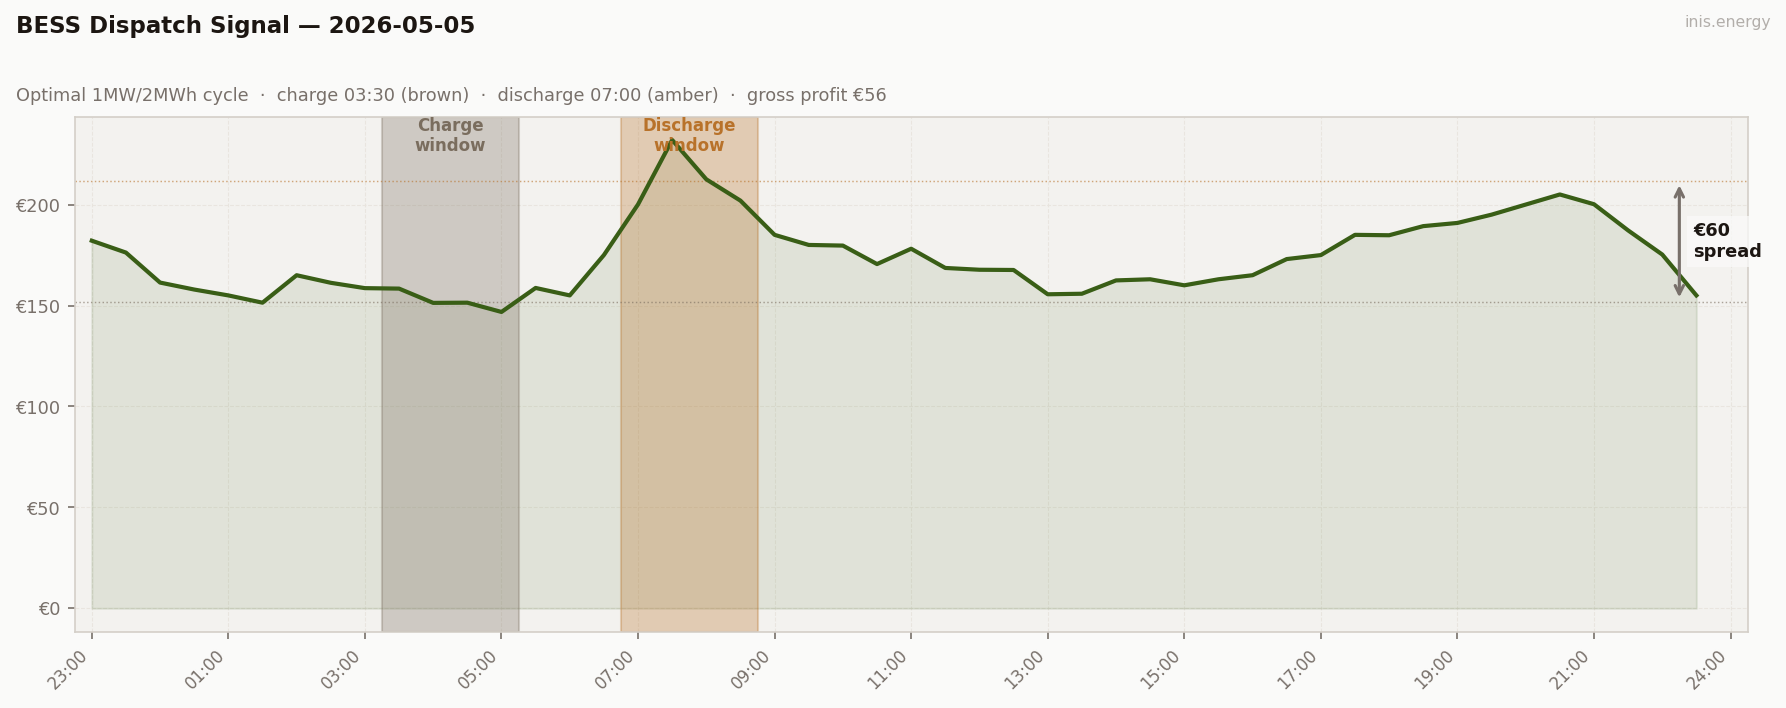
DThe Dispatch Optimisation model is straightforward: find the 4 cheapest consecutive half-hours to chage, the 4 dearest consecutive to discarge. Today the dispatch logic chose to discharge at 07:00, sittign on the front of the morning ramp rather than the evening, because the morning peak window is dearer on average. A natural assumption might be that batteries always live for the evening peak, however the optimal strategy on this day was to dump in the morning rather htna the evening.
The takeway is the same as yesterday’s: storage doesn’t reward high price levels, it rewards intraday volatility.
Another poor BESS day, the pattern won’t break until the wind returns.
Commentary #
A return to work Tuesday cost more than the bank holiday that preceded it. The mean lifted €21 to €173.95/MWh, the floor rose to €146.81, and the day’s signature morning ramp was restored.
Wind was the cause again, only the timing more punishing this time. The wind blew hardest when it wasn’t needed (15% overnight, 14% late evening) and bottomed at 4.4$ during the mornign ramp. At least for wind generators, wind’s capture price exceeded the daily mean - a rare day where the cannibalisation problem reversed.
For storage; more shape, less spread. A simulated 1MW/2MWh battery earned €56 gross. That’s €37 less than the bank holiday, despite the steeper price profile, because the peak/off-peak spread compressed to just €20.93.
Two low-wind days, two poor battery days. Give us a windy day next.
Half-hourly data — 2026-05-05
| Period | Time | Price (€/MWh) | Wind % |
|---|---|---|---|
| 1 | 23:00 | 182.10 | 14.9% |
| 2 | 23:30 | 176.22 | 15.7% |
| 3 | 00:00 | 161.36 | 15.4% |
| 4 | 00:30 | 157.91 | 13.8% |
| 5 | 01:00 | 155.00 | 12.7% |
| 6 | 01:30 | 151.40 | 12.4% |
| 7 | 02:00 | 165.00 | 10.5% |
| 8 | 02:30 | 161.25 | 9.8% |
| 9 | 03:00 | 158.60 | 9.1% |
| 10 | 03:30 | 158.37 | 9.5% |
| 11 | 04:00 | 151.30 | 8.6% |
| 12 | 04:30 | 151.40 | 8.8% |
| 13 | 05:00 | 146.81 | 7.9% |
| 14 | 05:30 | 158.70 | 7.5% |
| 15 | 06:00 | 155.00 | 7.2% |
| 16 | 06:30 | 175.00 | 6.3% |
| 17 | 07:00 | 200.08 | 5.5% |
| 18 | 07:30 | 232.00 | 4.7% |
| 19 | 08:00 | 212.50 | 4.4% |
| 20 | 08:30 | 201.94 | 4.8% |
| 21 | 09:00 | 185.00 | 4.5% |
| 22 | 09:30 | 180.00 | 5.2% |
| 23 | 10:00 | 179.68 | 6.0% |
| 24 | 10:30 | 170.53 | 6.3% |
| 25 | 11:00 | 178.12 | 5.8% |
| 26 | 11:30 | 168.60 | 5.5% |
| 27 | 12:00 | 167.71 | 5.2% |
| 28 | 12:30 | 167.60 | 5.5% |
| 29 | 13:00 | 155.56 | 6.3% |
| 30 | 13:30 | 155.83 | 5.6% |
| 31 | 14:00 | 162.43 | 5.9% |
| 32 | 14:30 | 162.99 | 6.7% |
| 33 | 15:00 | 160.00 | 7.3% |
| 34 | 15:30 | 162.99 | 6.7% |
| 35 | 16:00 | 165.01 | 7.2% |
| 36 | 16:30 | 173.00 | 7.2% |
| 37 | 17:00 | 174.98 | 7.8% |
| 38 | 17:30 | 185.00 | 8.5% |
| 39 | 18:00 | 184.80 | 8.7% |
| 40 | 18:30 | 189.32 | 8.8% |
| 41 | 19:00 | 190.90 | 9.1% |
| 42 | 19:30 | 195.00 | 9.9% |
| 43 | 20:00 | 200.00 | 10.9% |
| 44 | 20:30 | 205.00 | 10.9% |
| 45 | 21:00 | 200.17 | 11.3% |
| 46 | 21:30 | 187.20 | 11.1% |
| 47 | 22:00 | 175.25 | 12.4% |
| 48 | 22:30 | 155.00 | 13.7% |
Compare your business electricity and gas rates in minutes with INIS Energy Brokers.
Compare rates