I-SEM Daily Briefing — 19 June 2026
Table of Contents
Market Snapshot
| Metric | Value |
|---|---|
| Mean DAM Price | €158.27/MWh |
| Median Price | €167.18/MWh |
| Std Dev | €32.29/MWh |
| Peak Price | €206.1/MWh (11:00) |
| Min Price | €106.22/MWh (04:00) |
| Price Range | €99.88/MWh |
| Periods above €150 | 27 of 48 (56%) |
| Periods above €200 | 1 of 48 (2%) |
| Peak Avg (07–22) | €177.46/MWh |
| Off-peak Avg (22–07) | €126.29/MWh |
| Peak/Off-Peak Spread | €51.17/MWh |
| Wind % of Demand | 20.4% |
| Wind Range | 10.0%–50.7% |
| Mean Demand | 3913 MW |
Price Profile #
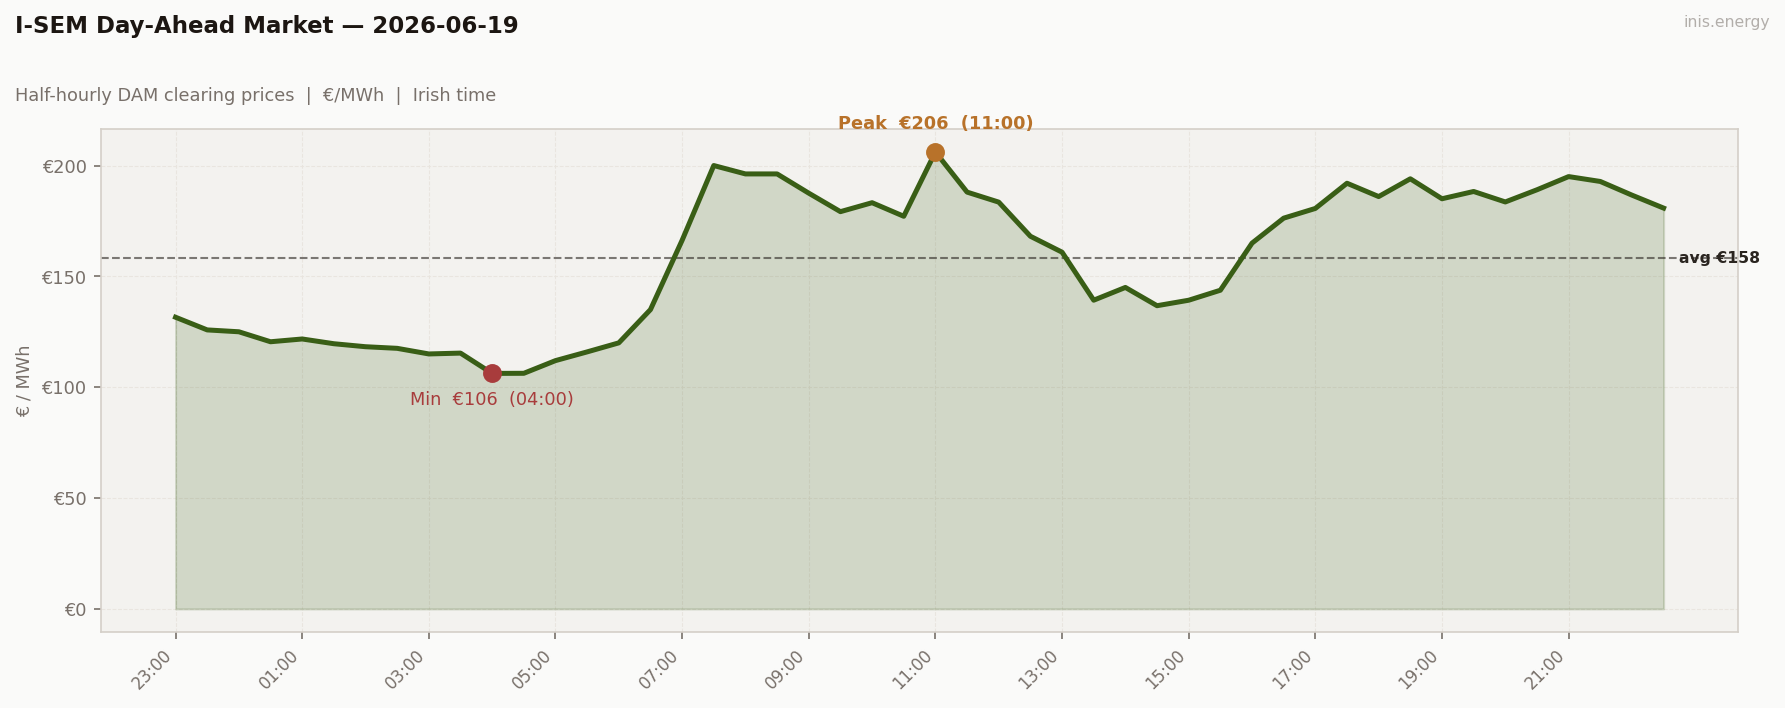
Std dev €32.29/MWh · Median €167.18/MWh · Periods above €150: 27 of 48 (56%)
The headline is range — €99.88, the biggest spread of the week. The median (€167.18) sitting above the mean (€158.27) tells you the distribution is skewed left; a deep cheap overnight dragging the average down. That overnight trough (€106.22 at 04:00) was wind-driven — 44% of demand covered at that moment. The rest of the day was expensive. High std dev of €32.29 reflects a day with genuine shape rather than the monotonous gas-set plateau.
Price vs Wind #
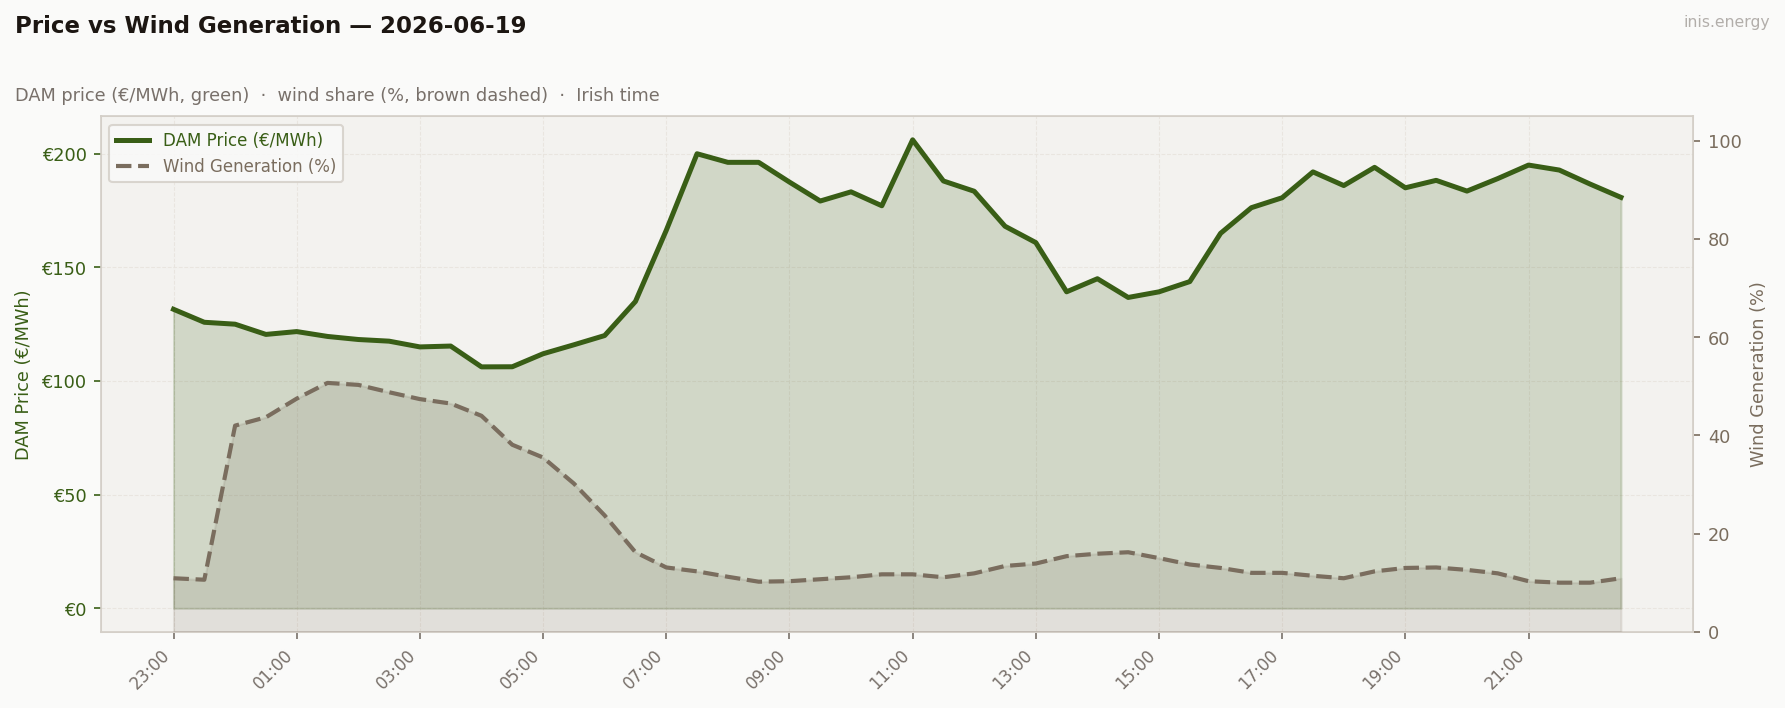
Mean wind: 20.4% · Range: 10.0%–50.7%
Wind peaked at 50.7% at 01:30 and held above 40% through to 04:00 — a genuine overnight wind event, and prices showed it (€106-121 floor). Then it fell apart fast: 35% at 05:00 → 12.3% by 07:30, a two-hour collapse that pushed prices from €111 to €199.98. Wind never returned above 16% for the rest of the day. The inverse is textbook — where wind went, price followed in mirror image.
Week in Context #
Price Duration Curve #
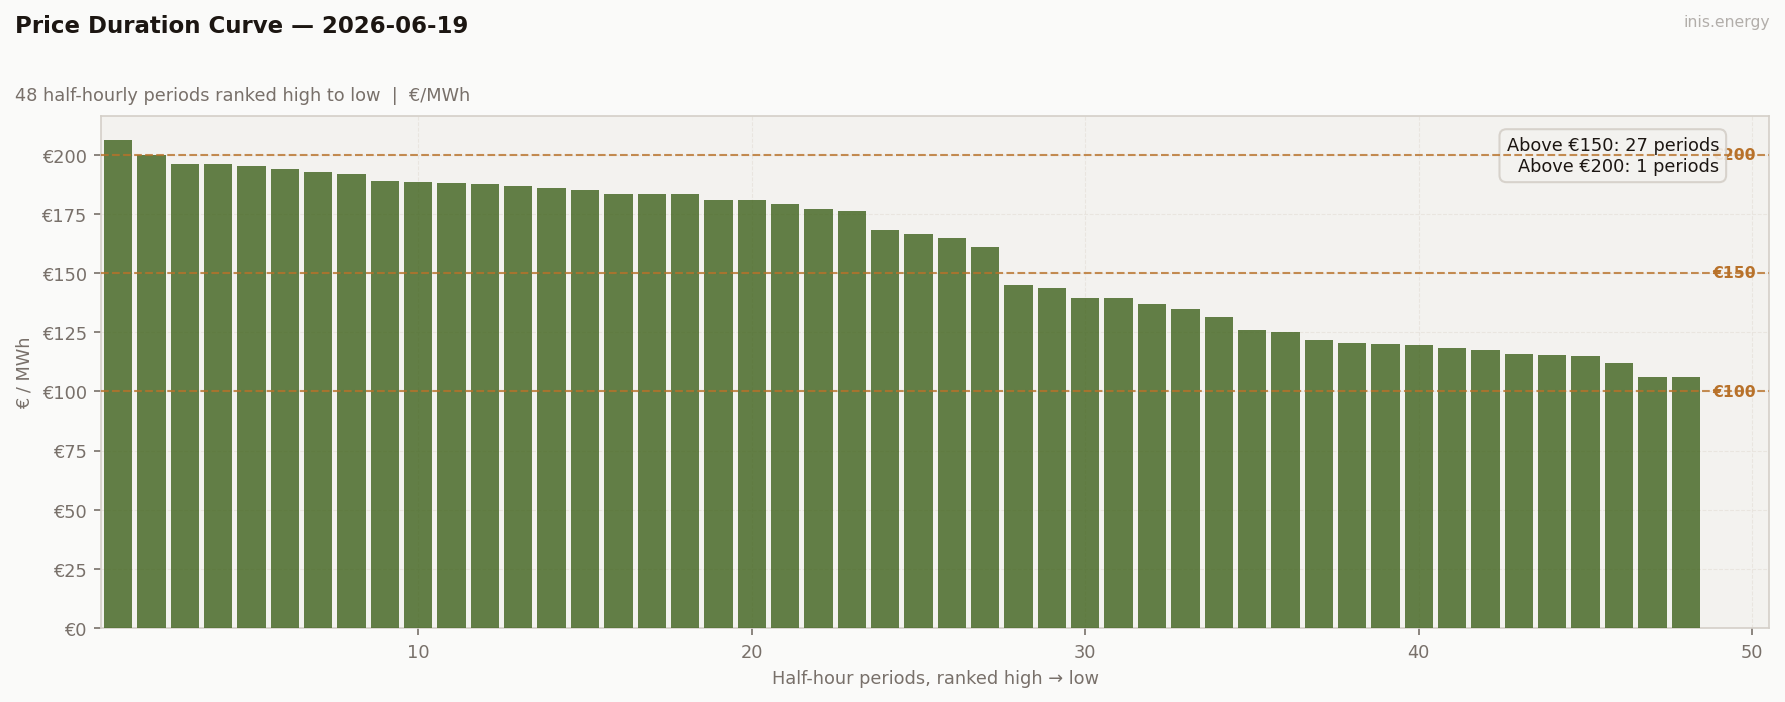
Periods above €150: 27 (56% of day) · Above €200: 1 (2% of day)
Only 1 period above €200, but 27 of 48 above €150. The shape of the curve is a two-population day — a cluster of cheap overnight periods pulled by the wind event (roughly €106-125), and the rest of the day firmly expensive (€160-206). The curve isn’t smooth; there’s a visible step change between those two regimes.
Peak / Off-Peak Spread #
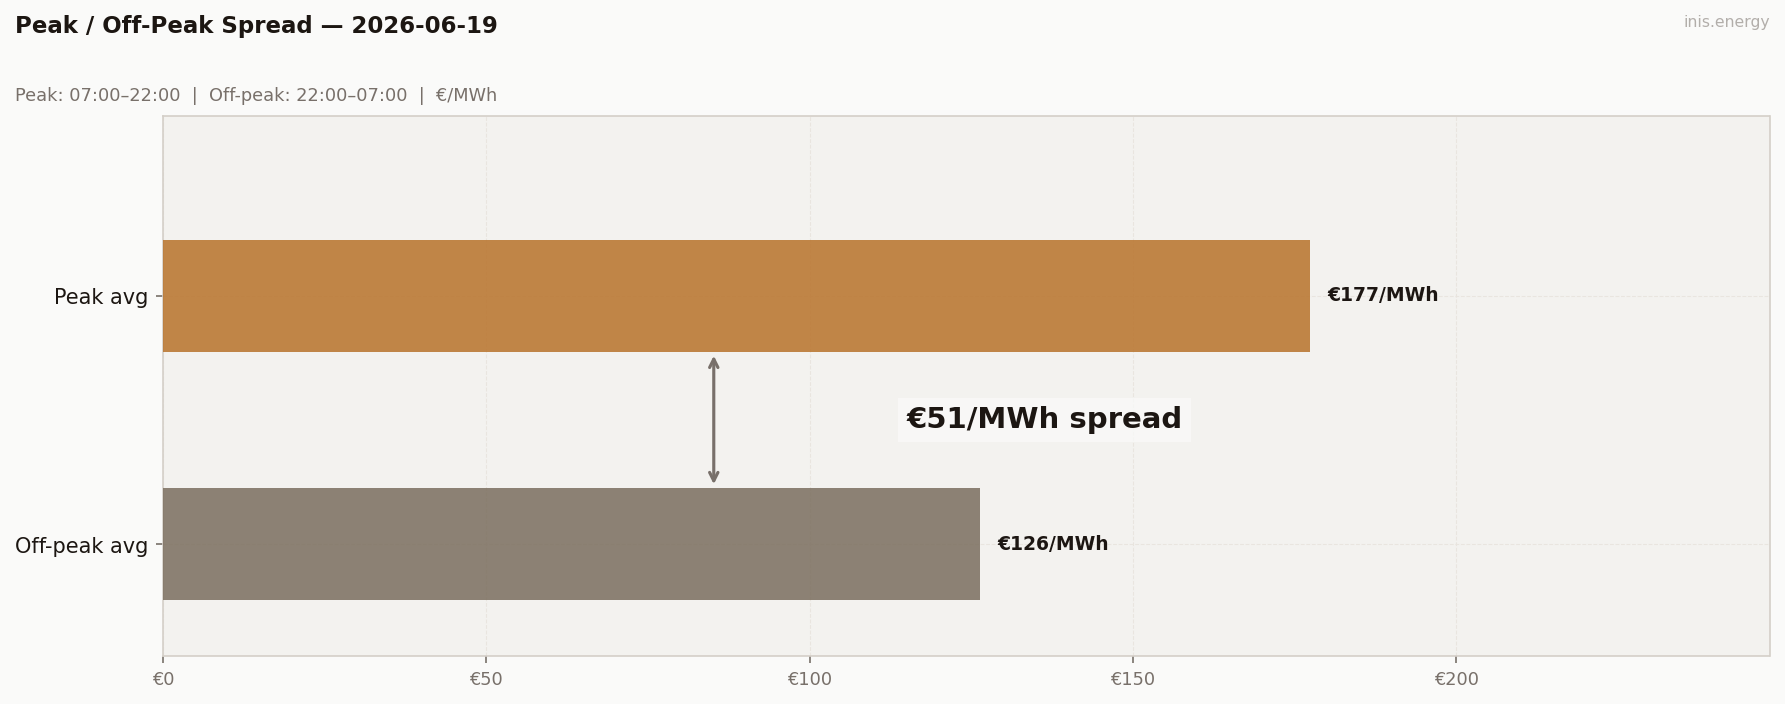
Peak avg (07:00–22:00): €177.46/MWh · Off-peak avg: €126.29/MWh · Spread: €51.17/MWh
A €51.17 peak/off-peak spread is healthy — back to a normal daytime-premium structure. The off-peak average (€126.29) was depressed by the overnight wind glut, and the peak average (€177.46) reflects the gas-set afternoon. That overnight trough was a genuine cheap charge window; the spread says storage had something to work with today.
BESS Dispatch Signal #
| Price | Time | Energy | Value | |
|---|---|---|---|---|
| Charge | €110/MWh | 03:30 | 2 MWh | −€220 |
| Discharge | €195/MWh | 07:30 | 1.7 MWh (85% RTE) | +€331 |
| Gross profit | €112 | |||
| Price spread | €85/MWh | ROI: 50.7% |
Simulated 1MW/2MWh battery, one optimal DAM cycle. Gross before network charges and capacity costs.
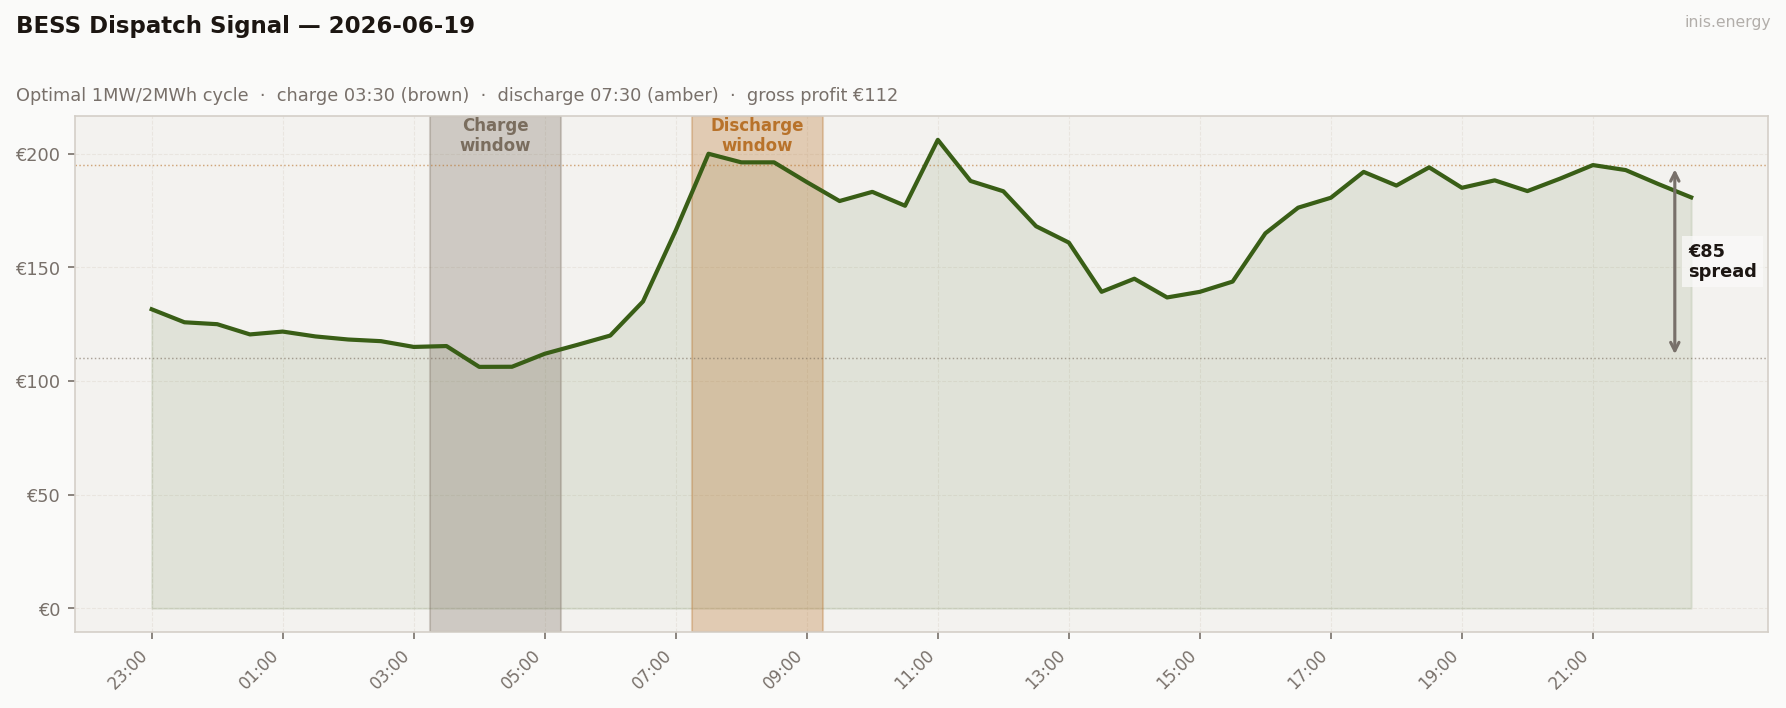
The battery played this perfectly. Charged at €110 at 03:30 — right in the heart of the overnight wind glut, wind at 46.5% — and discharged at €195 at 07:30, catching the morning ramp just as wind collapsed through 12%. €112 gross. The spread came from wind timing: overnight charge into a wind surplus, morning discharge into a gas-ramp spike. This is the textbook BESS play. Best gross of the week so far.
Commentary #
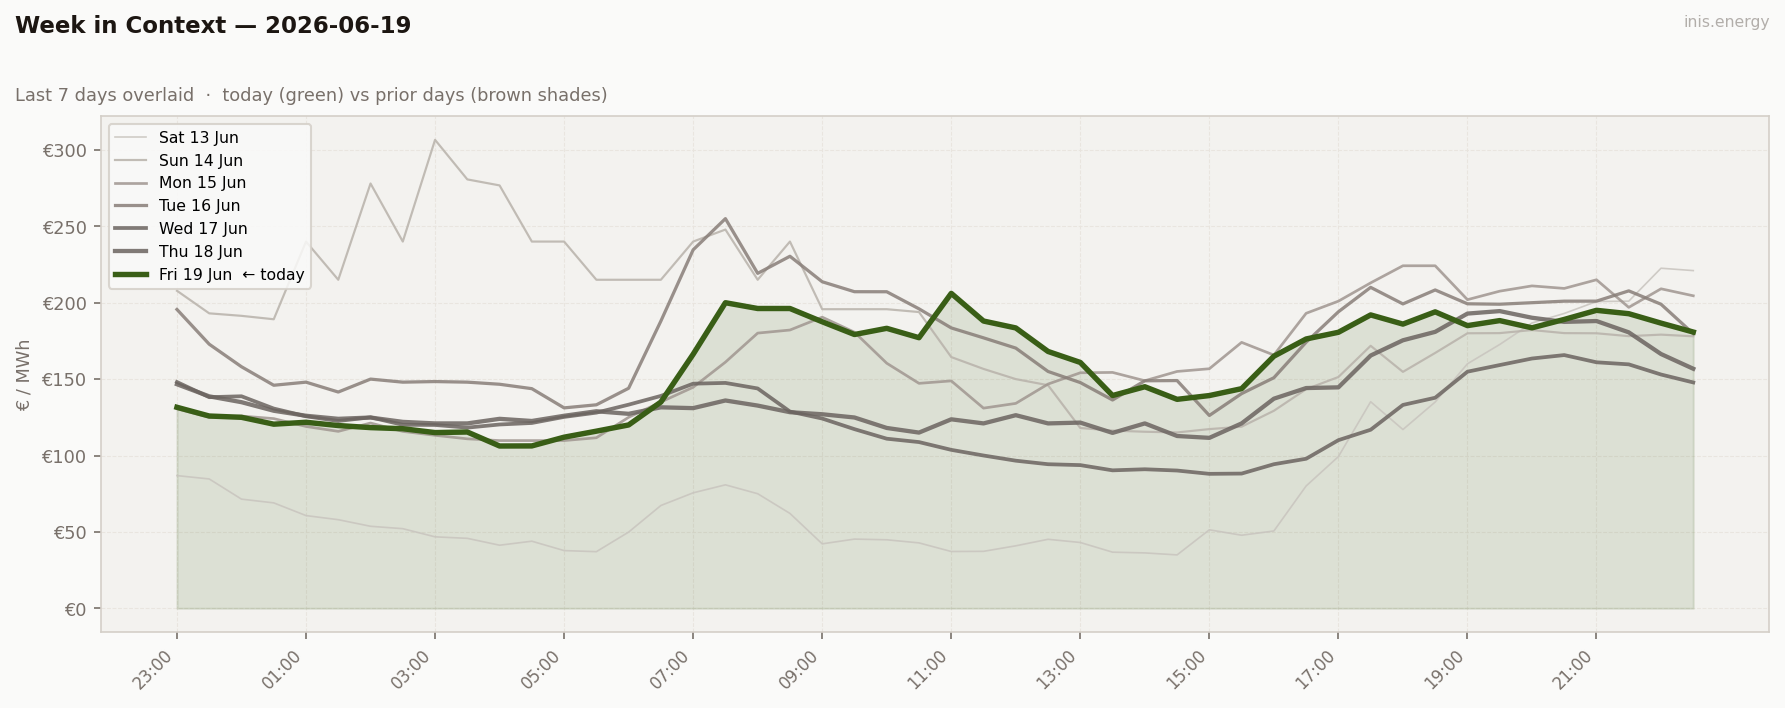
Wild swing of a day — the biggest range yet at €99.88, mean of €158.27. The story is wind crashing right when it mattered.
Overnight wind was a glut, peaking at 50.7% around 01:00, and the floor sank to €106.22 by 04:00. Then it fell apart — 35% at 05:00 down to 13% by 07:00 — gone in two hours, right as the morning ramp usually kicks in. Prices went from €106 to €199.98 in three hours flat. Wind never recovered past 16% for the rest of the day, which is why the high carried through to an oddly-timed peak of €206.10 at 11:00 rather than the usual evening spike.
A brief afternoon dip as wind ticked back up to 13-16% gave some relief before the evening climbed back to €180-195 on the same low wind. Good day for storage though — charge at €110 into the overnight glut, discharge at €195 right on the morning ramp, €112 gross. Exactly the kind of whipsaw that pays.
Half-hourly data — 2026-06-19
| Period | Time | Price (€/MWh) | Wind % |
|---|---|---|---|
| 1 | 23:00 | 131.56 | 10.9% |
| 2 | 23:30 | 125.84 | 10.6% |
| 3 | 00:00 | 125.00 | 42.0% |
| 4 | 00:30 | 120.50 | 43.7% |
| 5 | 01:00 | 121.75 | 47.5% |
| 6 | 01:30 | 119.61 | 50.7% |
| 7 | 02:00 | 118.26 | 50.3% |
| 8 | 02:30 | 117.53 | 48.8% |
| 9 | 03:00 | 115.00 | 47.4% |
| 10 | 03:30 | 115.38 | 46.5% |
| 11 | 04:00 | 106.22 | 44.0% |
| 12 | 04:30 | 106.27 | 38.1% |
| 13 | 05:00 | 111.99 | 35.5% |
| 14 | 05:30 | 115.93 | 30.2% |
| 15 | 06:00 | 120.00 | 23.7% |
| 16 | 06:30 | 135.00 | 16.2% |
| 17 | 07:00 | 166.27 | 13.1% |
| 18 | 07:30 | 199.98 | 12.3% |
| 19 | 08:00 | 196.20 | 11.2% |
| 20 | 08:30 | 196.20 | 10.2% |
| 21 | 09:00 | 187.52 | 10.3% |
| 22 | 09:30 | 179.18 | 10.7% |
| 23 | 10:00 | 183.22 | 11.1% |
| 24 | 10:30 | 177.10 | 11.7% |
| 25 | 11:00 | 206.10 | 11.7% |
| 26 | 11:30 | 188.00 | 11.1% |
| 27 | 12:00 | 183.48 | 11.9% |
| 28 | 12:30 | 168.09 | 13.4% |
| 29 | 13:00 | 160.90 | 13.9% |
| 30 | 13:30 | 139.25 | 15.4% |
| 31 | 14:00 | 145.00 | 15.9% |
| 32 | 14:30 | 136.76 | 16.2% |
| 33 | 15:00 | 139.23 | 15.0% |
| 34 | 15:30 | 143.74 | 13.7% |
| 35 | 16:00 | 164.98 | 13.0% |
| 36 | 16:30 | 176.25 | 12.0% |
| 37 | 17:00 | 180.63 | 12.0% |
| 38 | 17:30 | 192.00 | 11.4% |
| 39 | 18:00 | 185.99 | 10.9% |
| 40 | 18:30 | 194.00 | 12.3% |
| 41 | 19:00 | 185.00 | 13.0% |
| 42 | 19:30 | 188.28 | 13.1% |
| 43 | 20:00 | 183.56 | 12.6% |
| 44 | 20:30 | 189.05 | 11.9% |
| 45 | 21:00 | 195.00 | 10.3% |
| 46 | 21:30 | 192.80 | 10.0% |
| 47 | 22:00 | 186.63 | 10.0% |
| 48 | 22:30 | 180.79 | 10.9% |
Compare your business electricity and gas rates in minutes with INIS Energy Brokers.
Compare rates