I-SEM Daily Briefing — 20 June 2026
Table of Contents
Market Snapshot
| Metric | Value |
|---|---|
| Mean DAM Price | €125.13/MWh |
| Median Price | €115.83/MWh |
| Std Dev | €27.97/MWh |
| Peak Price | €181.22/MWh (23:00) |
| Min Price | €94.6/MWh (14:00) |
| Price Range | €86.62/MWh |
| Periods above €150 | 11 of 48 (23%) |
| Periods above €200 | 0 of 48 (0%) |
| Peak Avg (07–22) | €120.03/MWh |
| Off-peak Avg (22–07) | €133.64/MWh |
| Peak/Off-Peak Spread | €-13.61/MWh |
| Wind % of Demand | 6.6% |
| Wind Range | 2.9%–12.1% |
| Mean Demand | 3474 MW |
Price Profile #
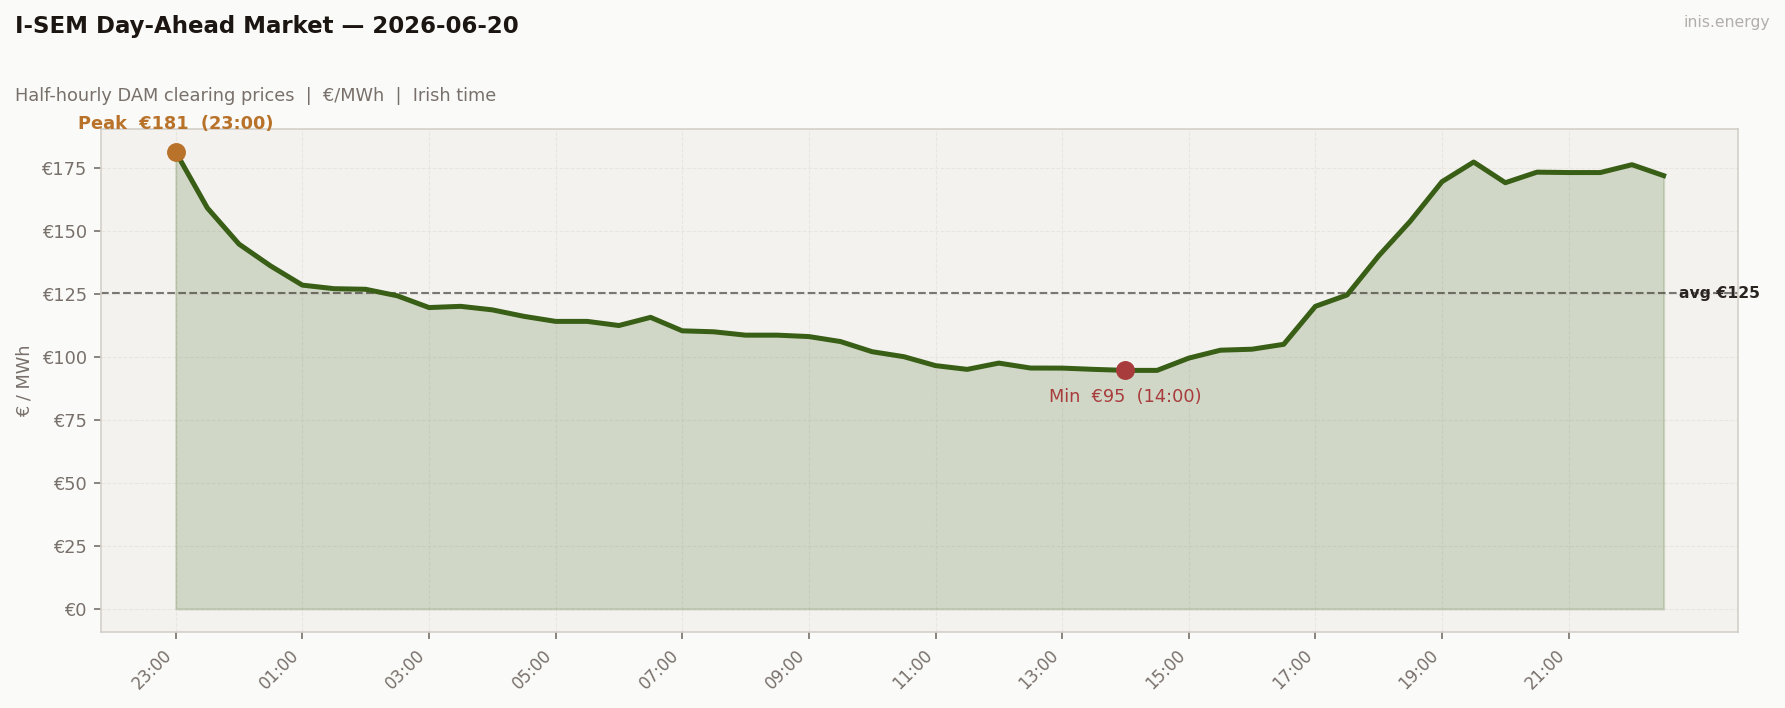
Std dev €27.97/MWh · Median €115.83/MWh · Periods above €150: 11 of 48 (23%)
Saturday, and demand dropped accordingly — 3,474 MW mean, the lightest day of the week. Despite wind sitting at a low 6.6%, prices were actually the cheapest of the week. The profile looks almost inverted from a normal weekday: the overnight was expensive (€121-145), the daytime was soft (€94-115 from 07:00-16:00), and the evening ramp climbed from €94.60 at 14:00 to €181.22 by 23:00. Low demand meant the merit order cleared lower all through daylight; Saturday load simply doesn’t need the same thermal capacity.
Price vs Wind #
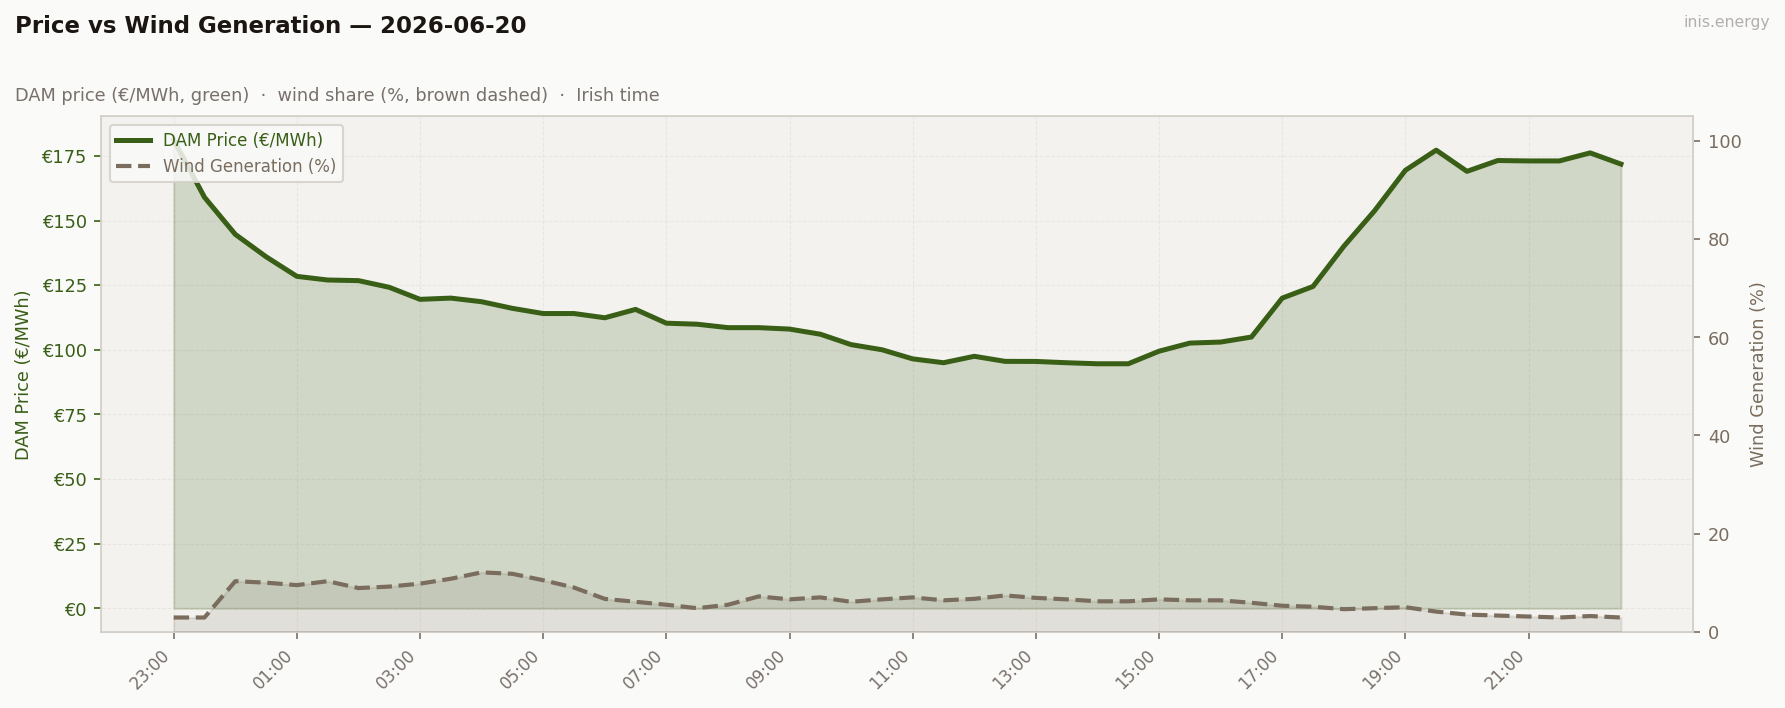
Mean wind: 6.6% · Range: 2.9%–12.1%
Wind was low and flat all day, barely moving the needle. There’s no single wind event driving the price shape here — the profile follows demand, not renewables. The morning softness and afternoon trough (€94-102 from 10:00-16:00) coincide with the lightest demand window of the day. Wind at 6% can’t push prices down; it can only fail to push them up. Today, demand did the steering.
Week in Context #
Price Duration Curve #
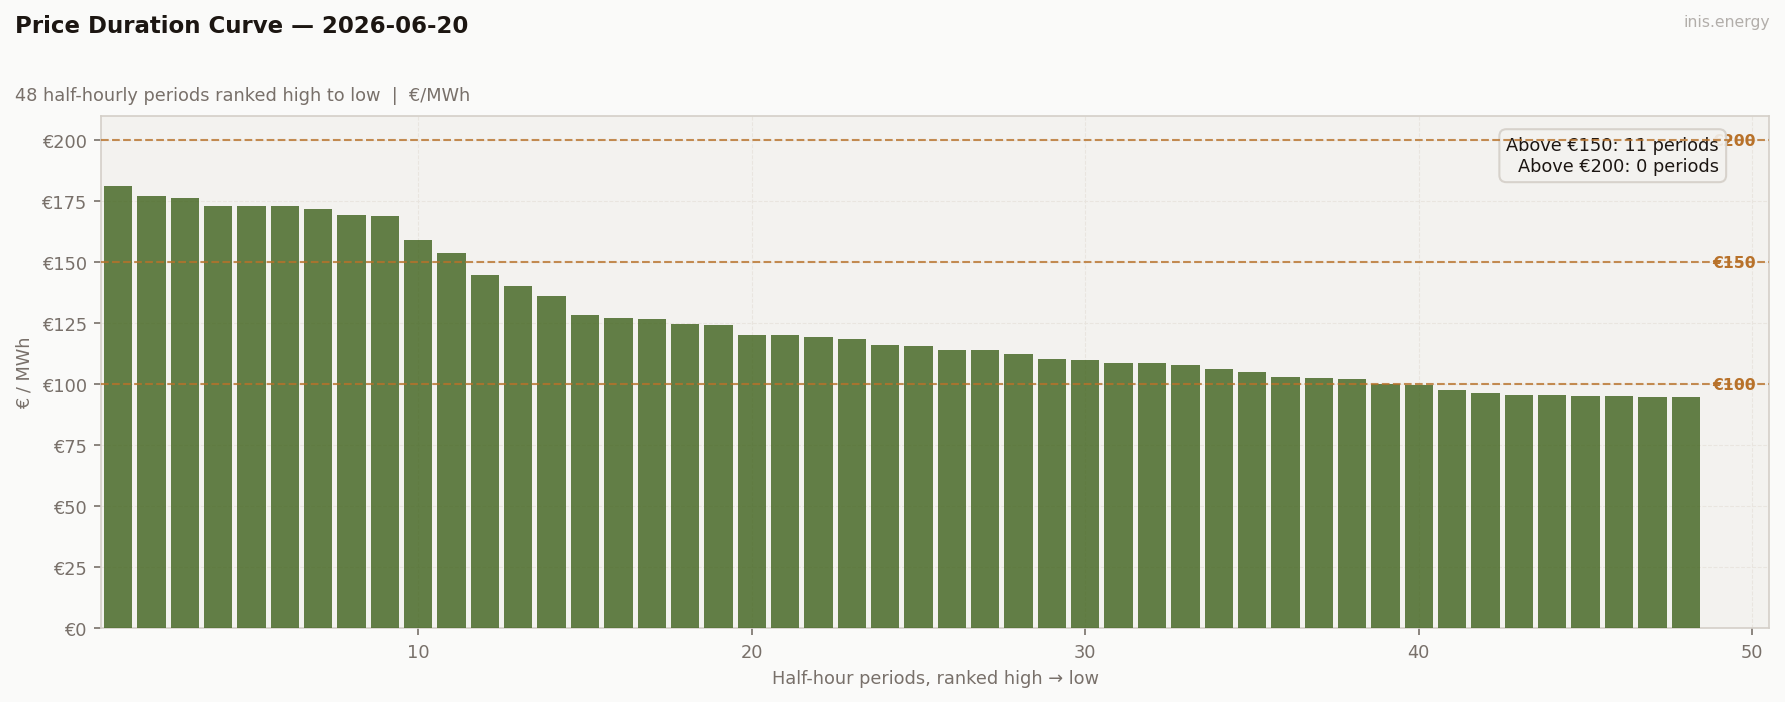
Periods above €150: 11 (23% of day) · Above €200: 0 (0% of day)
Only 11 periods above €150, none above €200 — comparatively cheap. The curve is spread out with no scarcity cluster at the top, and the cheapest periods dipping into the mid-€90s. A soft, low-demand Saturday with no volatility extremes. Quiet, not eventful.
Peak / Off-Peak Spread #
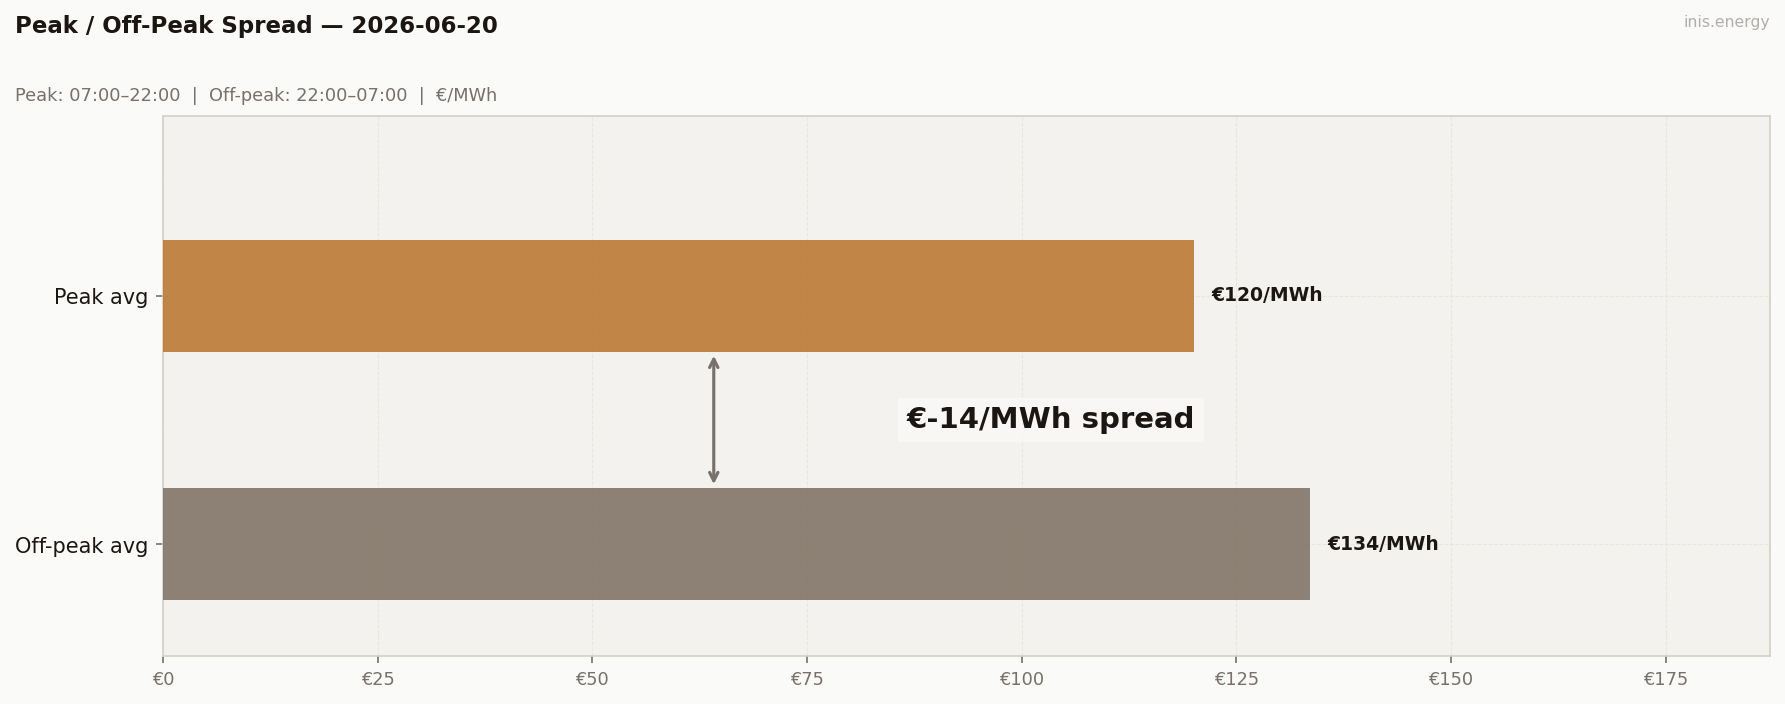
Peak avg (07:00–22:00): €120.03/MWh · Off-peak avg: €133.64/MWh · Spread: €-13.61/MWh
Negative spread of €-13.61 sounds alarming but is a weekend artefact. Off-peak includes the 23:00 spike (€181.22), which drags the overnight average above the daytime. The real story is the afternoon trough (€94.60 at 14:00) and the evening ramp — the intraday swing matters more than the peak/off-peak label here. Rigid time-of-use thinking misleads you on a Saturday.
BESS Dispatch Signal #
| Price | Time | Energy | Value | |
|---|---|---|---|---|
| Charge | €95/MWh | 13:00 | 2 MWh | −€190 |
| Discharge | €174/MWh | 20:30 | 1.7 MWh (85% RTE) | +€296 |
| Gross profit | €106 | |||
| Price spread | €79/MWh | ROI: 55.7% |
Simulated 1MW/2MWh battery, one optimal DAM cycle. Gross before network charges and capacity costs.
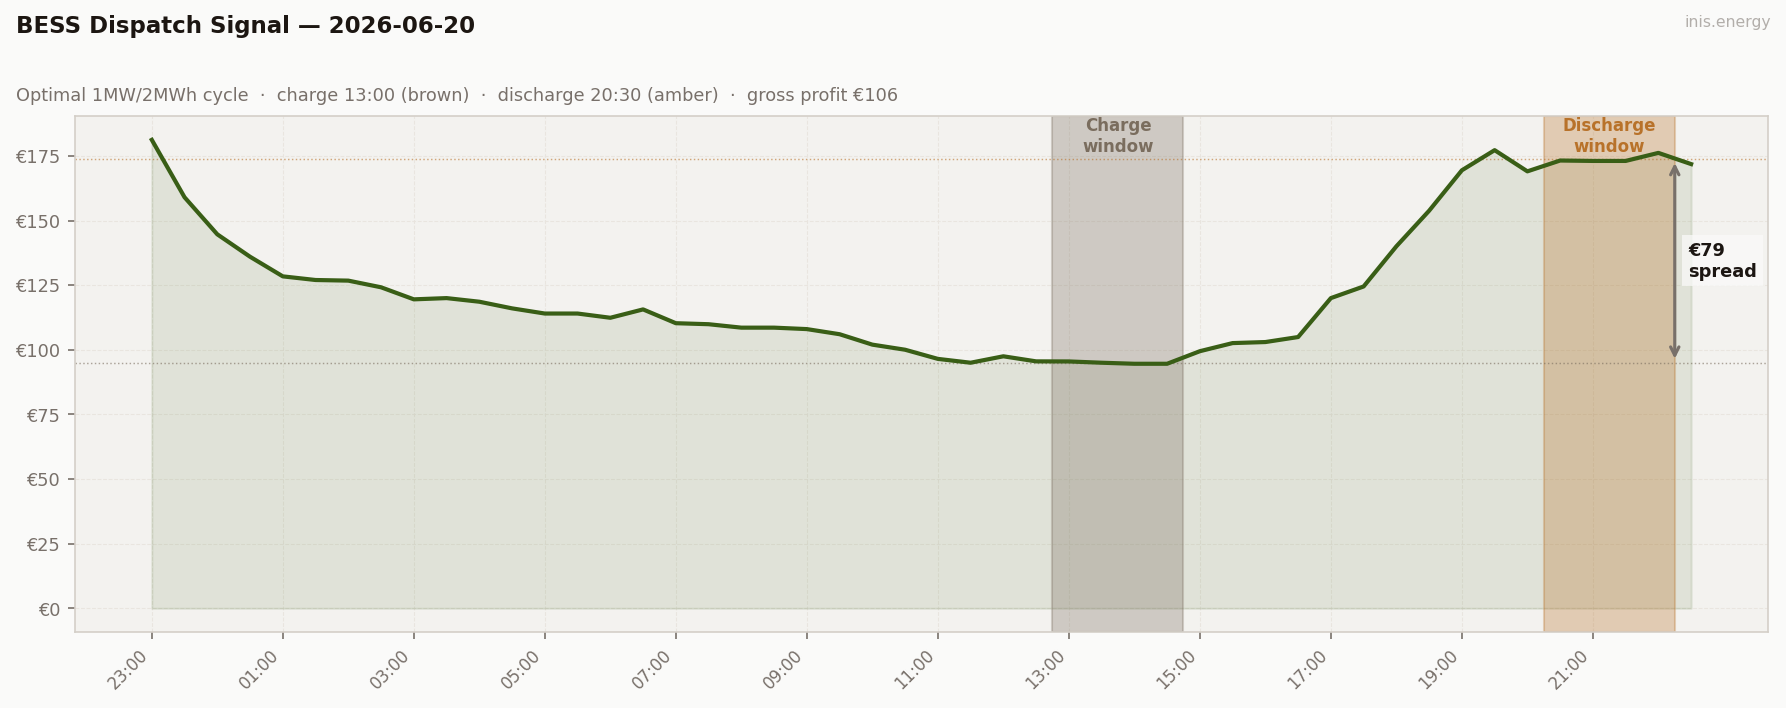
Charge at €95 at 13:00 in the Saturday afternoon trough, discharge at €174 at 20:30 in the evening ramp. €106 gross, ROI 55.7%. Not a wind story — a demand story. The Saturday load profile created a genuinely cheap afternoon window (€94.60 at 14:00) and a predictable evening ramp. The battery didn’t need wind to find its spread; it just needed Saturday afternoon.
Commentary #
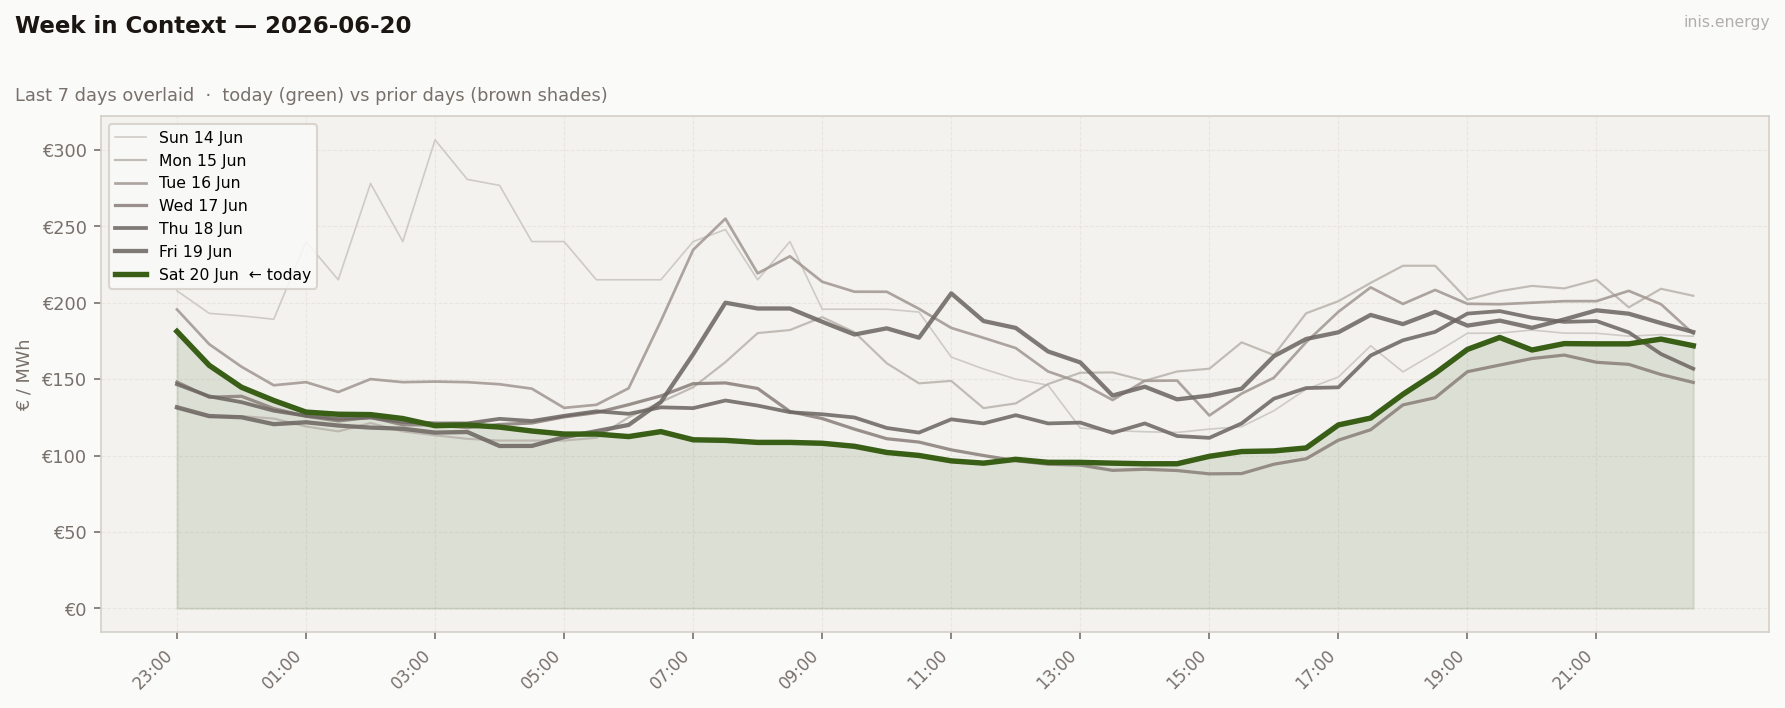
Saturday demand erased the low-wind penalty. Mean of €125.13/MWh — cheapest day of the week — despite wind averaging just 6.6%, nearly as low as Monday. The difference: 3,474 MW of mean demand versus a weekday’s 3,800+. With fewer industrial and commercial consumers calling on gas capacity, the merit order cleared lower all through the middle of the day.
The price shape is the real oddity. The overnight (22:00-07:00) was actually dearer than the daytime peak window, flipping the usual premium structure into a negative spread of €-13.61. The €181.22 spike at 23:00 — the tail of Friday evening’s low wind — plus persistent overnight prices in the €120-145 range hauled the off-peak average to €133.64. Daytime, meanwhile, bottomed at €94.60 by 14:00.
Storage had a clean day — charge in the afternoon trough, discharge into the evening ramp, €106 gross. Not glamorous, but consistent. Wind staying flat at 6% all day just meant demand shape drove everything. Two straight days of cheap afternoons — give us one of those on a weekday.
Half-hourly data — 2026-06-20
| Period | Time | Price (€/MWh) | Wind % |
|---|---|---|---|
| 1 | 23:00 | 181.22 | 2.9% |
| 2 | 23:30 | 159.00 | 2.9% |
| 3 | 00:00 | 144.67 | 10.3% |
| 4 | 00:30 | 136.00 | 10.0% |
| 5 | 01:00 | 128.41 | 9.5% |
| 6 | 01:30 | 127.00 | 10.3% |
| 7 | 02:00 | 126.76 | 8.9% |
| 8 | 02:30 | 124.18 | 9.2% |
| 9 | 03:00 | 119.52 | 9.8% |
| 10 | 03:30 | 120.00 | 10.8% |
| 11 | 04:00 | 118.60 | 12.1% |
| 12 | 04:30 | 116.03 | 11.8% |
| 13 | 05:00 | 114.03 | 10.5% |
| 14 | 05:30 | 114.03 | 9.0% |
| 15 | 06:00 | 112.39 | 6.7% |
| 16 | 06:30 | 115.63 | 6.1% |
| 17 | 07:00 | 110.29 | 5.5% |
| 18 | 07:30 | 109.90 | 4.8% |
| 19 | 08:00 | 108.57 | 5.5% |
| 20 | 08:30 | 108.57 | 7.2% |
| 21 | 09:00 | 108.01 | 6.6% |
| 22 | 09:30 | 106.03 | 7.0% |
| 23 | 10:00 | 102.00 | 6.1% |
| 24 | 10:30 | 100.03 | 6.6% |
| 25 | 11:00 | 96.49 | 7.0% |
| 26 | 11:30 | 95.00 | 6.4% |
| 27 | 12:00 | 97.49 | 6.7% |
| 28 | 12:30 | 95.53 | 7.4% |
| 29 | 13:00 | 95.50 | 6.9% |
| 30 | 13:30 | 95.00 | 6.6% |
| 31 | 14:00 | 94.60 | 6.2% |
| 32 | 14:30 | 94.60 | 6.2% |
| 33 | 15:00 | 99.46 | 6.6% |
| 34 | 15:30 | 102.60 | 6.4% |
| 35 | 16:00 | 103.00 | 6.4% |
| 36 | 16:30 | 104.94 | 5.9% |
| 37 | 17:00 | 120.00 | 5.3% |
| 38 | 17:30 | 124.50 | 5.1% |
| 39 | 18:00 | 140.03 | 4.6% |
| 40 | 18:30 | 153.80 | 4.8% |
| 41 | 19:00 | 169.44 | 5.0% |
| 42 | 19:30 | 177.23 | 4.1% |
| 43 | 20:00 | 169.03 | 3.5% |
| 44 | 20:30 | 173.22 | 3.3% |
| 45 | 21:00 | 173.06 | 3.1% |
| 46 | 21:30 | 173.06 | 2.9% |
| 47 | 22:00 | 176.17 | 3.2% |
| 48 | 22:30 | 171.84 | 2.9% |
Compare your business electricity and gas rates in minutes with INIS Energy Brokers.
Compare rates