I-SEM Daily Briefing — 21 June 2026
Table of Contents
Market Snapshot
| Metric | Value |
|---|---|
| Mean DAM Price | €134.59/MWh |
| Median Price | €125.06/MWh |
| Std Dev | €27.89/MWh |
| Peak Price | €196.2/MWh (23:00) |
| Min Price | €106.06/MWh (10:30) |
| Price Range | €90.14/MWh |
| Periods above €150 | 15 of 48 (31%) |
| Periods above €200 | 0 of 48 (0%) |
| Peak Avg (07–22) | €127.55/MWh |
| Off-peak Avg (22–07) | €146.33/MWh |
| Peak/Off-Peak Spread | €-18.78/MWh |
| Wind % of Demand | 6.0% |
| Wind Range | 2.4%–11.2% |
| Mean Demand | 3316 MW |
Price Profile #
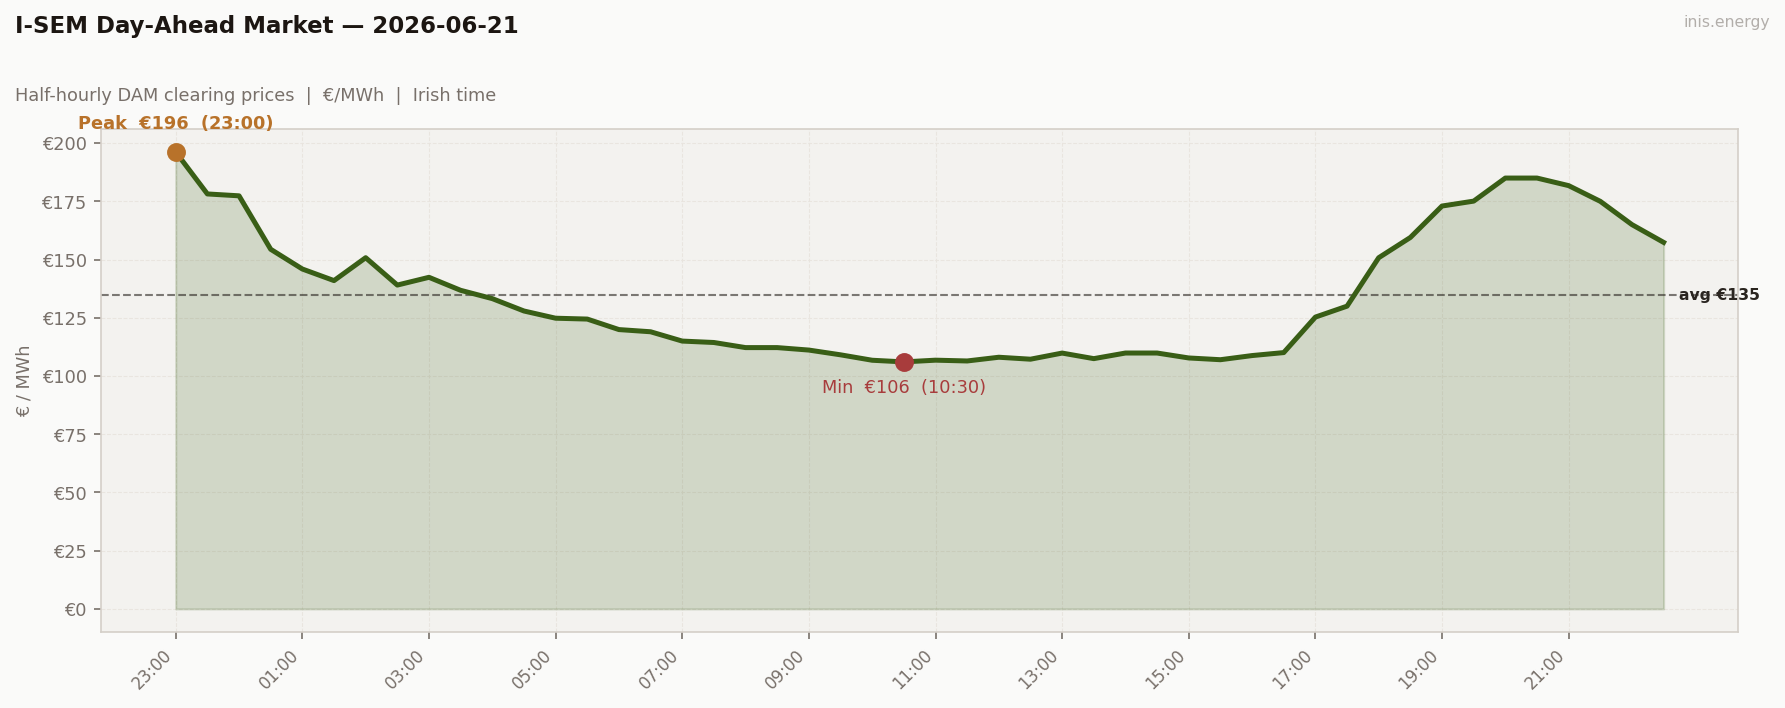
Std dev €27.89/MWh · Median €125.06/MWh · Periods above €150: 15 of 48 (31%)
Sunday, and demand fell further — 3,316 MW, the quietest of the week. Wind at 6.0% gave no help. The shape mirrors Saturday: overnight expensive (€140-196), daytime soft (€106-125 from 06:00-16:30), strong evening ramp. The median (€125.06) well below the mean (€134.59) reflects that cheap daytime drag. The 23:00 spike to €196.20 is already pricing in Monday’s demand.
Price vs Wind #
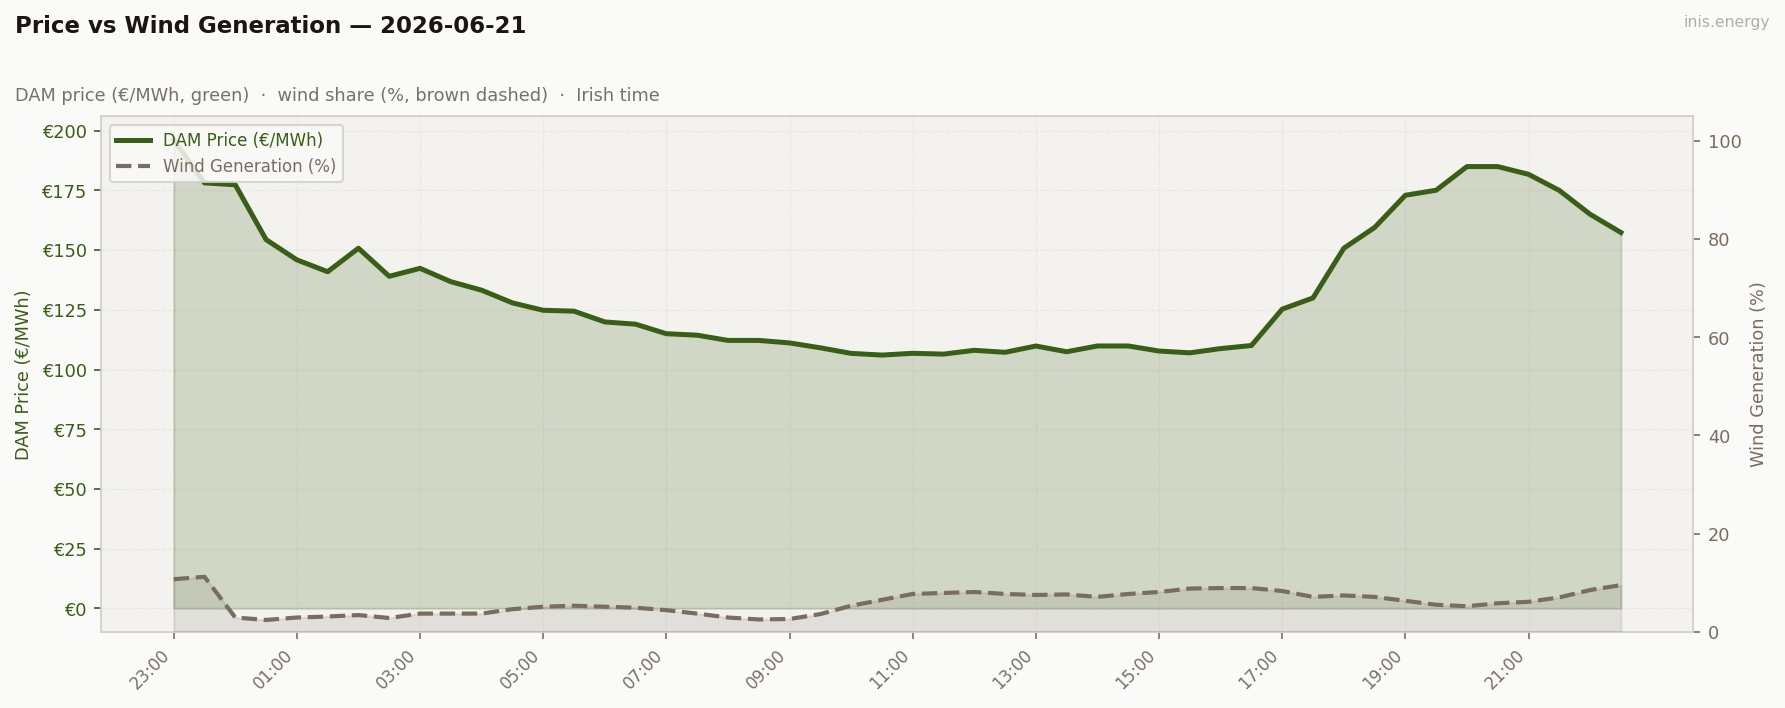
Mean wind: 6.0% · Range: 2.4%–11.2%
Wind was almost irrelevant today, ranging 2.4%–11.2% with no meaningful momentum. The afternoon wind tick-up to 8-11% (10:30–16:30) kept daytime prices in the €106-110 range — the softest window of the day. When wind faded back to 5-7% from 17:00 onward, the evening ramp had no brake: €125 at 17:00, €150 at 18:00, €196 at 23:00. Low wind throughout, demand doing the steering.
Week in Context #
Price Duration Curve #
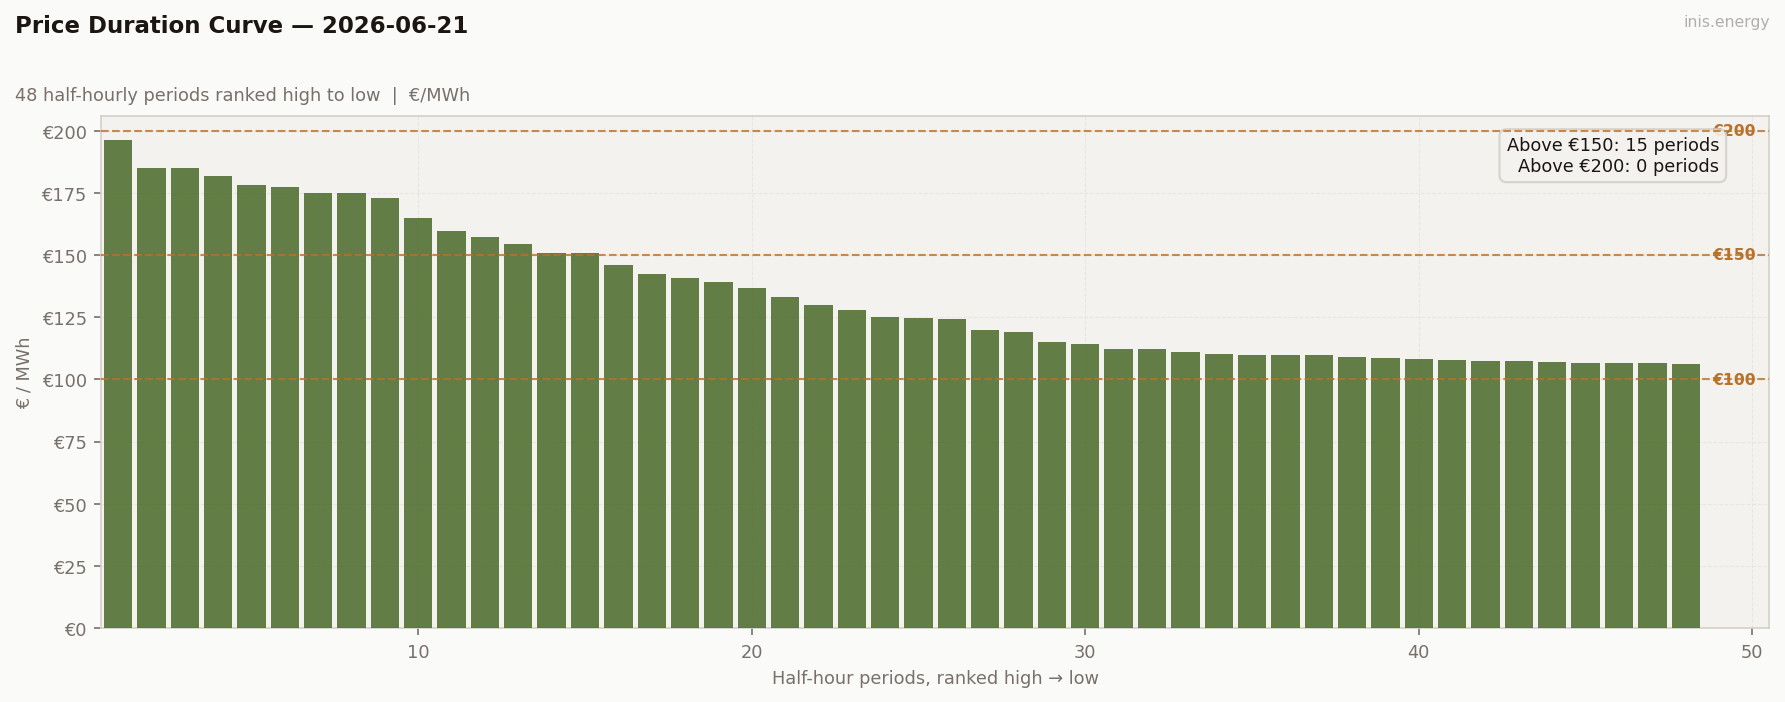
Periods above €150: 15 (31% of day) · Above €200: 0 (0% of day)
15 periods above €150, zero above €200. The curve is stepped — a block of cheap periods from €106-125 through the daytime, then a rising tail into the evening. No scarcity, no floor-lifting gas crunch. The weekend demand profile written into the duration curve.
Peak / Off-Peak Spread #
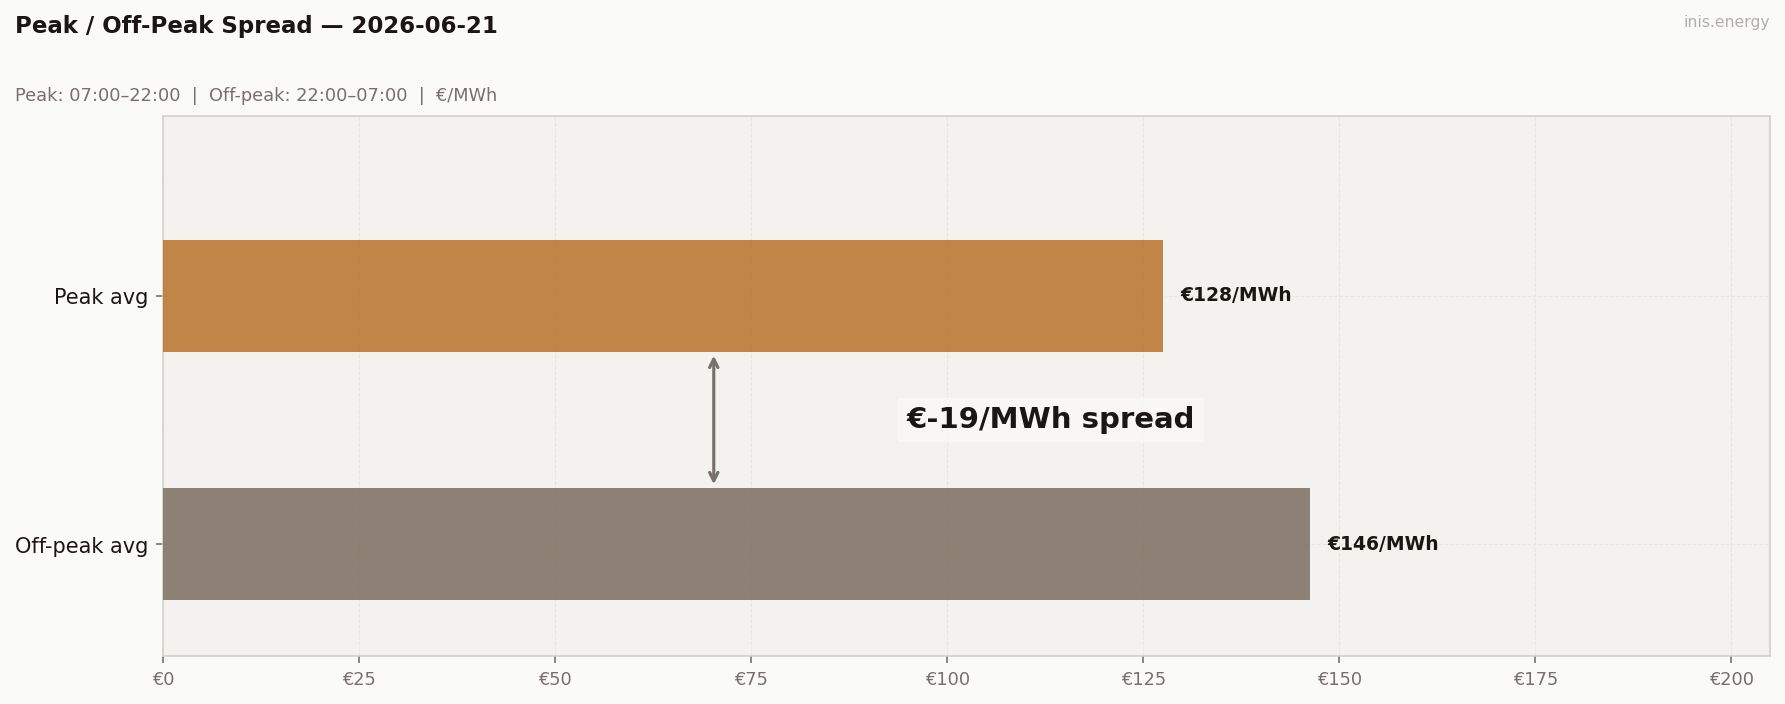
Peak avg (07:00–22:00): €127.55/MWh · Off-peak avg: €146.33/MWh · Spread: €-18.78/MWh
Another negative spread, more pronounced than Saturday at €-18.78. Off-peak (€146.33) is hauled up by the overnight and the 23:00 spike (€196.20 sitting in the off-peak window). The cheap hours are in the middle of the day — not the middle of the night. Two days running where the conventional peak/off-peak framework points you in the wrong direction.
BESS Dispatch Signal #
| Price | Time | Energy | Value | |
|---|---|---|---|---|
| Charge | €107/MWh | 10:00 | 2 MWh | −€213 |
| Discharge | €182/MWh | 19:30 | 1.7 MWh (85% RTE) | +€309 |
| Gross profit | €96 | |||
| Price spread | €75/MWh | ROI: 45.0% |
Simulated 1MW/2MWh battery, one optimal DAM cycle. Gross before network charges and capacity costs.
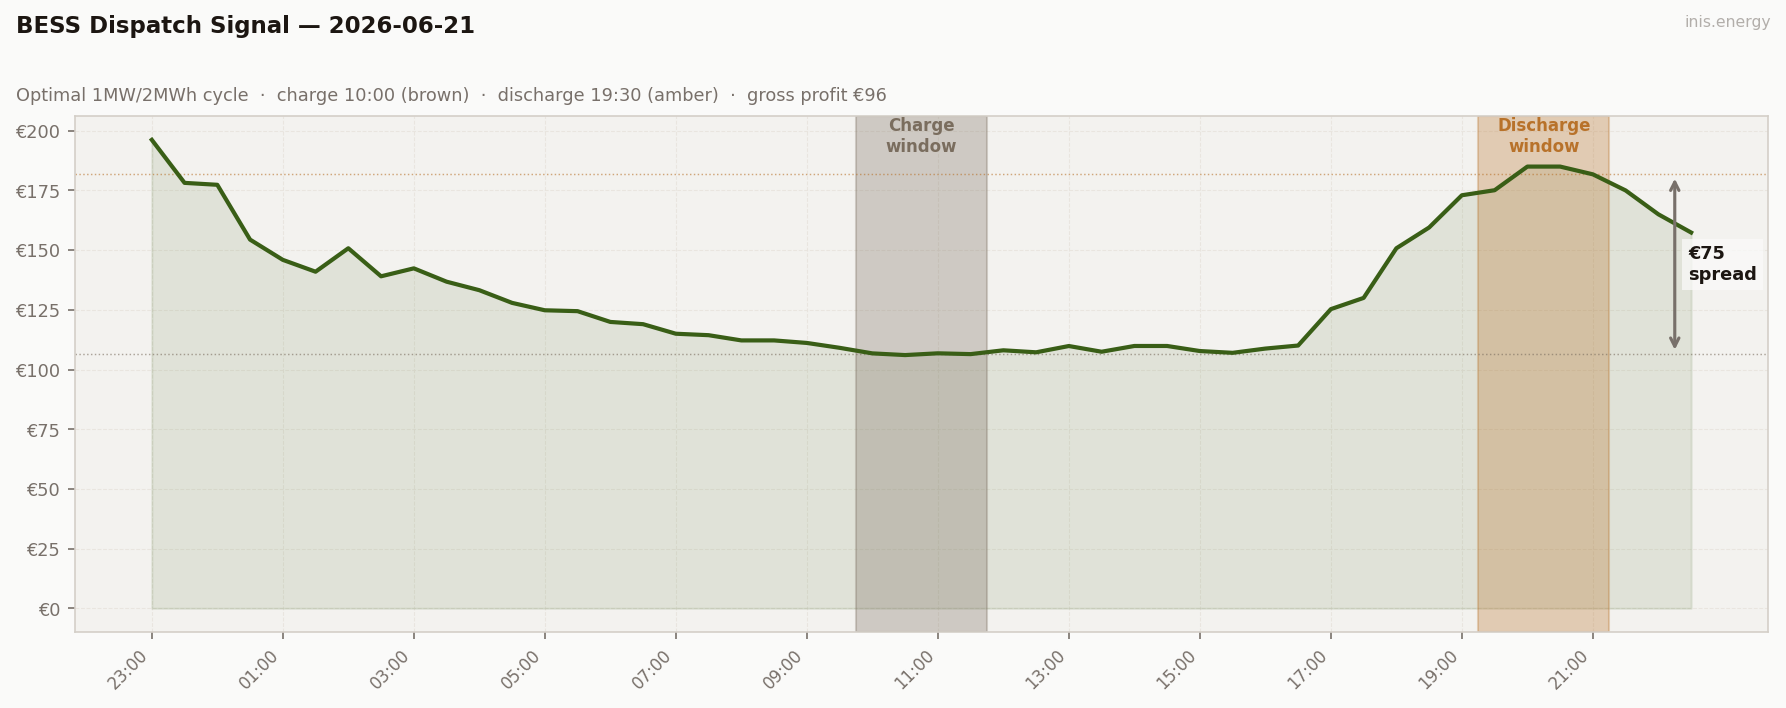
Charge at €107 at 10:00 in the Sunday morning quiet, discharge at €182 at 19:30 right in the evening ramp. €96 gross, ROI 45.0%. Same weekend playbook as Saturday — exploit the cheap daytime, discharge into the evening ramp. The ROI is softer than yesterday’s 55.7% because the daytime floor wasn’t quite as deep. Still a decent day relative to the thermal-priced weekdays earlier in the week.
Commentary #
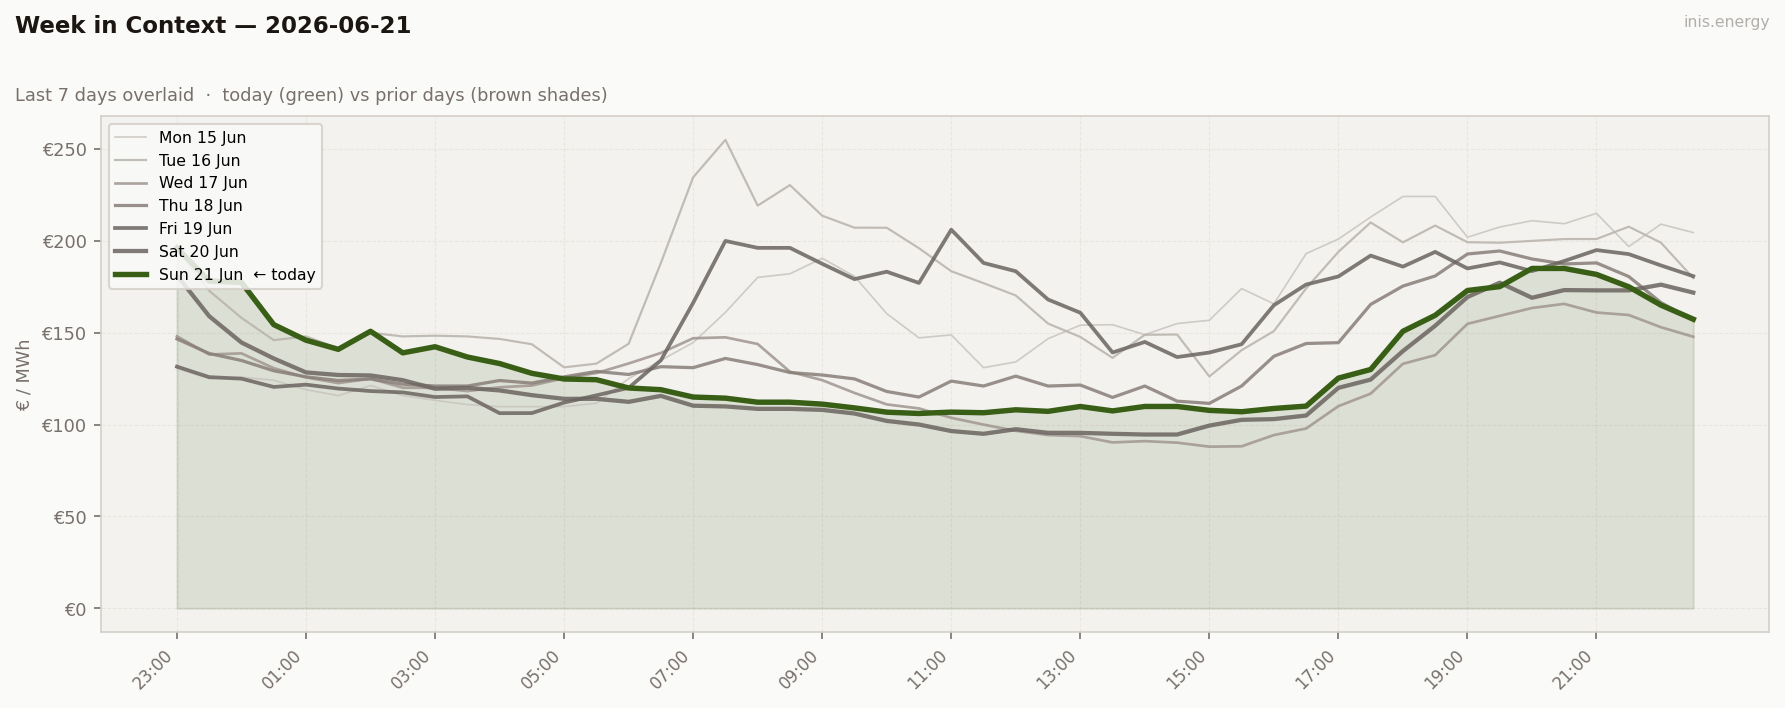
Sunday extended Saturday’s pattern — light demand, cheap daytime, expensive evenings. Mean of €134.59/MWh was up from Saturday’s €125.13, mainly because the overnight held higher (€140-177 range) and the evening ramp was steeper, ending at €196.20 by 23:00.
Wind at 6.0% contributed almost nothing. The daytime softness (€106-110 from 09:00-16:30) was purely demand-driven — Sunday morning and afternoon load is about as light as the Irish grid gets. A brief afternoon wind tick to 8-11% helped confirm the floor rather than create it. When wind faded back from 17:00, the evening ramp had no brake.
The negative spread (€-18.78) is now the second day running. Overnight prices — set by the tail of the previous day and next-day anticipation — keep beating the daytime average. The 23:00 price (€196.20) is already pricing in Monday’s demand. It’s not going to be cheap tomorrow.
Half-hourly data — 2026-06-21
| Period | Time | Price (€/MWh) | Wind % |
|---|---|---|---|
| 1 | 23:00 | 196.20 | 10.7% |
| 2 | 23:30 | 178.18 | 11.2% |
| 3 | 00:00 | 177.37 | 2.9% |
| 4 | 00:30 | 154.42 | 2.4% |
| 5 | 01:00 | 145.94 | 2.9% |
| 6 | 01:30 | 140.97 | 3.1% |
| 7 | 02:00 | 150.80 | 3.4% |
| 8 | 02:30 | 139.05 | 2.8% |
| 9 | 03:00 | 142.38 | 3.7% |
| 10 | 03:30 | 136.80 | 3.7% |
| 11 | 04:00 | 133.23 | 3.7% |
| 12 | 04:30 | 127.92 | 4.6% |
| 13 | 05:00 | 124.82 | 5.1% |
| 14 | 05:30 | 124.45 | 5.3% |
| 15 | 06:00 | 119.94 | 5.1% |
| 16 | 06:30 | 119.00 | 4.9% |
| 17 | 07:00 | 115.00 | 4.4% |
| 18 | 07:30 | 114.39 | 3.7% |
| 19 | 08:00 | 112.20 | 2.9% |
| 20 | 08:30 | 112.20 | 2.5% |
| 21 | 09:00 | 111.14 | 2.6% |
| 22 | 09:30 | 109.10 | 3.6% |
| 23 | 10:00 | 106.77 | 5.3% |
| 24 | 10:30 | 106.06 | 6.5% |
| 25 | 11:00 | 106.80 | 7.7% |
| 26 | 11:30 | 106.46 | 7.9% |
| 27 | 12:00 | 108.06 | 8.1% |
| 28 | 12:30 | 107.22 | 7.7% |
| 29 | 13:00 | 109.85 | 7.5% |
| 30 | 13:30 | 107.46 | 7.6% |
| 31 | 14:00 | 109.87 | 7.1% |
| 32 | 14:30 | 109.87 | 7.7% |
| 33 | 15:00 | 107.75 | 8.1% |
| 34 | 15:30 | 107.00 | 8.8% |
| 35 | 16:00 | 108.78 | 8.9% |
| 36 | 16:30 | 110.06 | 8.9% |
| 37 | 17:00 | 125.30 | 8.3% |
| 38 | 17:30 | 130.00 | 7.1% |
| 39 | 18:00 | 150.79 | 7.4% |
| 40 | 18:30 | 159.49 | 7.1% |
| 41 | 19:00 | 172.99 | 6.3% |
| 42 | 19:30 | 175.10 | 5.5% |
| 43 | 20:00 | 185.00 | 5.2% |
| 44 | 20:30 | 185.00 | 5.8% |
| 45 | 21:00 | 181.75 | 6.1% |
| 46 | 21:30 | 175.00 | 7.0% |
| 47 | 22:00 | 165.01 | 8.5% |
| 48 | 22:30 | 157.38 | 9.5% |
Compare your business electricity and gas rates in minutes with INIS Energy Brokers.
Compare rates