I-SEM Daily Briefing — 24 June 2026
Table of Contents
Market Snapshot
| Metric | Value |
|---|---|
| Mean DAM Price | €213.03/MWh |
| Median Price | €179.37/MWh |
| Std Dev | €81.75/MWh |
| Peak Price | €414.2/MWh (20:00) |
| Min Price | €145.0/MWh (04:00) |
| Price Range | €269.2/MWh |
| Periods above €150 | 41 of 48 (85%) |
| Periods above €200 | 19 of 48 (40%) |
| Peak Avg (07–22) | €239.04/MWh |
| Off-peak Avg (22–07) | €169.69/MWh |
| Peak/Off-Peak Spread | €69.35/MWh |
| Wind % of Demand | 3.3% |
| Wind Range | 0.5%–14.2% |
| Mean Demand | 3909 MW |
Price Profile #
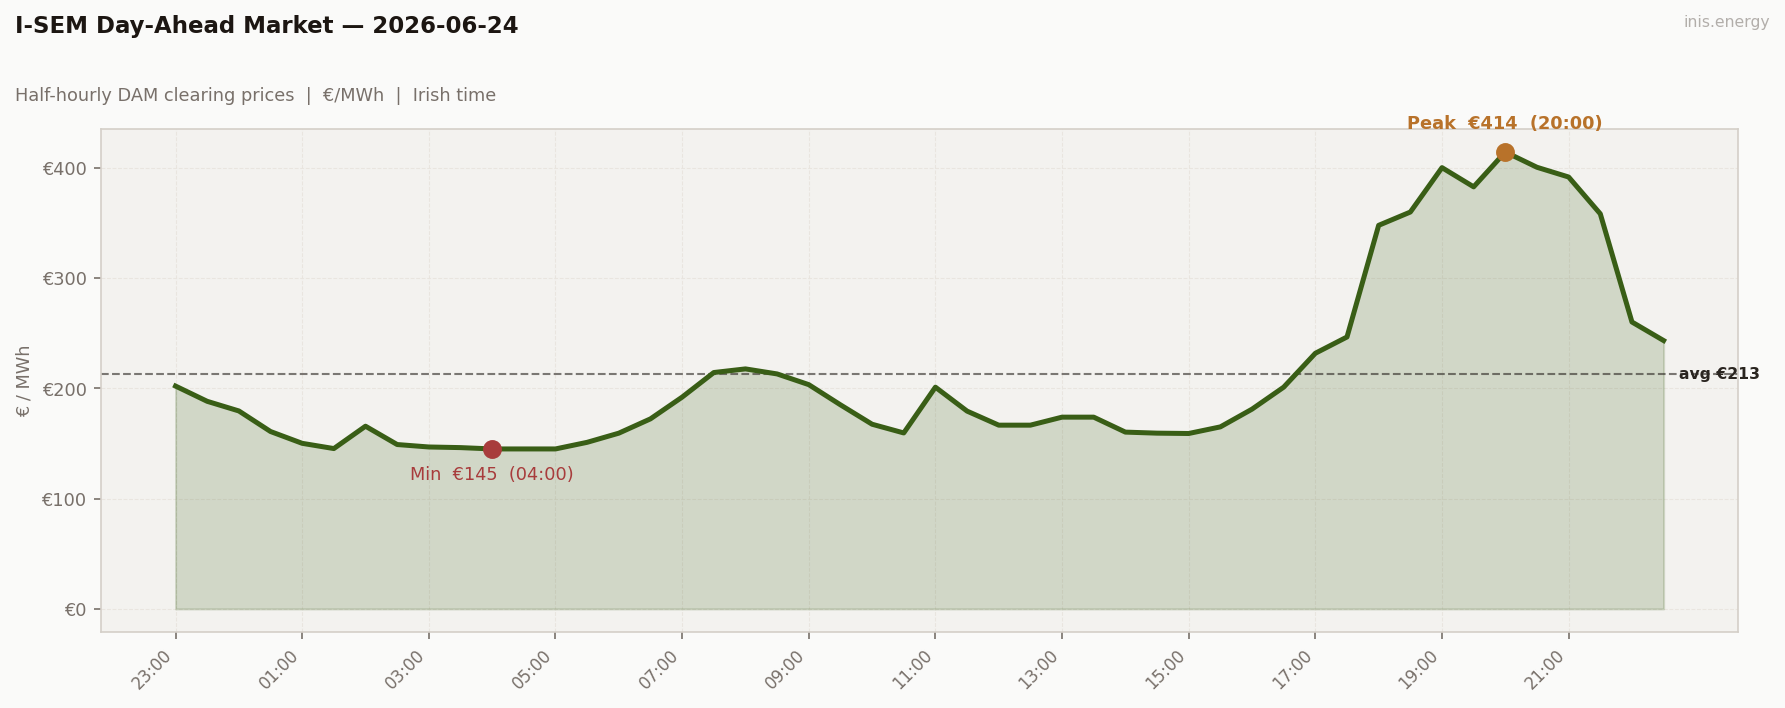
Std dev €81.75/MWh · Median €179.37/MWh · Periods above €150: 41 of 48 (85%)
The std dev of €81.75 is nearly double Tuesday’s and the biggest in the blog’s history so far. The median (€179.37) sitting well below the mean (€213.03) tells you the distribution is skewed hard right — the extreme evening spike dragging the average up. The floor (€145.00 at 04:00–05:00) is gas-set; not cheap by any measure, but the only relief all day. Then the evening went critical: €347 at 18:00, €400 at 19:00, €414.20 at 20:00. Prices that belong in a stressed winter grid appearing in June.
Price vs Wind #
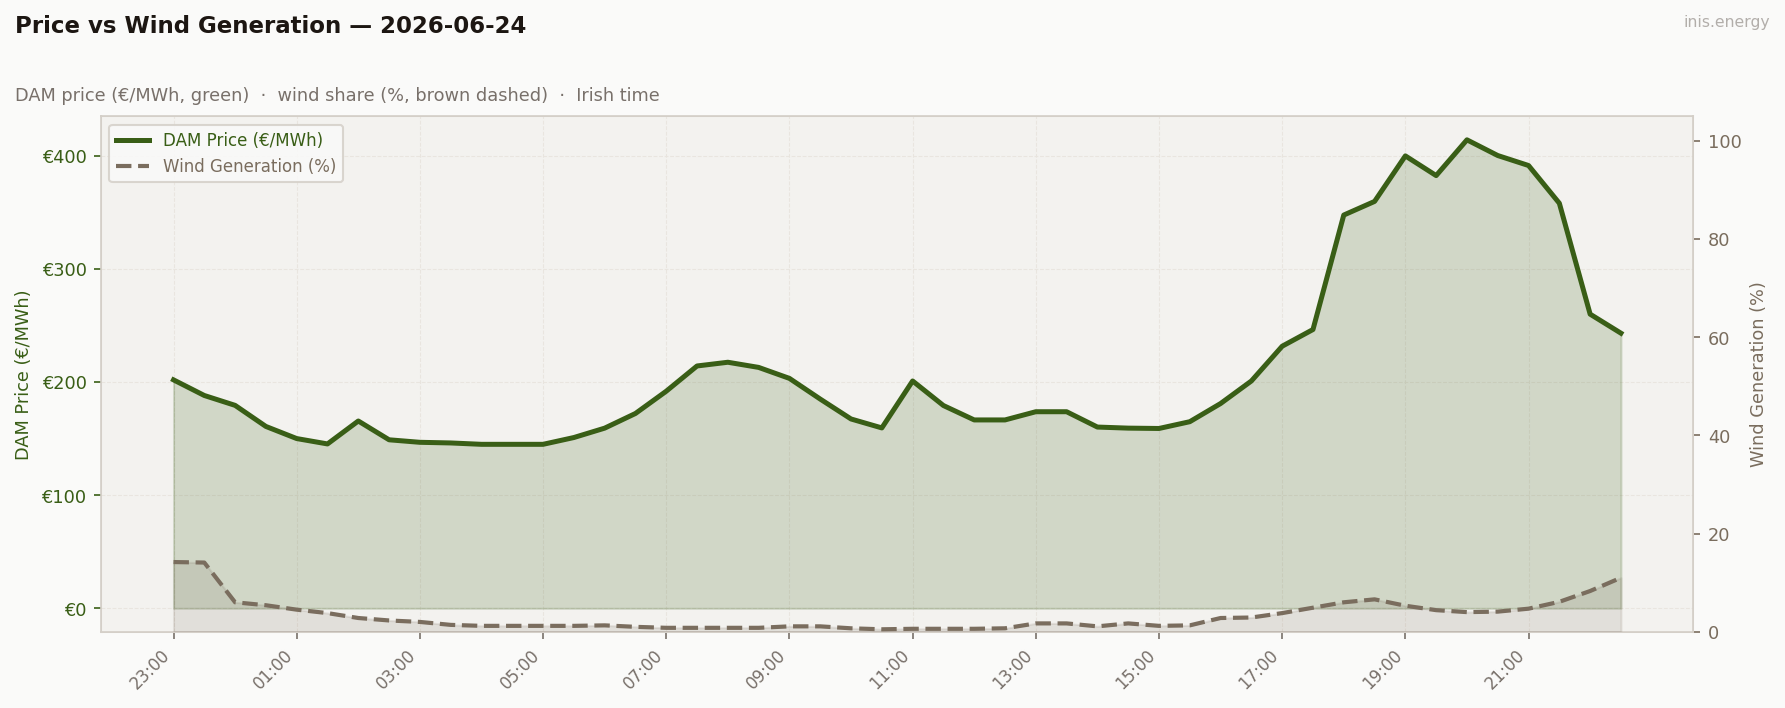
Mean wind: 3.3% · Range: 0.5%–14.2%
Wind averaged 3.3% — the lowest of the week. For ten hours straight (06:30–16:30) wind sat below 2%, bottoming at 0.5% at 10:30 — essentially absent. Price and wind were in lock-step all day: near-zero wind, near-crisis prices. The only relief came at the very end — wind picked up to 8.3% at 22:00 and 11.0% at 22:30, and prices fell €154 in two half-hours. Wind showed up two hours too late.
Week in Context #
Price Duration Curve #
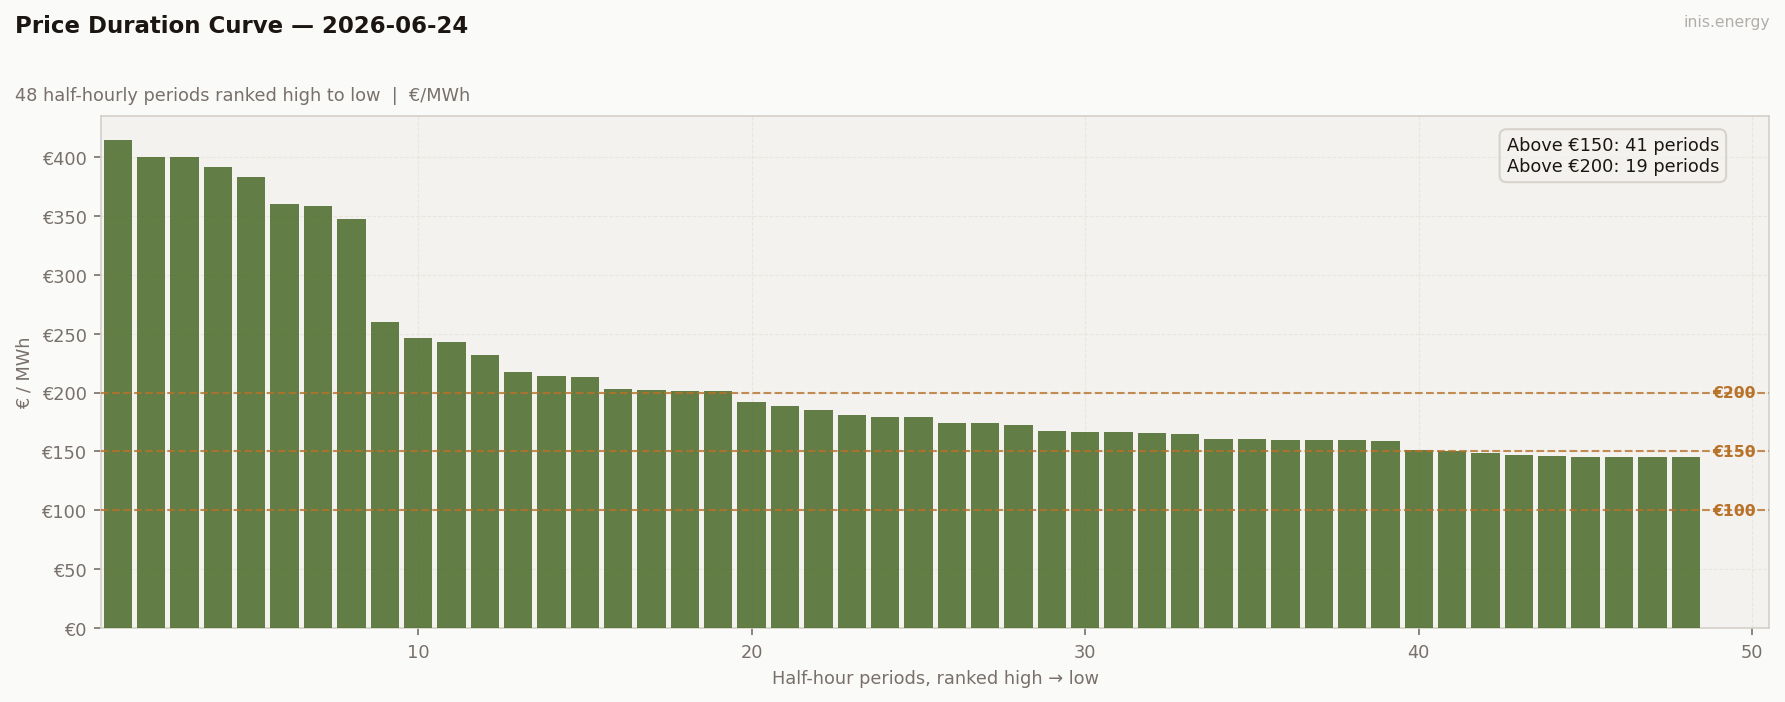
Periods above €150: 41 (85% of day) · Above €200: 19 (40% of day)
19 periods above €200 (40%) — the most scarcity of any day this week. And the top end is extreme: six consecutive periods above €347 from 18:00–21:30, peaking at €414. The floor at €145 and the median at €179 don’t hint at the violence in the top quartile. A scarcity event distorts the PDC into an L-shape — a long flat expensive body with a near-vertical spike at the top.
Peak / Off-Peak Spread #
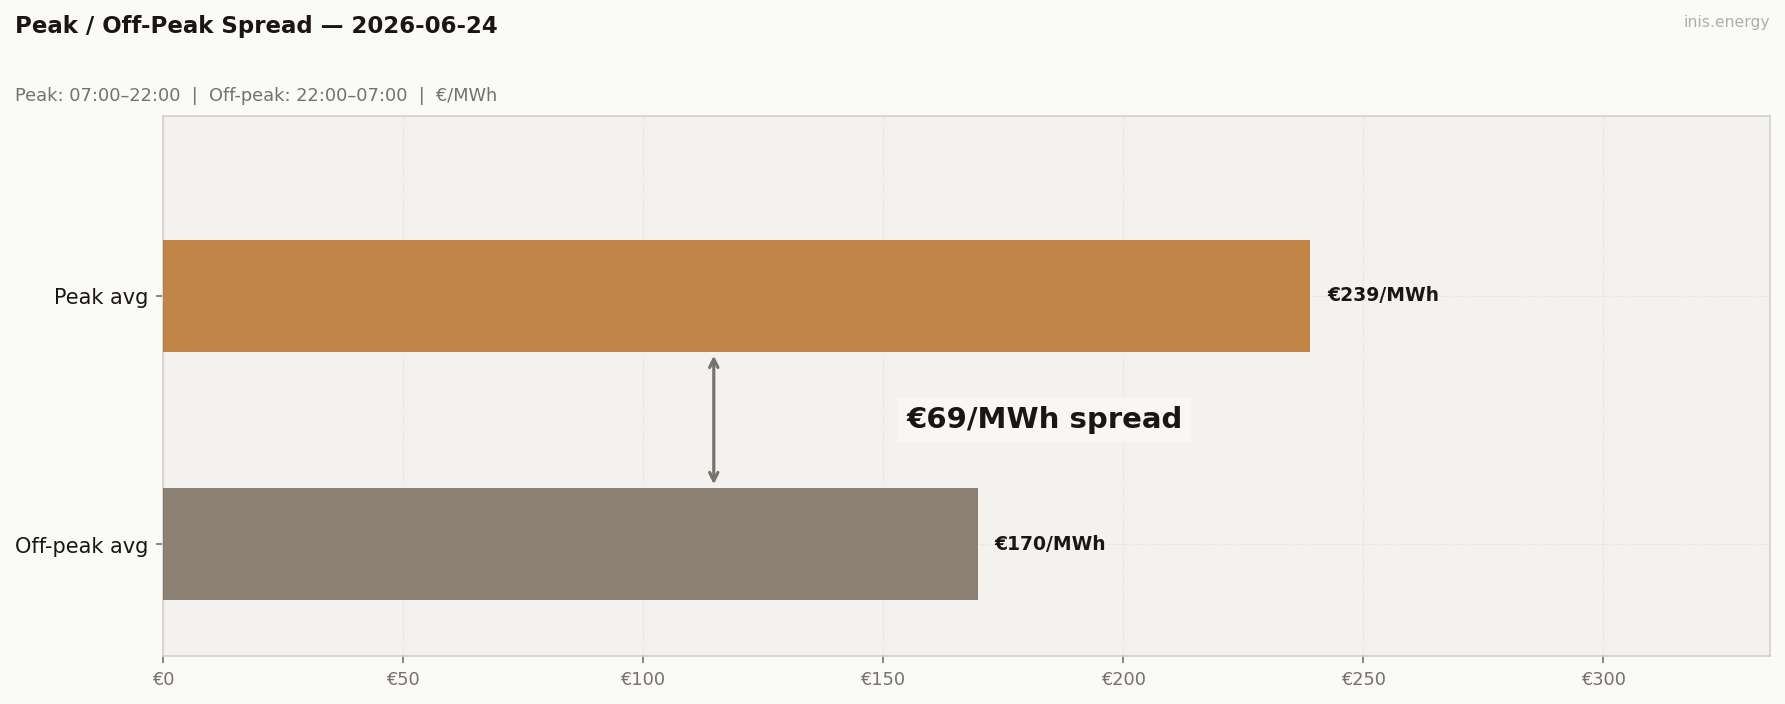
Peak avg (07:00–22:00): €239.04/MWh · Off-peak avg: €169.69/MWh · Spread: €69.35/MWh
€69.35 — the widest positive spread of the week. Off-peak (€169.69) includes the overnight decline to €145 and the late-night wind recovery pulling 22:00-22:30 back to €243-260. Peak (€239.04) is the morning ramp and extraordinary evening scarcity averaged out. For a battery that could wait — charge at 04:00, discharge at 19:00-20:00 — this was the best structural spread the week offered.
BESS Dispatch Signal #
| Price | Time | Energy | Value | |
|---|---|---|---|---|
| Charge | €145/MWh | 03:30 | 2 MWh | −€291 |
| Discharge | €399/MWh | 19:00 | 1.7 MWh (85% RTE) | +€679 |
| Gross profit | €388 | |||
| Price spread | €254/MWh | ROI: 133.6% |
Simulated 1MW/2MWh battery, one optimal DAM cycle. Gross before network charges and capacity costs.
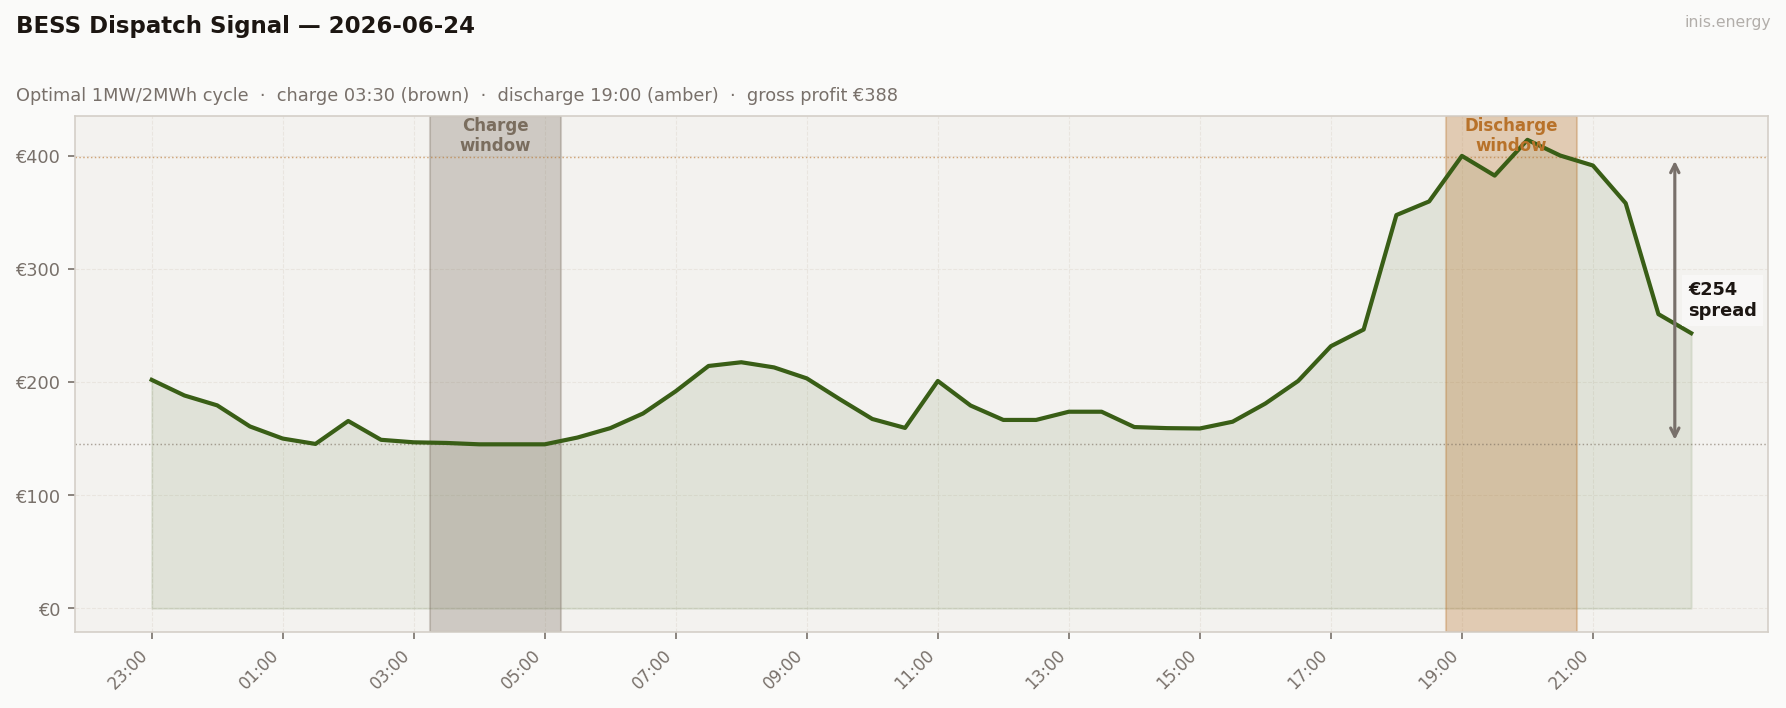
Charge at €145 at 03:30 — overnight, wind at 1.4%, demand light enough to keep prices at the floor. Discharge at €399 at 19:00 — the scarcity spike in full swing. €388 gross, ROI 133.6%. The best BESS day in the blog’s history. To put it plainly: charge cost €291, revenue €679 — more than doubled on one cycle. A €254 charge-to-discharge spread on a 1MW/2MWh battery is exceptional. This is the day that makes the investment case for storage.
Commentary #
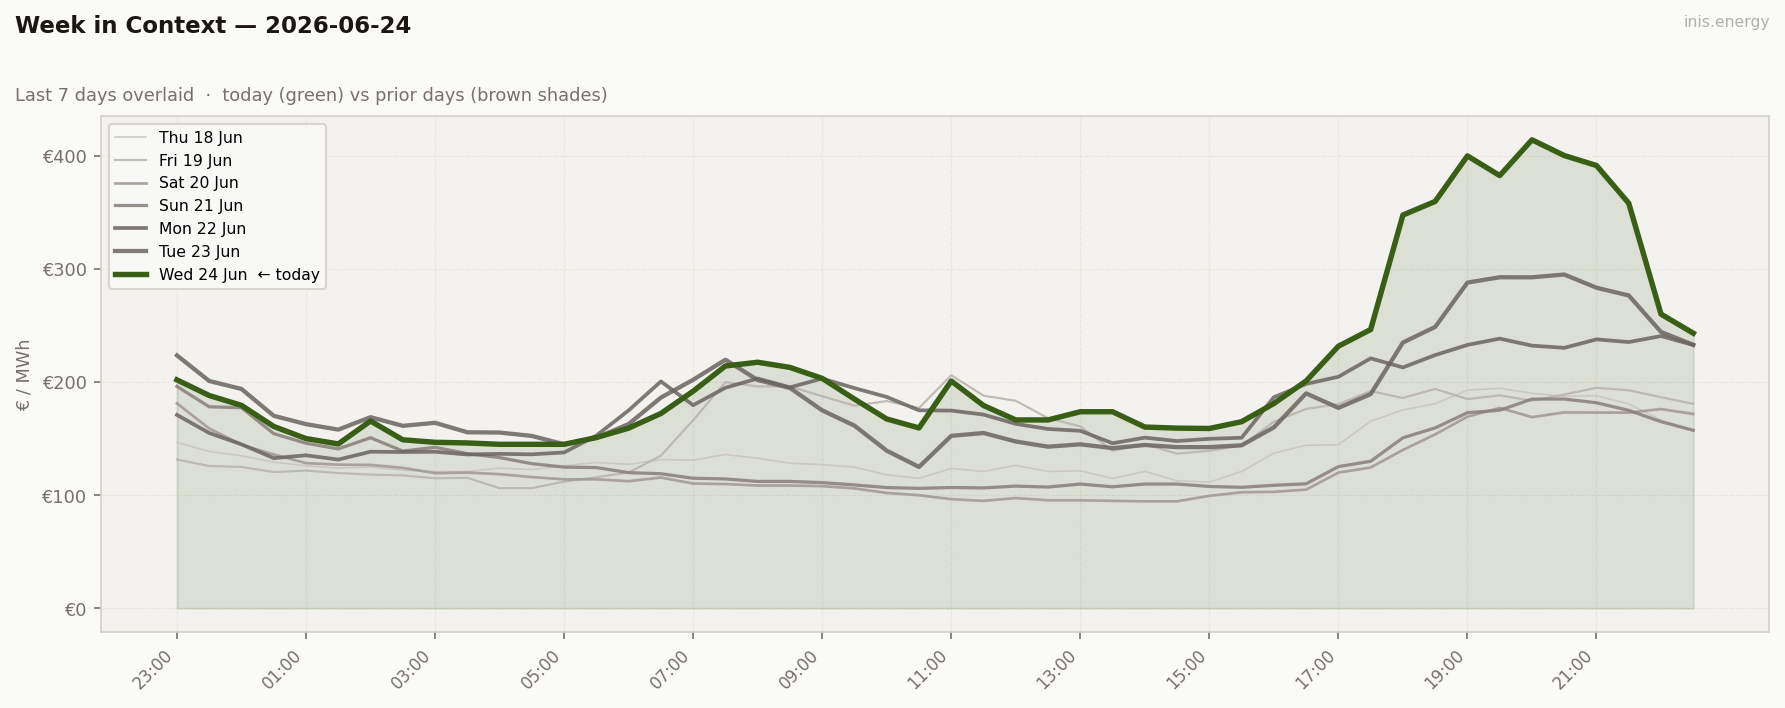
The week’s extreme. Mean €213.03, peak €414.20, std dev €81.75 — all records. Wind at 3.3% mean and 0.5% at its nadir gave the market nothing to work with. For sixteen hours (06:30–22:00) wind sat below 5%, and during the evening demand peak it was essentially absent. Gas ran out of margin.
The profile has a recognisable shape buried under the scarcity: overnight floor (€145 at 04:00–05:00), morning ramp (€145 → €217 by 08:00), a mid-morning soft patch (€159-185 from 09:30-15:00 as demand dipped), then the collapse from 17:00. €231 at 17:00, €347 at 18:00, €414 at 20:00. The scarcity resolved fast — wind finally arrived at 22:00 (8-11%) and prices fell €154 in two half-hours.
Storage had a record day. €388 gross on a 1MW/2MWh cycle, charge at €145, discharge at €399. Consumers faced a brutal evening; batteries faced a record payday. Two directions for the same absence of wind.
Half-hourly data — 2026-06-24
| Period | Time | Price (€/MWh) | Wind % |
|---|---|---|---|
| 1 | 23:00 | 201.99 | 14.2% |
| 2 | 23:30 | 188.17 | 14.1% |
| 3 | 00:00 | 179.44 | 6.0% |
| 4 | 00:30 | 160.80 | 5.4% |
| 5 | 01:00 | 150.09 | 4.5% |
| 6 | 01:30 | 145.34 | 3.8% |
| 7 | 02:00 | 165.62 | 2.8% |
| 8 | 02:30 | 149.00 | 2.3% |
| 9 | 03:00 | 146.78 | 2.0% |
| 10 | 03:30 | 146.21 | 1.4% |
| 11 | 04:00 | 145.00 | 1.2% |
| 12 | 04:30 | 145.00 | 1.2% |
| 13 | 05:00 | 145.00 | 1.2% |
| 14 | 05:30 | 151.00 | 1.2% |
| 15 | 06:00 | 159.30 | 1.3% |
| 16 | 06:30 | 172.27 | 1.0% |
| 17 | 07:00 | 191.97 | 0.8% |
| 18 | 07:30 | 214.27 | 0.8% |
| 19 | 08:00 | 217.56 | 0.8% |
| 20 | 08:30 | 213.00 | 0.8% |
| 21 | 09:00 | 203.29 | 1.1% |
| 22 | 09:30 | 185.00 | 1.1% |
| 23 | 10:00 | 167.40 | 0.7% |
| 24 | 10:30 | 159.50 | 0.5% |
| 25 | 11:00 | 201.00 | 0.6% |
| 26 | 11:30 | 179.30 | 0.6% |
| 27 | 12:00 | 166.56 | 0.6% |
| 28 | 12:30 | 166.56 | 0.7% |
| 29 | 13:00 | 173.82 | 1.7% |
| 30 | 13:30 | 173.82 | 1.7% |
| 31 | 14:00 | 160.26 | 1.1% |
| 32 | 14:30 | 159.31 | 1.7% |
| 33 | 15:00 | 159.00 | 1.2% |
| 34 | 15:30 | 165.00 | 1.3% |
| 35 | 16:00 | 181.07 | 2.8% |
| 36 | 16:30 | 201.00 | 2.9% |
| 37 | 17:00 | 231.73 | 3.8% |
| 38 | 17:30 | 246.50 | 4.9% |
| 39 | 18:00 | 347.70 | 6.0% |
| 40 | 18:30 | 359.75 | 6.6% |
| 41 | 19:00 | 400.00 | 5.3% |
| 42 | 19:30 | 382.59 | 4.4% |
| 43 | 20:00 | 414.20 | 4.0% |
| 44 | 20:30 | 400.33 | 4.1% |
| 45 | 21:00 | 391.50 | 4.7% |
| 46 | 21:30 | 358.14 | 6.1% |
| 47 | 22:00 | 260.08 | 8.3% |
| 48 | 22:30 | 243.26 | 11.0% |
Compare your business electricity and gas rates in minutes with INIS Energy Brokers.
Compare rates