I-SEM Daily Briefing — 23 June 2026
Table of Contents
Market Snapshot
| Metric | Value |
|---|---|
| Mean DAM Price | €187.42/MWh |
| Median Price | €166.51/MWh |
| Std Dev | €48.64/MWh |
| Peak Price | €295.11/MWh (20:30) |
| Min Price | €125.0/MWh (10:30) |
| Price Range | €170.11/MWh |
| Periods above €150 | 37 of 48 (77%) |
| Periods above €200 | 15 of 48 (31%) |
| Peak Avg (07–22) | €193.55/MWh |
| Off-peak Avg (22–07) | €177.21/MWh |
| Peak/Off-Peak Spread | €16.34/MWh |
| Wind % of Demand | 5.0% |
| Wind Range | 1.4%–10.9% |
| Mean Demand | 3858 MW |
Price Profile #
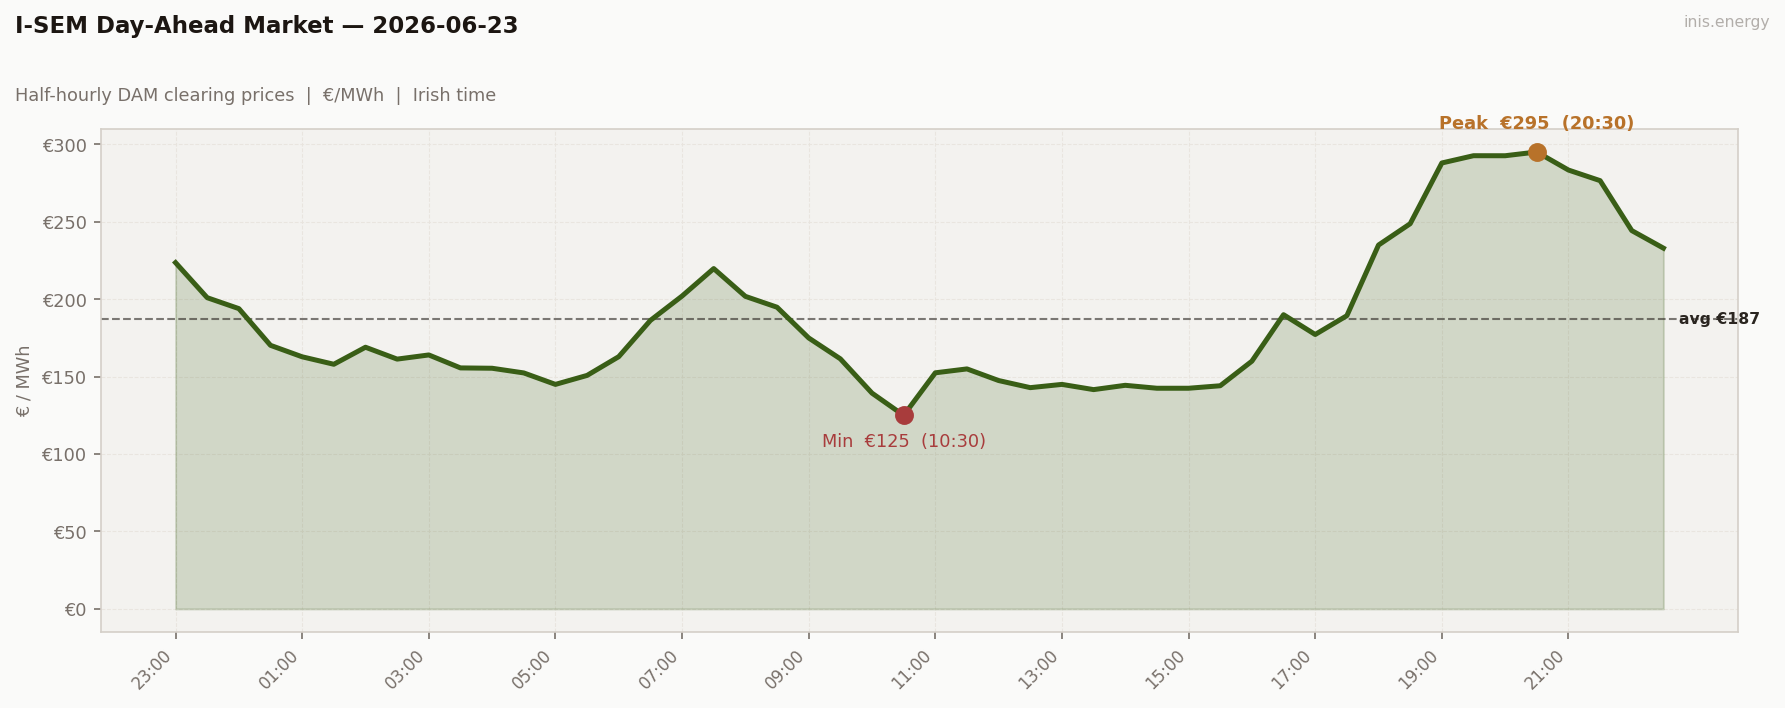
Std dev €48.64/MWh · Median €166.51/MWh · Periods above €150: 37 of 48 (77%)
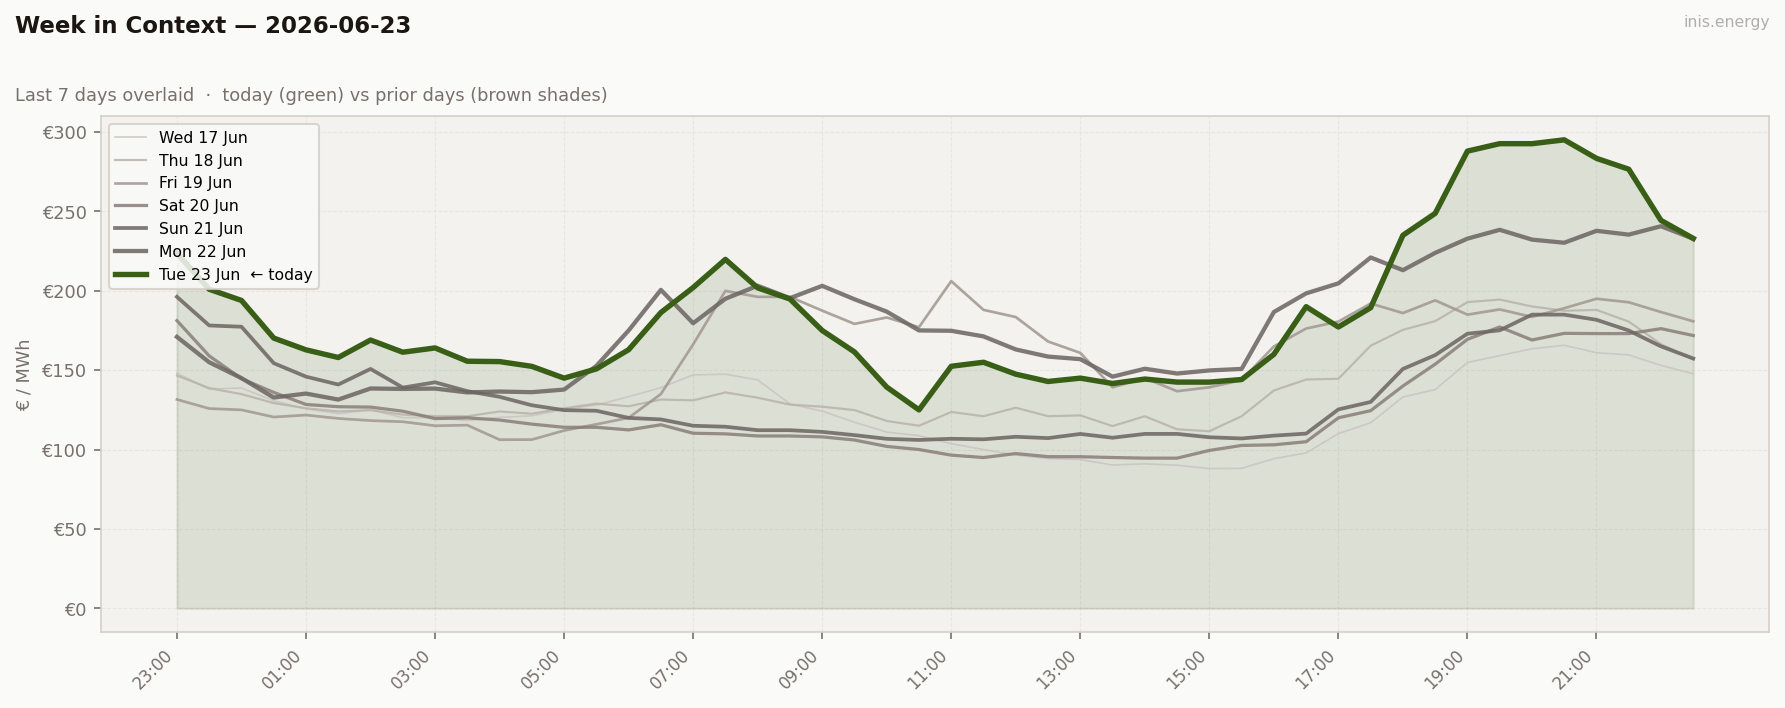
The highest mean and widest range of the week. €187.42 mean, €170.11 range, std dev €48.64 — nothing close to this has appeared in the previous four days. The profile opens very high (€223.64 at 23:00 — Monday’s scarcity carrying through), eases overnight, dips to a €125 floor at 10:30 during the midday wind window, then explodes: €235 at 18:00, €248 at 18:30, €288 at 19:00, €295.11 at 20:30. The highest price in the blog’s history so far. Wind hit 1.4%–4.4% during those scarcity hours.
Price vs Wind #
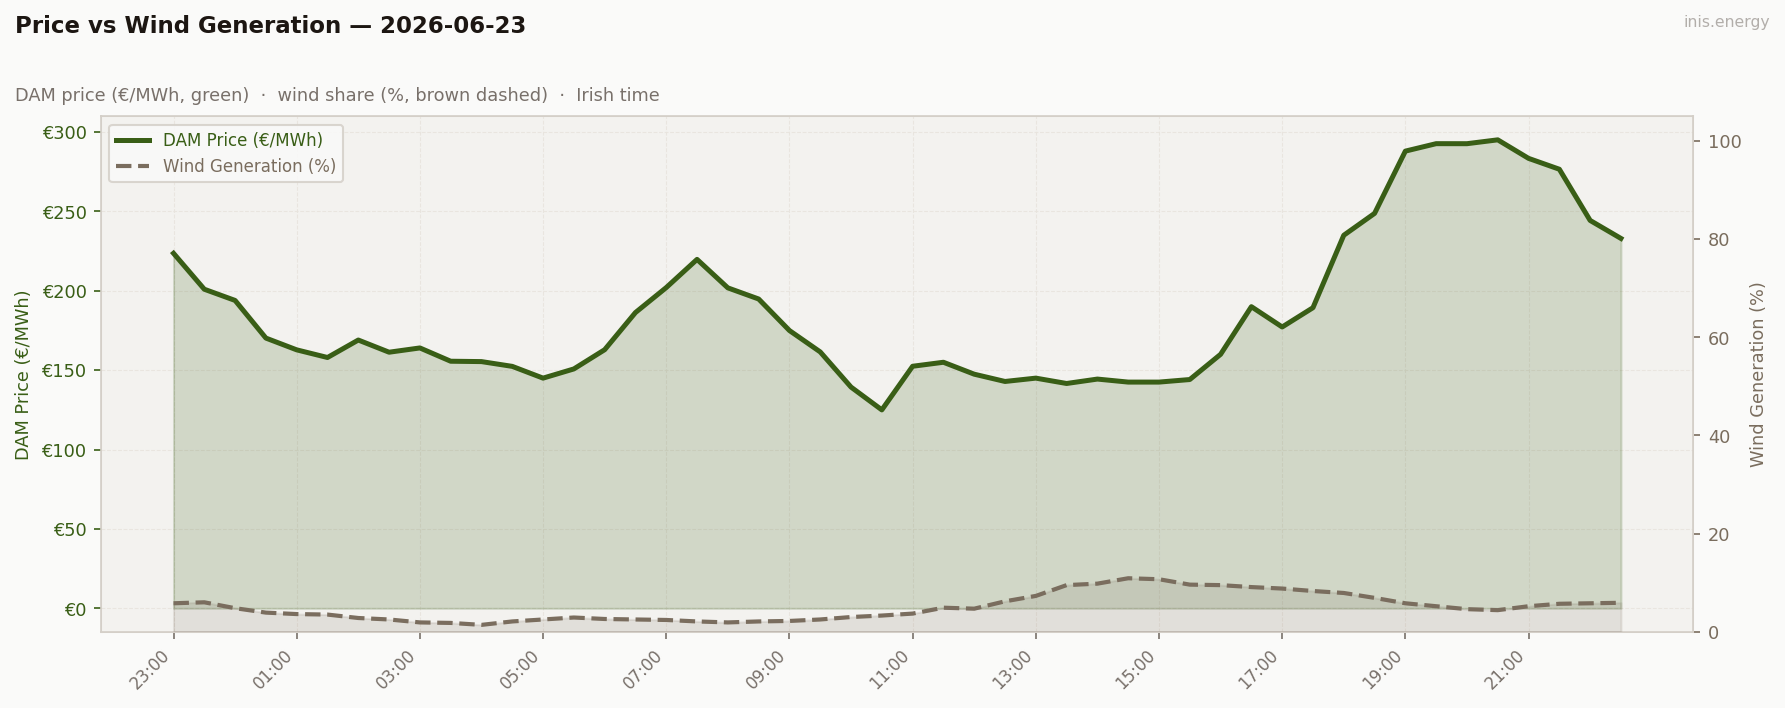
Mean wind: 5.0% · Range: 1.4%–10.9%
Wind told Tuesday’s story in three acts. Overnight near-zero (1.4-5%), keeping prices in the €152-224 range through the night — no cheap trough. Then a midday recovery to 10.9% by 14:30, pulling prices into €125-145 for about four hours. Then the collapse — wind fell from 10.9% at 14:30 back to 4.4% at 20:30, right into peak evening demand — and the market went into scarcity. Each act wrote itself directly into the price curve.
Week in Context #
Price Duration Curve #
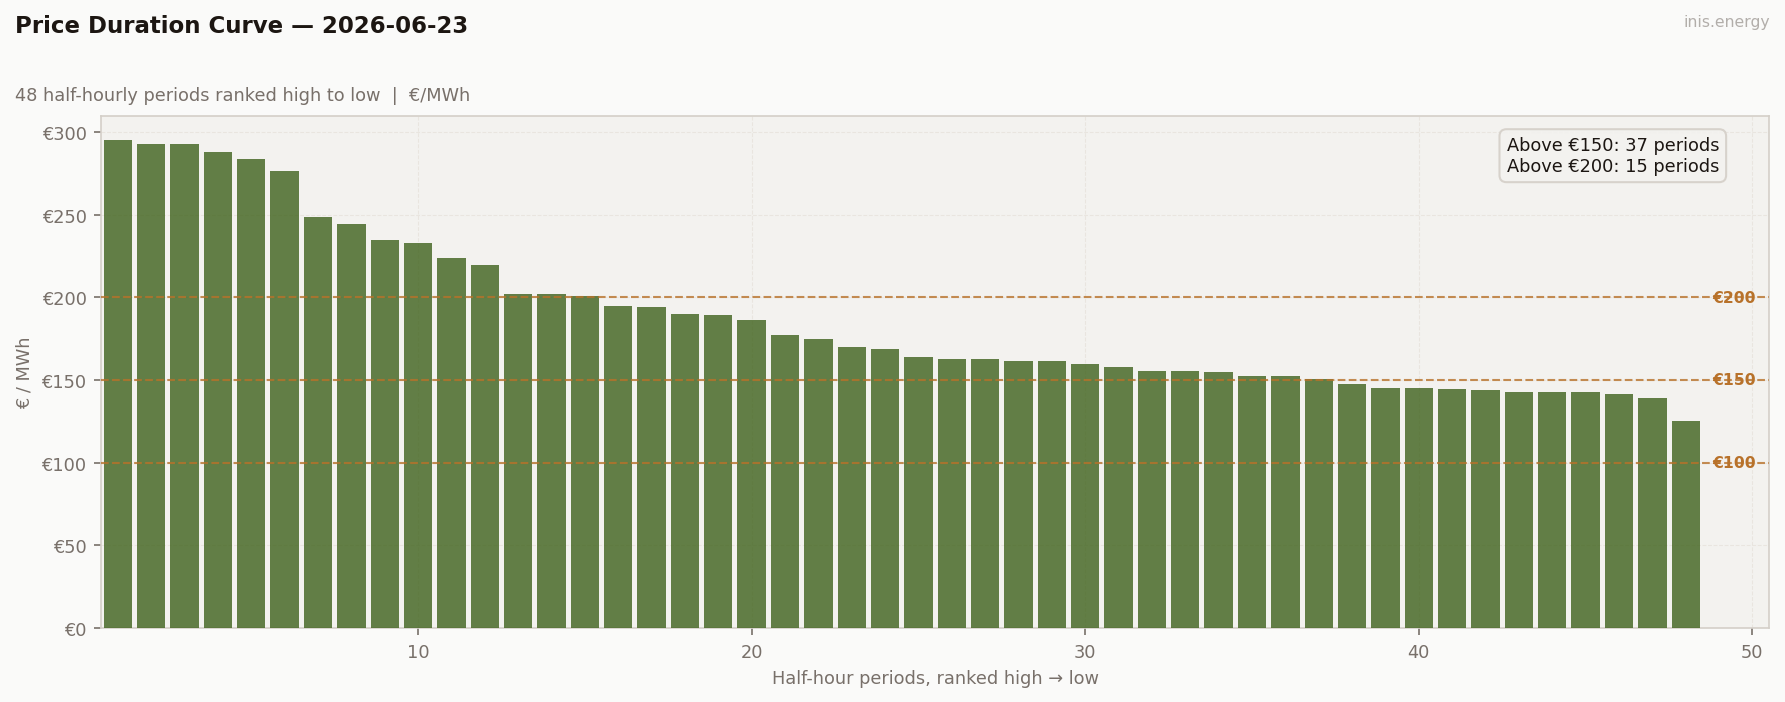
Periods above €150: 37 (77% of day) · Above €200: 15 (31% of day)
15 periods above €200, matching Monday’s count — but these sit higher, reaching €288-295 versus Monday’s €230-240. The top of the curve is steep, not gradual. Below that is a wide mid-range tier (€155-195), then the midday trough below €145. The std dev of €48.64 is the signature: this is a day of extremes, not a smooth gas ramp.
Peak / Off-Peak Spread #
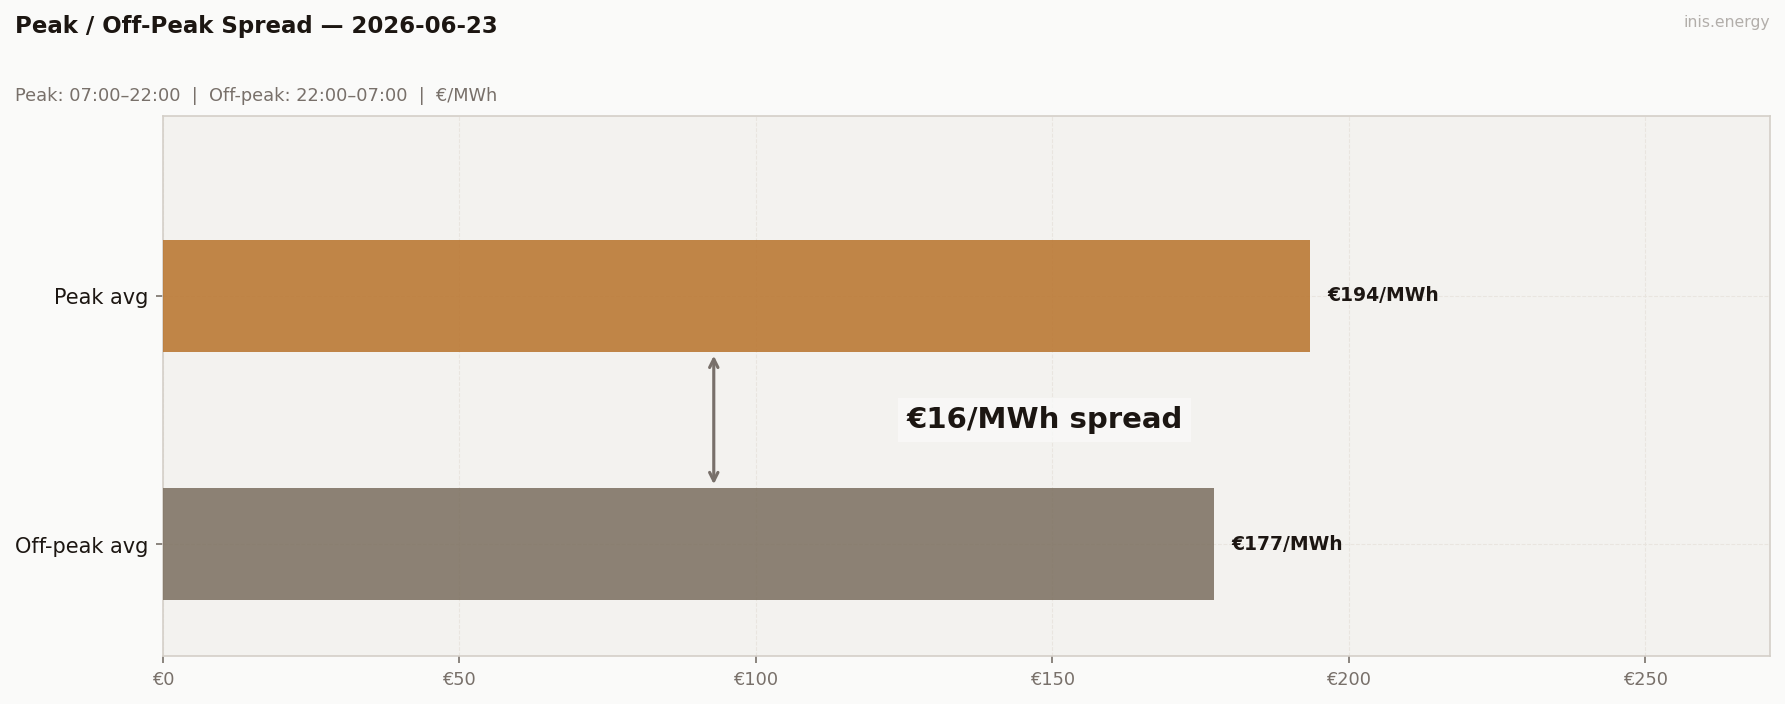
Peak avg (07:00–22:00): €193.55/MWh · Off-peak avg: €177.21/MWh · Spread: €16.34/MWh
The €16.34 spread flatters to deceive. The overnight was already expensive (€155-224), dragging the off-peak average to €177.21. The peak window contains both the cheap midday trough and the extreme evening scarcity — they cancel out in the average. The intraday range of €170.11 is the number that matters here. The spread metric can’t capture a day with three distinct regimes.
BESS Dispatch Signal #
| Price | Time | Energy | Value | |
|---|---|---|---|---|
| Charge | €143/MWh | 13:30 | 2 MWh | −€286 |
| Discharge | €292/MWh | 19:00 | 1.7 MWh (85% RTE) | +€497 |
| Gross profit | €211 | |||
| Price spread | €149/MWh | ROI: 73.9% |
Simulated 1MW/2MWh battery, one optimal DAM cycle. Gross before network charges and capacity costs.
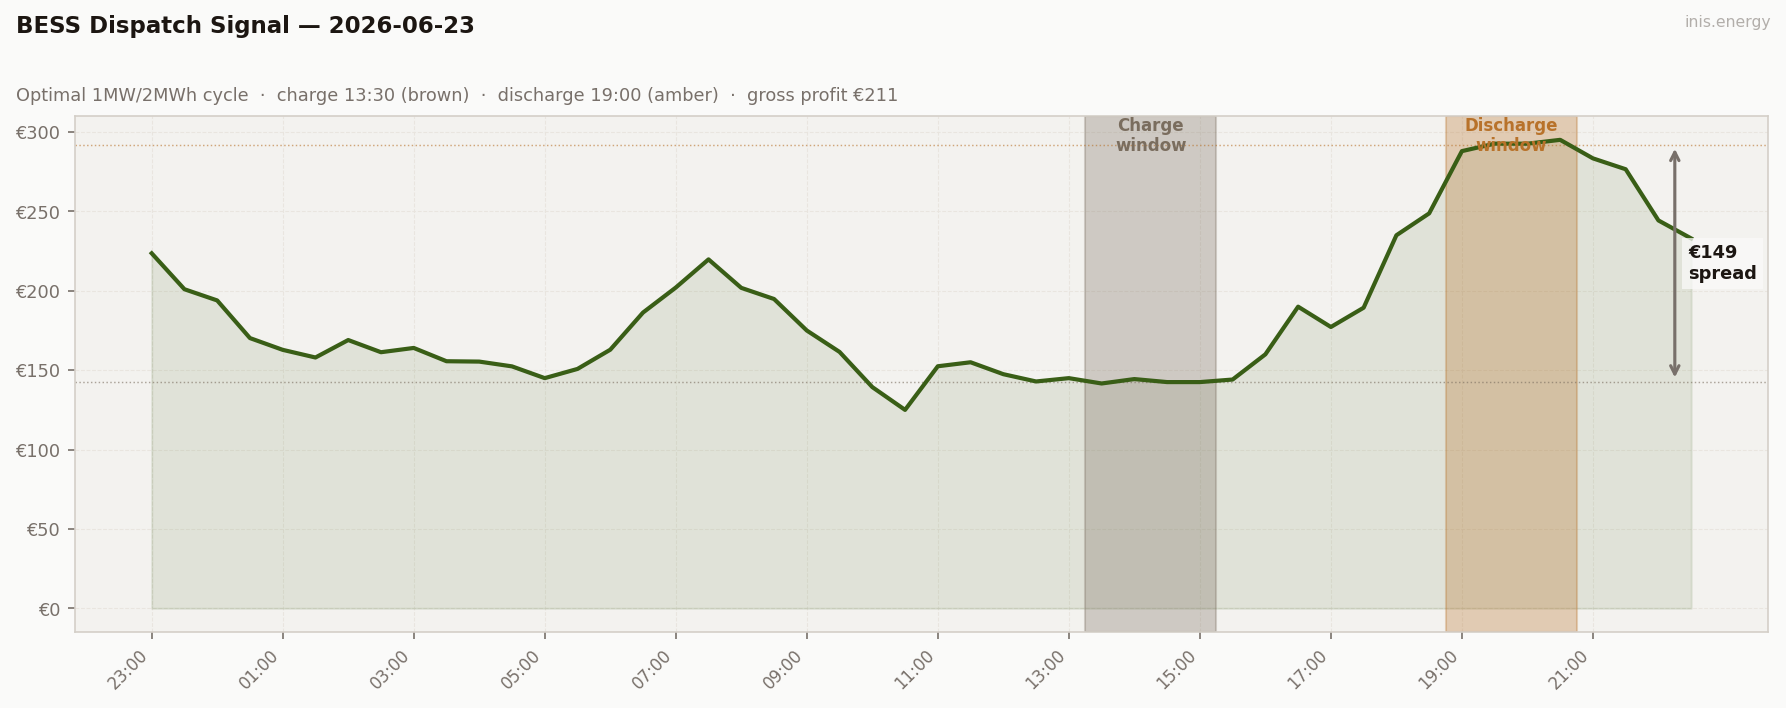
Best BESS day of the week by a wide margin. Charge at €143 at 13:30 — right in the midday wind window with wind at 9.5% and prices in the €141-145 range. Discharge at €292 at 19:00 as the scarcity spike was underway. €211 gross, ROI 73.9%. The midday wind pulse created the charge window; the evening scarcity created the premium. A €149 spread (€143 charge → €292 discharge) is exceptional. This is the kind of day that makes the investment case for storage.
Commentary #
The week’s sharpest day. Mean of €187.42 — up €8 on Monday, and with a std dev of €48.64 that dwarfs anything else in the run. The €295.11 peak at 20:30 is the highest price in the blog’s history so far.
The price shape follows wind in three chapters. Act one: overnight near-zero (1.4-5%), keeping prices in the €152-224 range all night — there was no cheap trough to start from. Act two: a midday reprieve as wind climbed to 10.9% by 14:30, pulling prices into the €125-145 range for about four hours. Act three: wind fell from 10.9% at 14:30 back to 4.4% at 20:30, right into peak Tuesday evening demand — and the market went into scarcity. €235 at 18:00, €288 at 19:00, €295 at 20:30. Gas couldn’t cover it at any price that mattered.
Storage had its best day of the week. Charge at €143 into the midday wind softness, discharge at €292 into the scarcity spike — €211 gross, ROI 73.9%. The wind needs to return; consumers are paying hard for its absence.
Half-hourly data — 2026-06-23
| Period | Time | Price (€/MWh) | Wind % |
|---|---|---|---|
| 1 | 23:00 | 223.64 | 5.8% |
| 2 | 23:30 | 201.00 | 6.0% |
| 3 | 00:00 | 193.94 | 4.8% |
| 4 | 00:30 | 170.23 | 3.9% |
| 5 | 01:00 | 162.82 | 3.6% |
| 6 | 01:30 | 158.00 | 3.5% |
| 7 | 02:00 | 169.00 | 2.8% |
| 8 | 02:30 | 161.33 | 2.5% |
| 9 | 03:00 | 164.02 | 1.9% |
| 10 | 03:30 | 155.65 | 1.8% |
| 11 | 04:00 | 155.42 | 1.4% |
| 12 | 04:30 | 152.41 | 2.1% |
| 13 | 05:00 | 145.00 | 2.5% |
| 14 | 05:30 | 150.80 | 2.9% |
| 15 | 06:00 | 162.91 | 2.6% |
| 16 | 06:30 | 186.32 | 2.5% |
| 17 | 07:00 | 202.06 | 2.4% |
| 18 | 07:30 | 219.80 | 2.1% |
| 19 | 08:00 | 201.86 | 1.9% |
| 20 | 08:30 | 194.85 | 2.1% |
| 21 | 09:00 | 175.00 | 2.2% |
| 22 | 09:30 | 161.51 | 2.5% |
| 23 | 10:00 | 139.36 | 3.0% |
| 24 | 10:30 | 125.00 | 3.3% |
| 25 | 11:00 | 152.48 | 3.7% |
| 26 | 11:30 | 155.00 | 4.9% |
| 27 | 12:00 | 147.49 | 4.7% |
| 28 | 12:30 | 142.90 | 6.2% |
| 29 | 13:00 | 145.00 | 7.3% |
| 30 | 13:30 | 141.63 | 9.5% |
| 31 | 14:00 | 144.41 | 9.8% |
| 32 | 14:30 | 142.51 | 10.9% |
| 33 | 15:00 | 142.51 | 10.7% |
| 34 | 15:30 | 144.12 | 9.6% |
| 35 | 16:00 | 160.00 | 9.5% |
| 36 | 16:30 | 190.01 | 9.1% |
| 37 | 17:00 | 177.22 | 8.8% |
| 38 | 17:30 | 189.37 | 8.3% |
| 39 | 18:00 | 235.00 | 7.9% |
| 40 | 18:30 | 248.78 | 6.9% |
| 41 | 19:00 | 288.00 | 5.8% |
| 42 | 19:30 | 292.70 | 5.2% |
| 43 | 20:00 | 292.68 | 4.6% |
| 44 | 20:30 | 295.11 | 4.4% |
| 45 | 21:00 | 283.44 | 5.2% |
| 46 | 21:30 | 276.59 | 5.7% |
| 47 | 22:00 | 244.34 | 5.8% |
| 48 | 22:30 | 233.00 | 5.9% |
Compare your business electricity and gas rates in minutes with INIS Energy Brokers.
Compare rates