I-SEM Daily Briefing — 26 June 2026
Table of Contents
Market Snapshot
| Metric | Value |
|---|---|
| Mean DAM Price | €143.99/MWh |
| Median Price | €129.93/MWh |
| Std Dev | €33.68/MWh |
| Peak Price | €208.94/MWh (19:00) |
| Min Price | €103.11/MWh (13:30) |
| Price Range | €105.83/MWh |
| Periods above €150 | 19 of 48 (40%) |
| Periods above €200 | 5 of 48 (10%) |
| Peak Avg (07–22) | €147.71/MWh |
| Off-peak Avg (22–07) | €137.78/MWh |
| Peak/Off-Peak Spread | €9.93/MWh |
| Wind % of Demand | 26.4% |
| Wind Range | 14.2%–51.0% |
| Mean Demand | 3927 MW |
Price Profile #
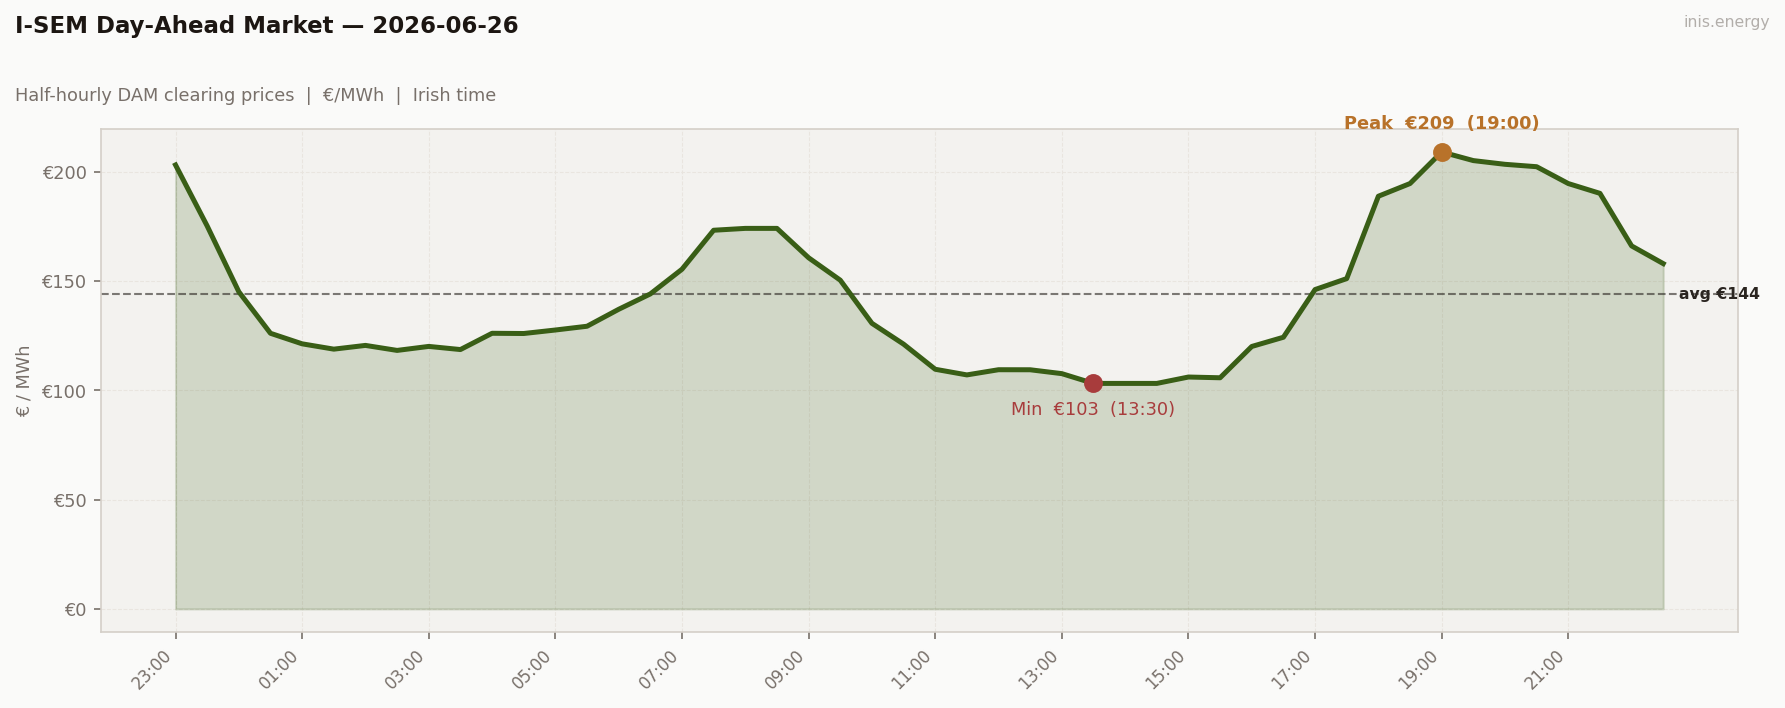
Std dev €33.68/MWh · Median €129.93/MWh · Periods above €150: 19 of 48 (40%)
Same shape as Wednesday/Thursday, just €5 cheaper. Thursday’s scarcity tail dragged the open up to €203, wind chopped the afternoon down to a €103 floor, then evening demand muscled through anyway for a €209 peak.
Price vs Wind #
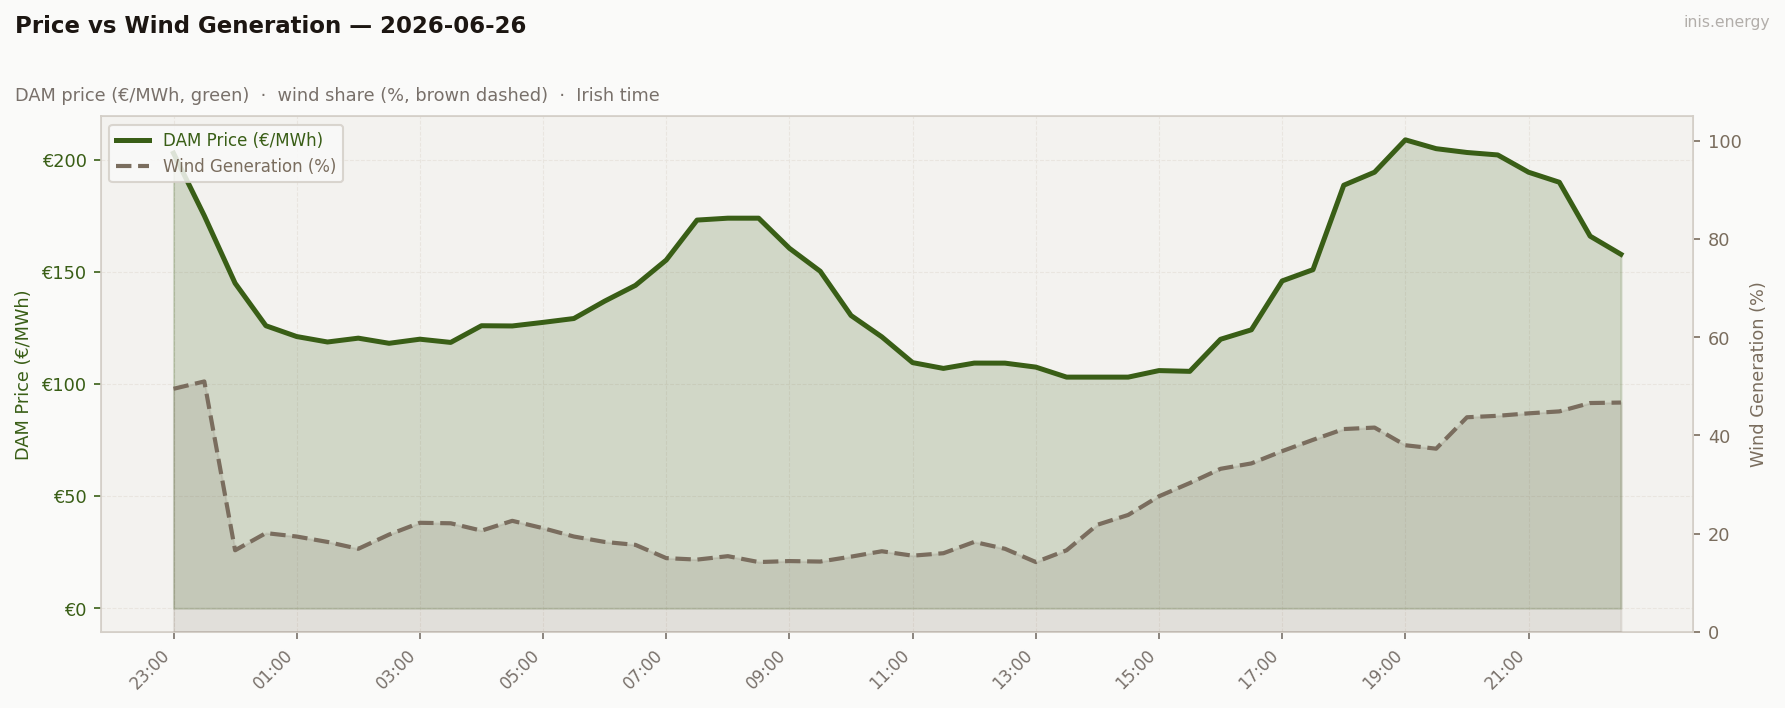
Mean wind: 26.4% · Range: 14.2%–51.0%
Wind wasn’t really the story today — demand was. It sat in the high-30s/low-40s through the evening ramp, normally enough to cap price, but Friday demand pushed through it regardless. €209 with 38% wind on the system is a demand story, not a supply one.
Week in Context #
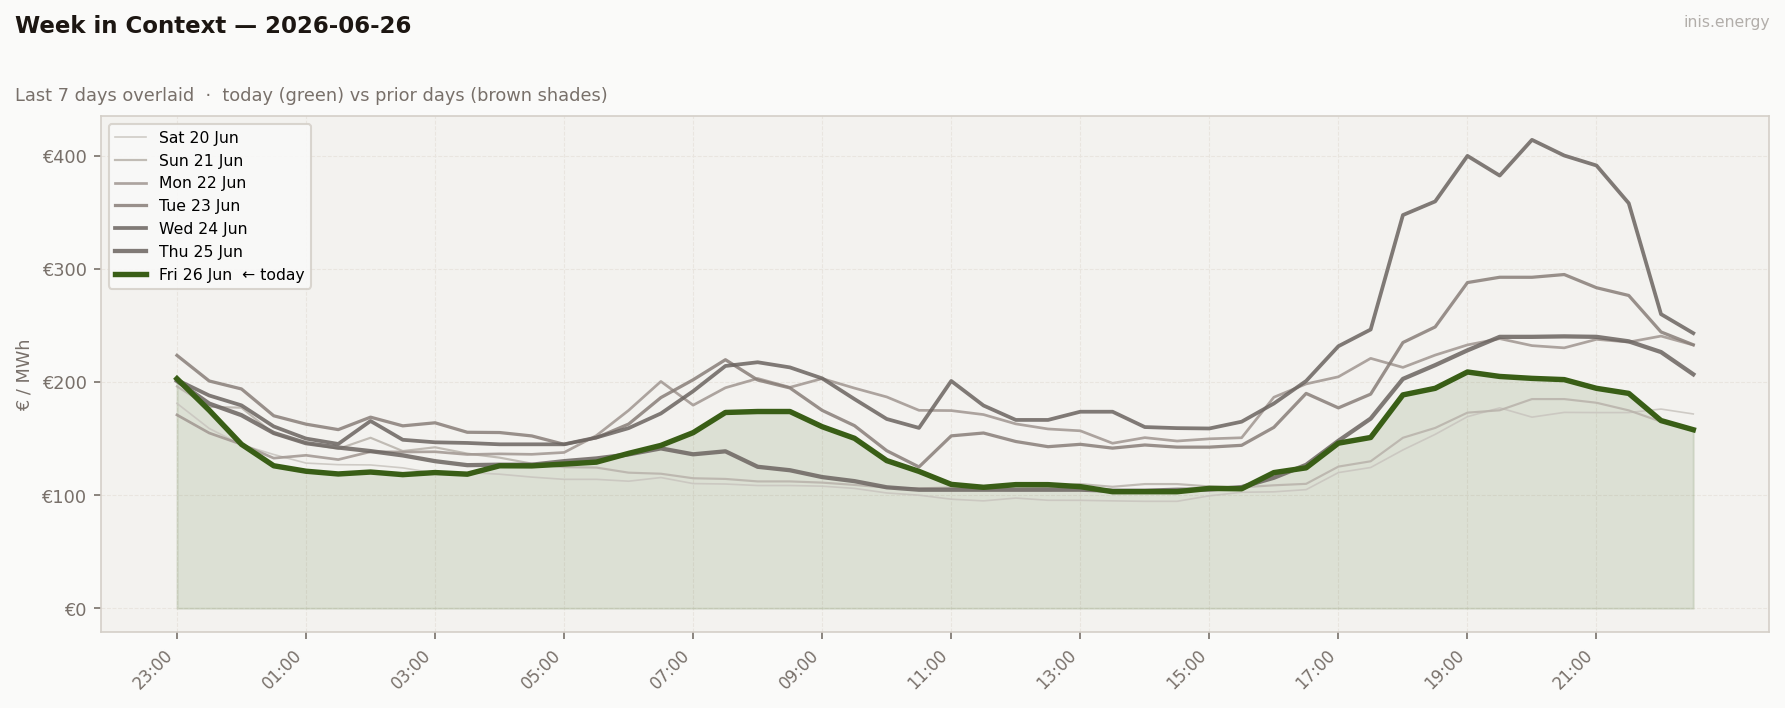
Third day easing off Wednesday’s scarcity spike — the week’s average is trending down.
Price Duration Curve #
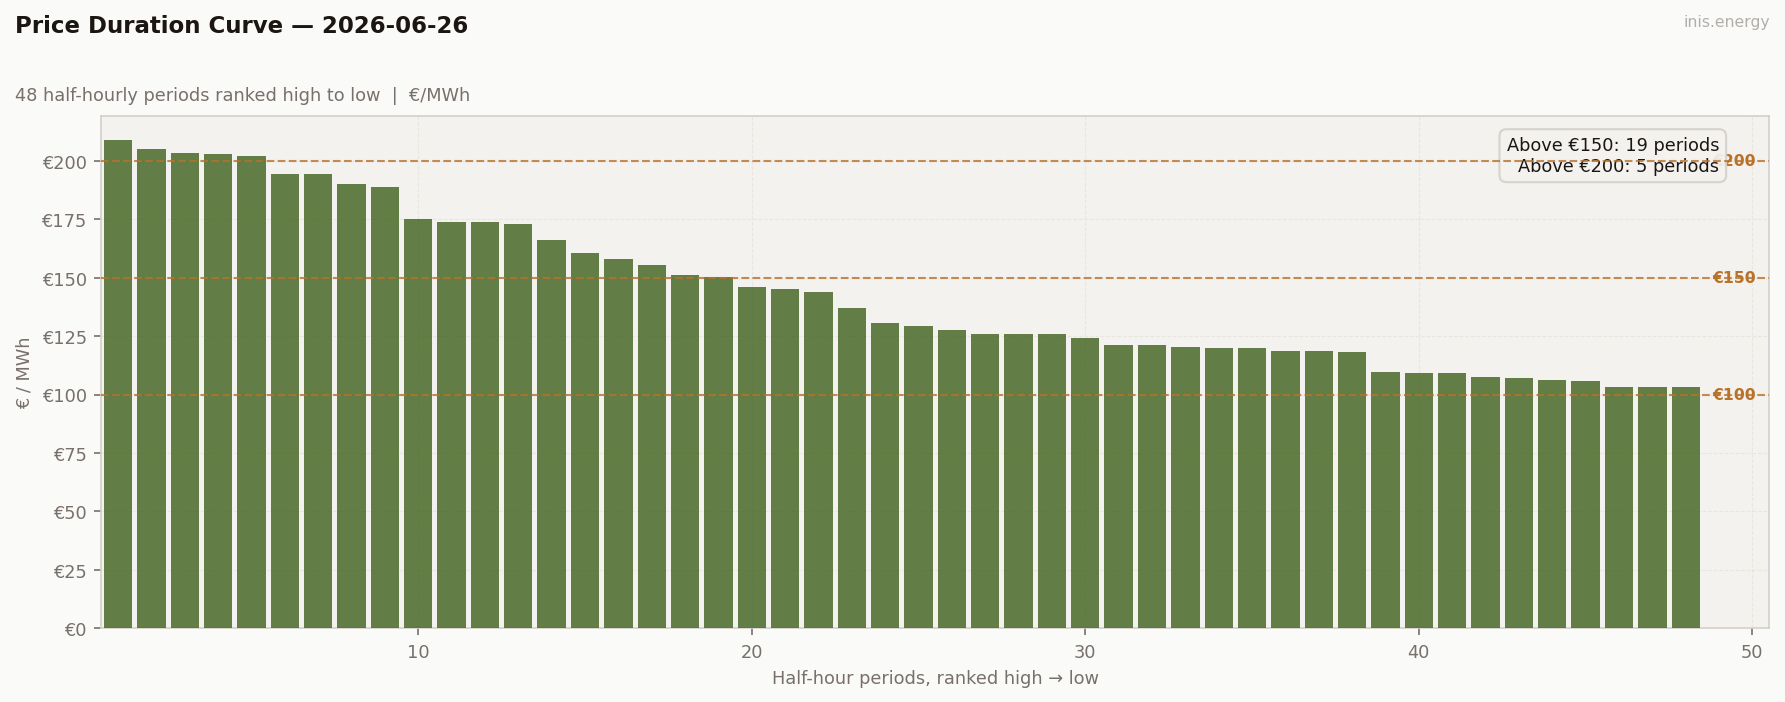
Periods above €150: 19 (40% of day) · Above €200: 5 (10% of day)
Shorter, less severe spike than Thursday’s — the ceiling is coming down.
Peak / Off-Peak Spread #
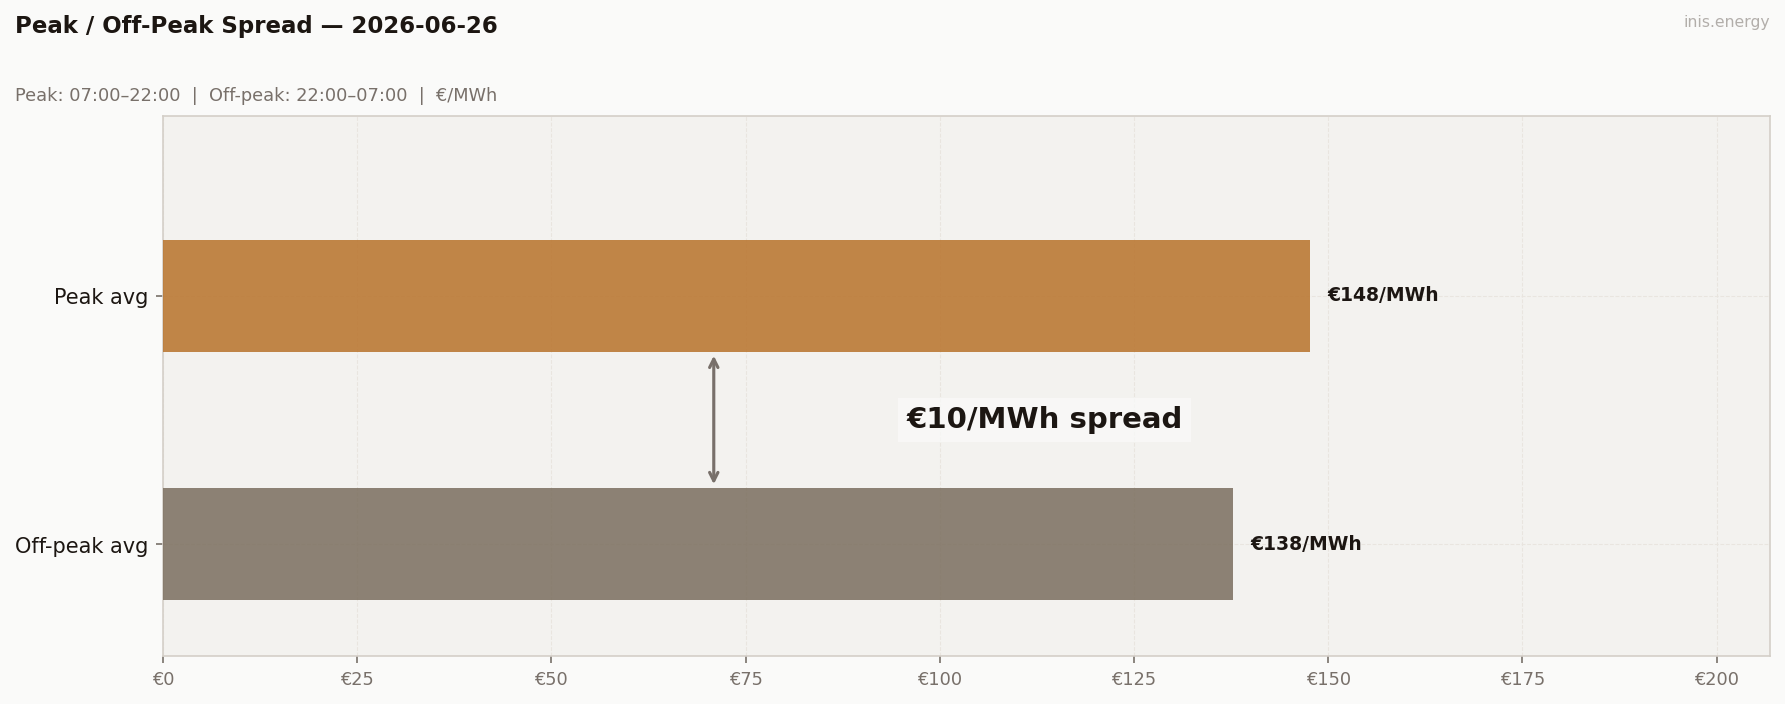
Peak avg (07:00–22:00): €147.71/MWh · Off-peak avg: €137.78/MWh · Spread: €9.93/MWh
Modest, ordinary positive spread. Nothing unusual about Friday’s shape.
BESS Dispatch Signal #
| Price | Time | Energy | Value | |
|---|---|---|---|---|
| Charge | €104/MWh | 13:30 | 2 MWh | −€208 |
| Discharge | €205/MWh | 19:00 | 1.7 MWh (85% RTE) | +€348 |
| Gross profit | €141 | |||
| Price spread | €101/MWh | ROI: 67.7% |
Simulated 1MW/2MWh battery, one optimal DAM cycle. Gross before network charges and capacity costs.
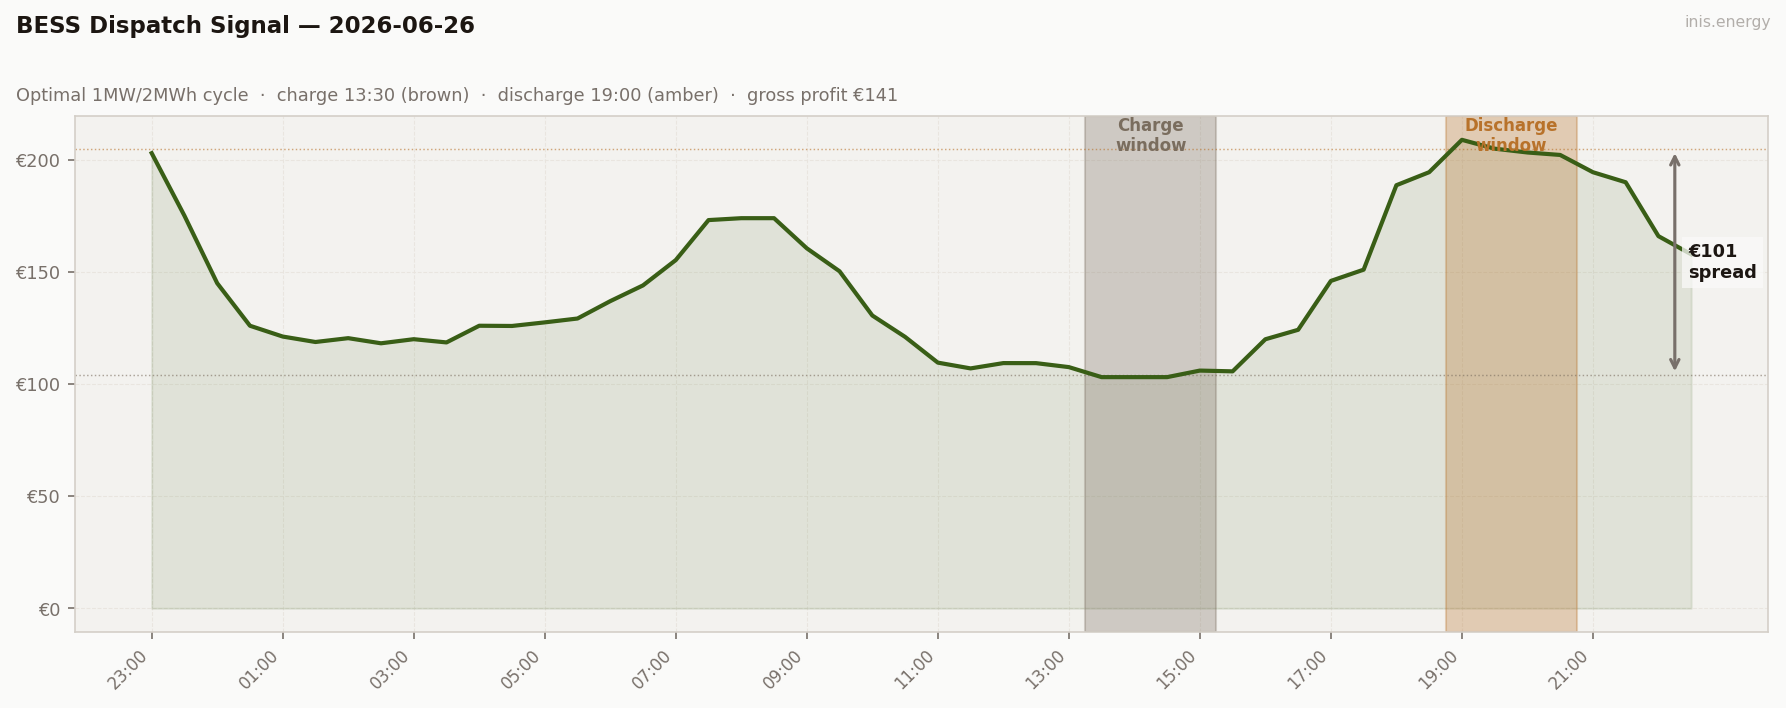
€141 gross, decent but not spectacular. Charge at the €103 midday floor, discharge into the evening ramp — a repeatable, ordinary storage day.
Commentary #
Second day in a row where wind knocked the roof off prices without wrecking the floor. Thursday’s mean was €149, today €144 — both riding the same wind arc, both giving storage a thin but workable spread.
Wind averaged only the mid-20s today, nothing unusual. The bigger story is what’s coming: the weekend forecast has wind going much higher, and this looks like the last “normal” day before the glut arrives.
Half-hourly data — 2026-06-26
| Period | Time | Price (€/MWh) | Wind % |
|---|---|---|---|
| 1 | 23:00 | 203.00 | 49.5% |
| 2 | 23:30 | 175.10 | 51.0% |
| 3 | 00:00 | 145.00 | 16.6% |
| 4 | 00:30 | 126.03 | 20.1% |
| 5 | 01:00 | 121.21 | 19.4% |
| 6 | 01:30 | 118.78 | 18.3% |
| 7 | 02:00 | 120.49 | 16.9% |
| 8 | 02:30 | 118.20 | 19.8% |
| 9 | 03:00 | 120.03 | 22.2% |
| 10 | 03:30 | 118.59 | 22.1% |
| 11 | 04:00 | 126.03 | 20.6% |
| 12 | 04:30 | 125.93 | 22.6% |
| 13 | 05:00 | 127.53 | 21.1% |
| 14 | 05:30 | 129.25 | 19.4% |
| 15 | 06:00 | 137.00 | 18.3% |
| 16 | 06:30 | 144.03 | 17.7% |
| 17 | 07:00 | 155.32 | 15.0% |
| 18 | 07:30 | 173.15 | 14.7% |
| 19 | 08:00 | 174.00 | 15.4% |
| 20 | 08:30 | 174.00 | 14.2% |
| 21 | 09:00 | 160.57 | 14.4% |
| 22 | 09:30 | 150.32 | 14.3% |
| 23 | 10:00 | 130.60 | 15.3% |
| 24 | 10:30 | 121.07 | 16.4% |
| 25 | 11:00 | 109.58 | 15.5% |
| 26 | 11:30 | 107.00 | 16.0% |
| 27 | 12:00 | 109.37 | 18.3% |
| 28 | 12:30 | 109.35 | 16.9% |
| 29 | 13:00 | 107.58 | 14.2% |
| 30 | 13:30 | 103.11 | 16.6% |
| 31 | 14:00 | 103.11 | 21.8% |
| 32 | 14:30 | 103.11 | 23.8% |
| 33 | 15:00 | 106.03 | 27.6% |
| 34 | 15:30 | 105.69 | 30.3% |
| 35 | 16:00 | 120.00 | 33.2% |
| 36 | 16:30 | 124.22 | 34.3% |
| 37 | 17:00 | 146.02 | 36.8% |
| 38 | 17:30 | 151.04 | 39.1% |
| 39 | 18:00 | 188.70 | 41.3% |
| 40 | 18:30 | 194.51 | 41.6% |
| 41 | 19:00 | 208.94 | 38.0% |
| 42 | 19:30 | 205.00 | 37.3% |
| 43 | 20:00 | 203.30 | 43.7% |
| 44 | 20:30 | 202.20 | 44.0% |
| 45 | 21:00 | 194.50 | 44.5% |
| 46 | 21:30 | 190.02 | 44.9% |
| 47 | 22:00 | 165.99 | 46.6% |
| 48 | 22:30 | 157.89 | 46.7% |
Compare your business electricity and gas rates in minutes with INIS Energy Brokers.
Compare rates