I-SEM Daily Briefing — 27 June 2026
Table of Contents
Market Snapshot
| Metric | Value |
|---|---|
| Mean DAM Price | €96.41/MWh |
| Median Price | €109.47/MWh |
| Std Dev | €40.54/MWh |
| Peak Price | €148.24/MWh (21:00) |
| Min Price | €23.18/MWh (13:30) |
| Price Range | €125.06/MWh |
| Periods above €150 | 0 of 48 (0%) |
| Periods above €200 | 0 of 48 (0%) |
| Peak Avg (07–22) | €83.48/MWh |
| Off-peak Avg (22–07) | €117.95/MWh |
| Peak/Off-Peak Spread | €-34.47/MWh |
| Wind % of Demand | 54.0% |
| Wind Range | 42.6%–61.6% |
| Mean Demand | 3637 MW |
Price Profile #
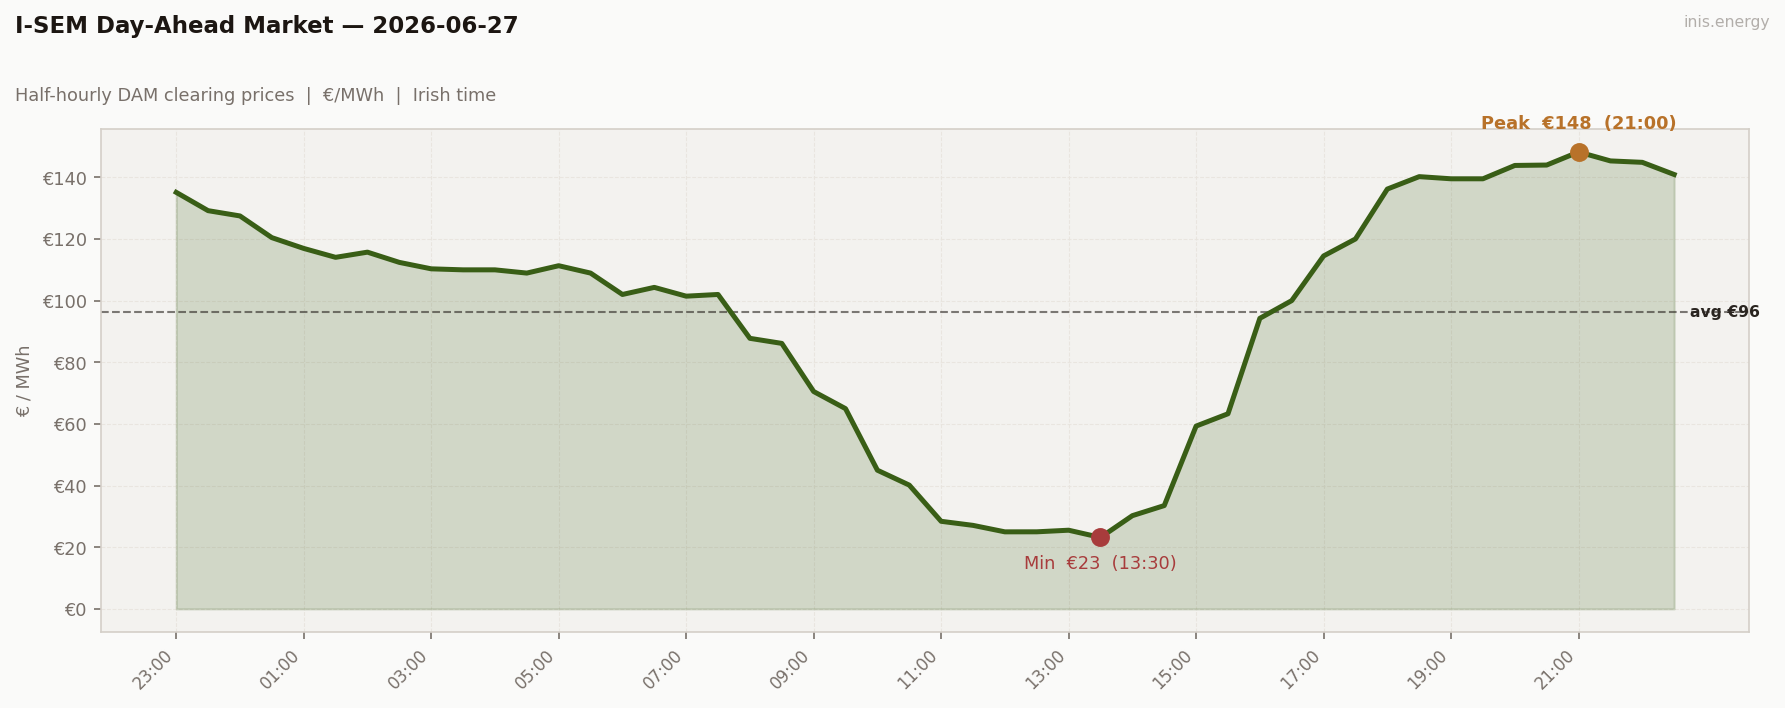
Std dev €40.54/MWh · Median €109.47/MWh · Periods above €150: 0 of 48 (0%)
Wind hit 54% average — the highest run of the week — and the floor fell out from under the market. €23 at 13:30, a mean of just €96, down €48 on Friday.
Price vs Wind #
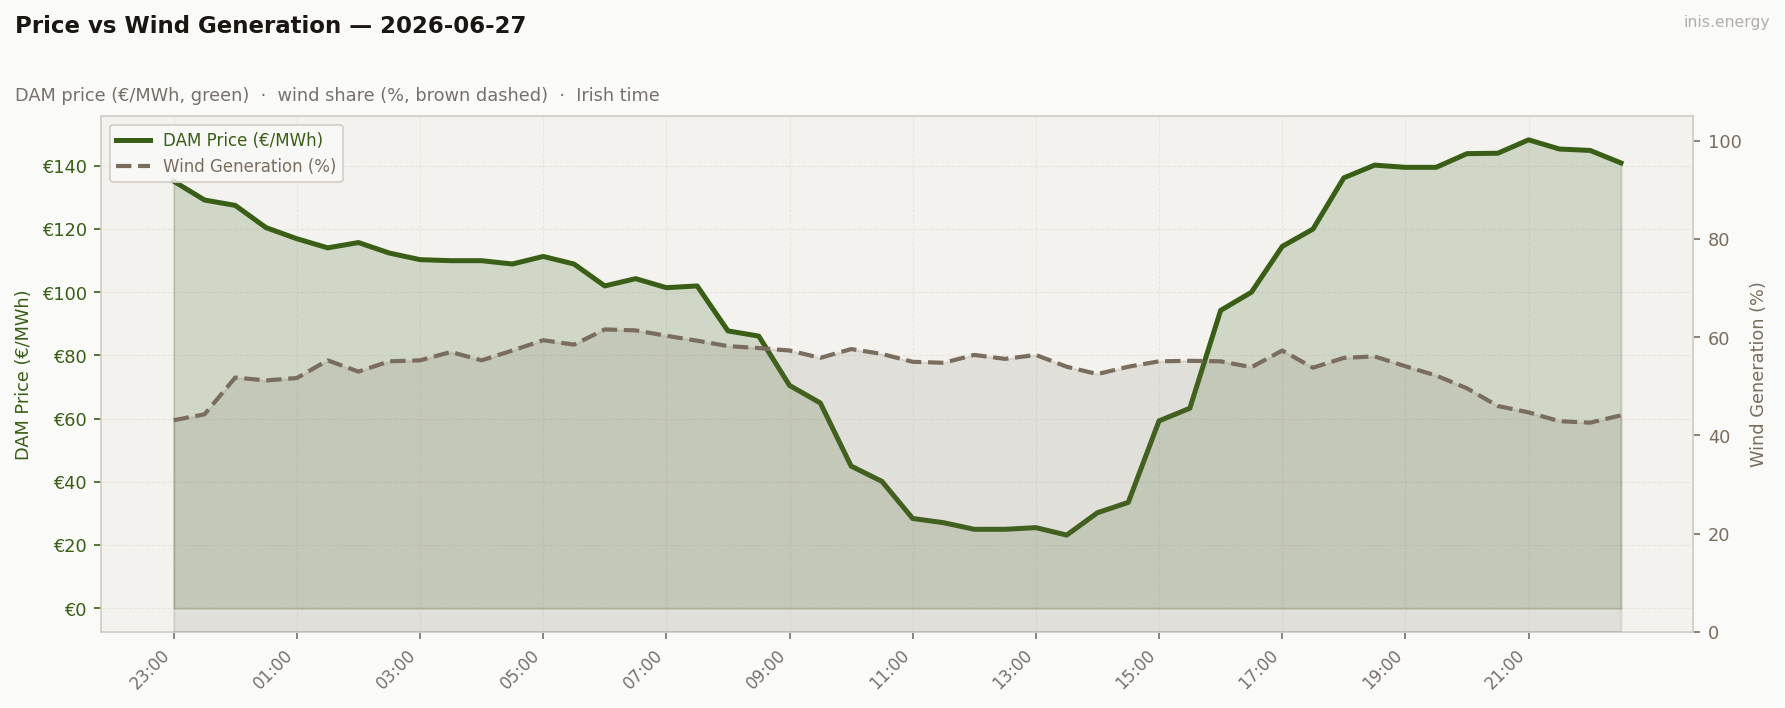
Mean wind: 54.0% · Range: 42.6%–61.6%
Wind sat above 50% almost all day. Classic cannibalisation — the more wind on the system, the less any of it is worth. Midday, with wind at 55-57%, price cratered into the €20s-30s.
Week in Context #
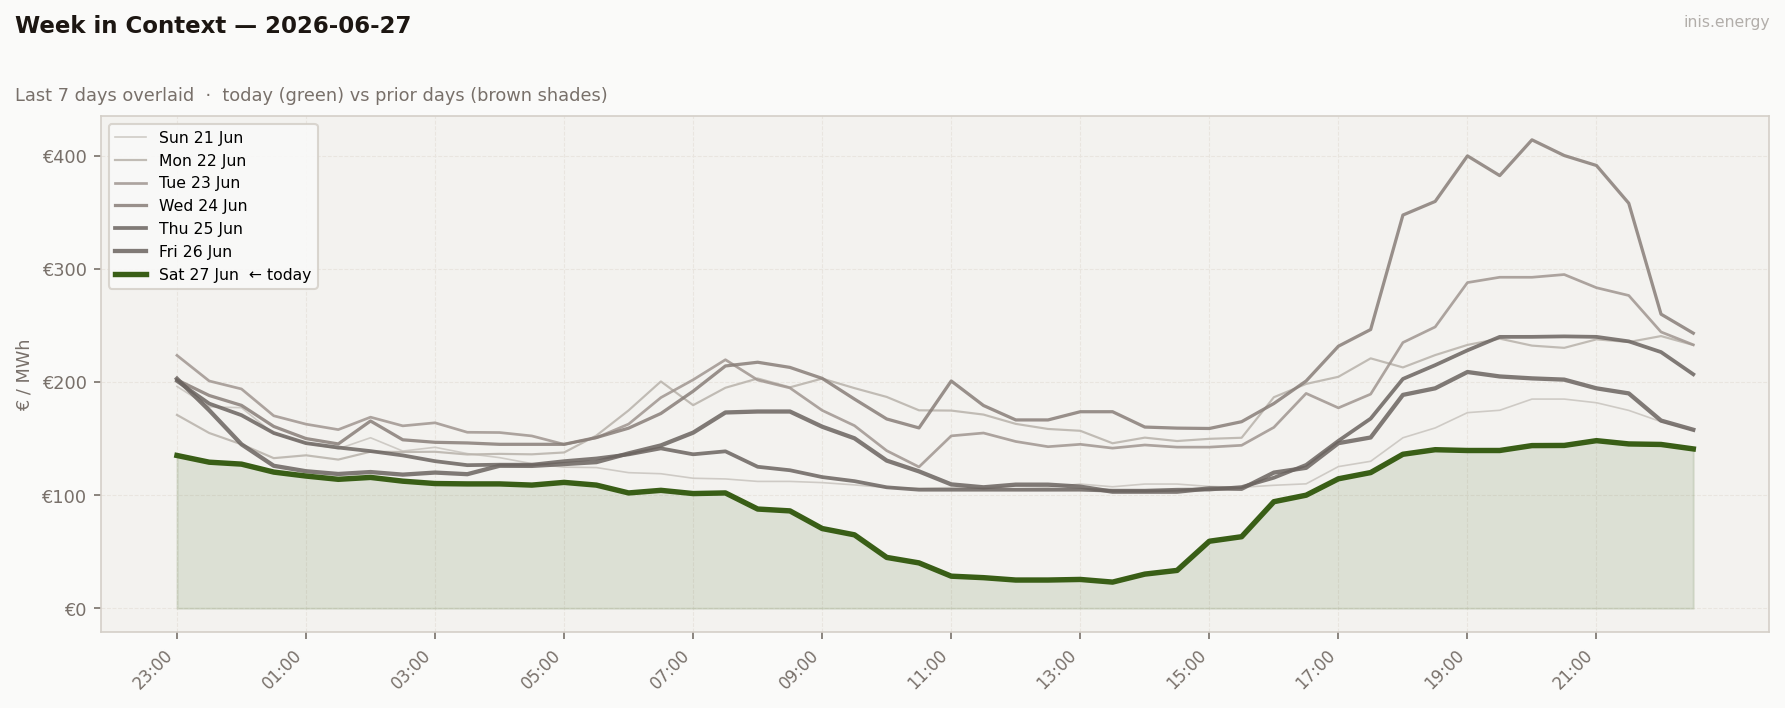
The week just fell off a cliff — Saturday’s €96 mean is the cheapest day since the last wind glut.
Price Duration Curve #
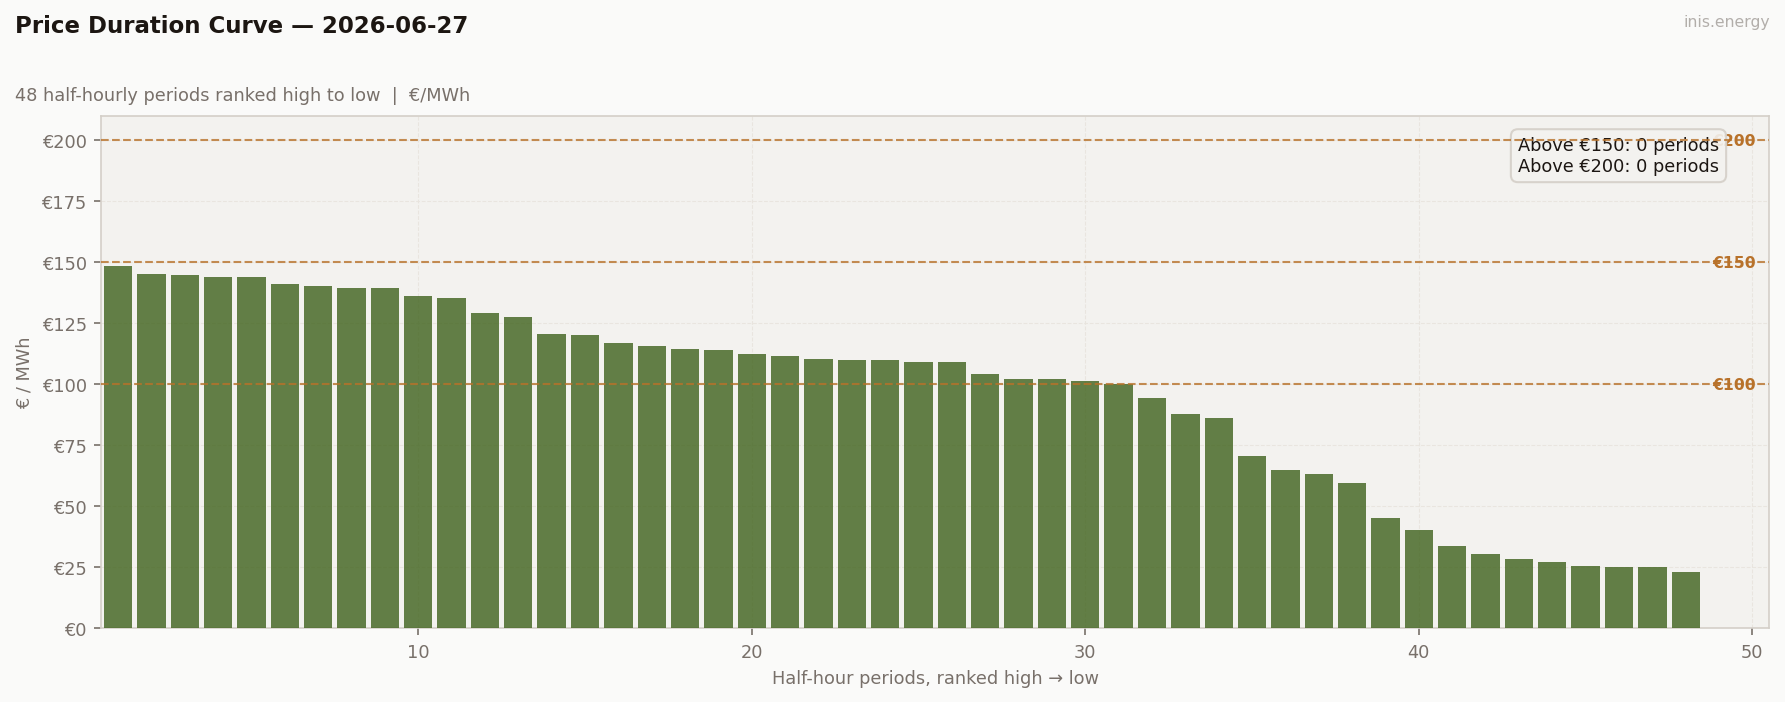
Periods above €150: 0 (0% of day) · Above €200: 0 (0% of day)
Flat and cheap. First day all week with no ceiling at all — nothing near a scarcity price.
Peak / Off-Peak Spread #
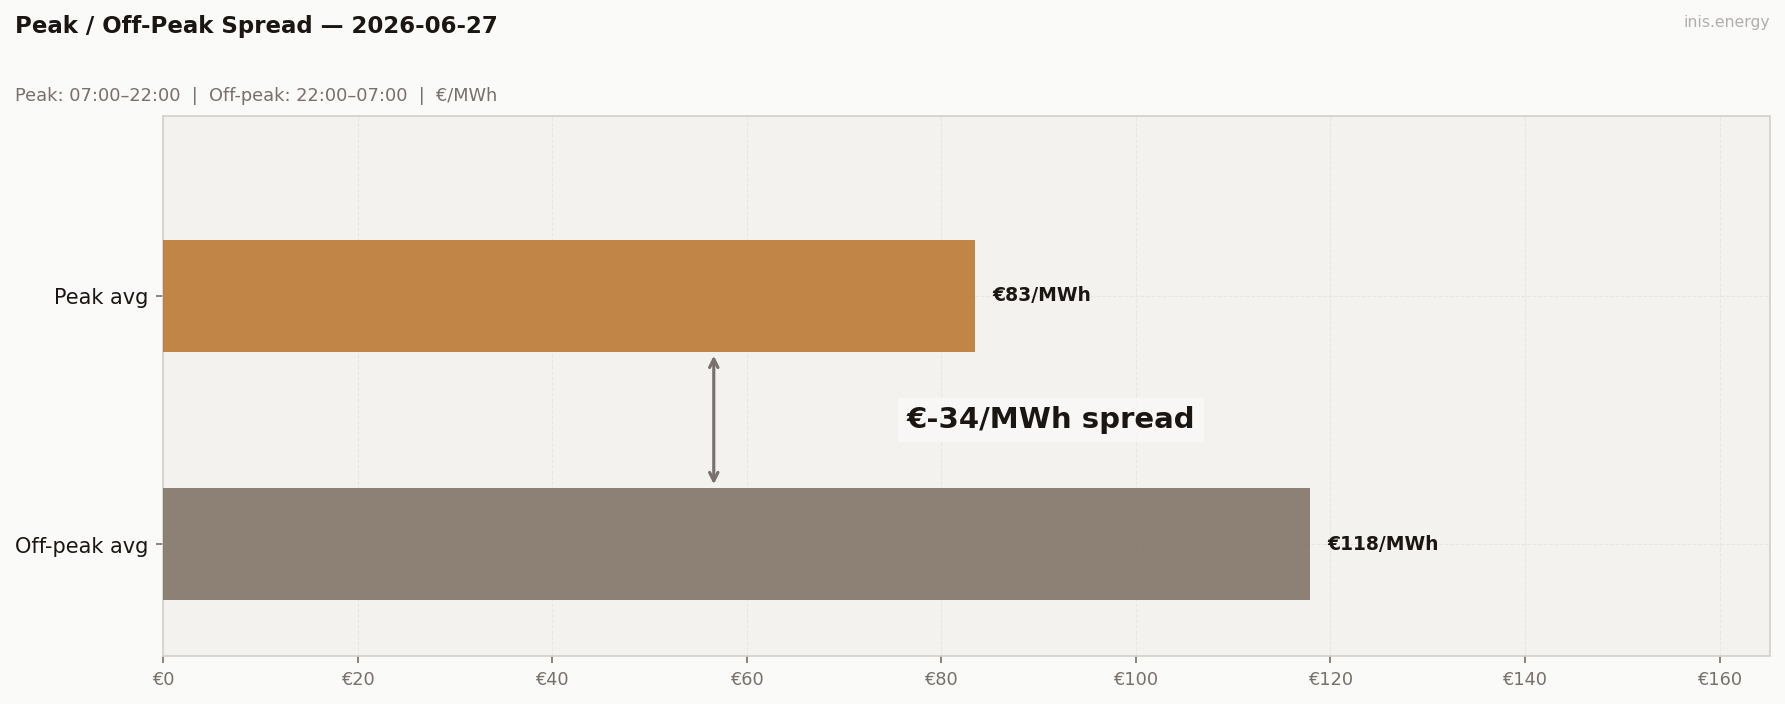
Peak avg (07:00–22:00): €83.48/MWh · Off-peak avg: €117.95/MWh · Spread: €-34.47/MWh
Spread flipped negative. Daytime wind crushed the traditional peak completely, and weekend demand (mean 3637MW) wasn’t there to fight back.
BESS Dispatch Signal #
| Price | Time | Energy | Value | |
|---|---|---|---|---|
| Charge | €25/MWh | 12:00 | 2 MWh | −€49 |
| Discharge | €146/MWh | 20:30 | 1.7 MWh (85% RTE) | +€248 |
| Gross profit | €198 | |||
| Price spread | €121/MWh | ROI: 401.5% |
Simulated 1MW/2MWh battery, one optimal DAM cycle. Gross before network charges and capacity costs.
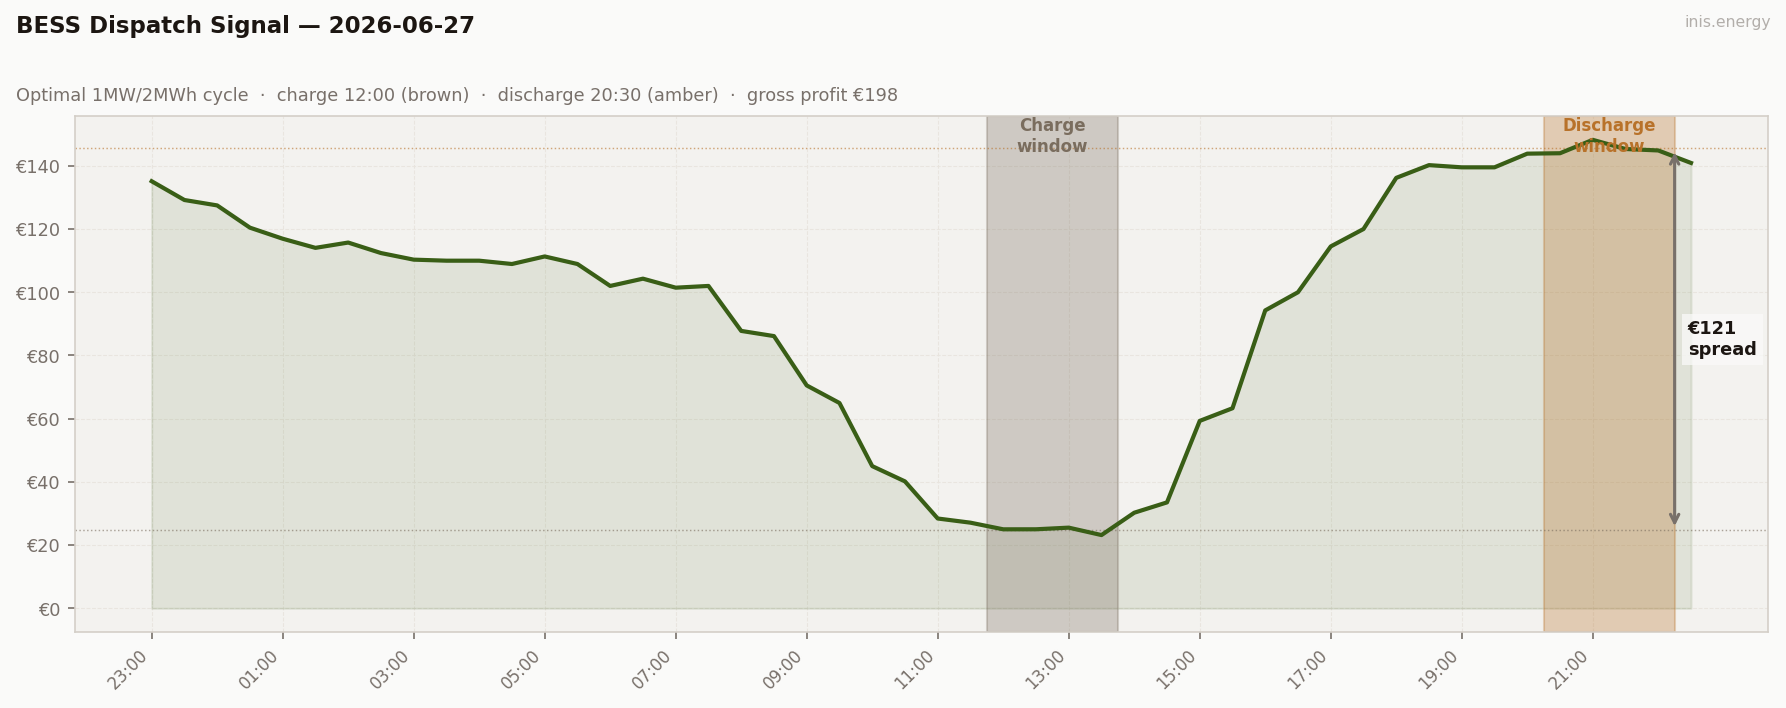
Best BESS day of the week by ROI — 401%. Charge next to nothing (€25) at midday, discharge into a modest €146 evening peak. Cheap charge, not a big discharge — a pure volatility play.
Commentary #
Saturday broke the pattern. Wind at 54% average buried the midday market — €23/MWh at 13:30, cheaper than most nights this week. No period cleared €150, a completely different animal to the €200+ ceilings on Wednesday and Thursday.
This is what an oversupplied grid looks like: demand fell to a weekend low (3637MW) right as wind peaked, and the merit order had nowhere to put the extra generation except at giveaway prices. Great for consumers, brutal for wind operators getting paid €25/MWh for their own output.
Half-hourly data — 2026-06-27
| Period | Time | Price (€/MWh) | Wind % |
|---|---|---|---|
| 1 | 23:00 | 135.14 | 43.1% |
| 2 | 23:30 | 129.20 | 44.3% |
| 3 | 00:00 | 127.49 | 51.8% |
| 4 | 00:30 | 120.45 | 51.2% |
| 5 | 01:00 | 116.95 | 51.7% |
| 6 | 01:30 | 114.06 | 55.3% |
| 7 | 02:00 | 115.74 | 53.0% |
| 8 | 02:30 | 112.42 | 55.1% |
| 9 | 03:00 | 110.33 | 55.3% |
| 10 | 03:30 | 110.00 | 57.0% |
| 11 | 04:00 | 110.00 | 55.3% |
| 12 | 04:30 | 108.95 | 57.3% |
| 13 | 05:00 | 111.34 | 59.4% |
| 14 | 05:30 | 108.95 | 58.5% |
| 15 | 06:00 | 102.01 | 61.6% |
| 16 | 06:30 | 104.31 | 61.4% |
| 17 | 07:00 | 101.46 | 60.3% |
| 18 | 07:30 | 102.01 | 59.3% |
| 19 | 08:00 | 87.78 | 58.2% |
| 20 | 08:30 | 86.14 | 57.8% |
| 21 | 09:00 | 70.53 | 57.3% |
| 22 | 09:30 | 64.97 | 55.8% |
| 23 | 10:00 | 45.00 | 57.6% |
| 24 | 10:30 | 40.16 | 56.6% |
| 25 | 11:00 | 28.42 | 55.0% |
| 26 | 11:30 | 27.10 | 54.8% |
| 27 | 12:00 | 25.00 | 56.4% |
| 28 | 12:30 | 25.01 | 55.6% |
| 29 | 13:00 | 25.53 | 56.4% |
| 30 | 13:30 | 23.18 | 54.0% |
| 31 | 14:00 | 30.25 | 52.5% |
| 32 | 14:30 | 33.52 | 54.0% |
| 33 | 15:00 | 59.31 | 55.1% |
| 34 | 15:30 | 63.31 | 55.2% |
| 35 | 16:00 | 94.27 | 55.1% |
| 36 | 16:30 | 100.02 | 53.9% |
| 37 | 17:00 | 114.51 | 57.3% |
| 38 | 17:30 | 120.02 | 53.8% |
| 39 | 18:00 | 136.21 | 55.8% |
| 40 | 18:30 | 140.24 | 56.1% |
| 41 | 19:00 | 139.54 | 54.1% |
| 42 | 19:30 | 139.54 | 52.2% |
| 43 | 20:00 | 143.87 | 49.6% |
| 44 | 20:30 | 144.00 | 46.0% |
| 45 | 21:00 | 148.24 | 44.7% |
| 46 | 21:30 | 145.34 | 42.9% |
| 47 | 22:00 | 144.88 | 42.6% |
| 48 | 22:30 | 140.93 | 44.1% |
Compare your business electricity and gas rates in minutes with INIS Energy Brokers.
Compare rates