I-SEM Daily Briefing — 28 June 2026
Table of Contents
Market Snapshot
| Metric | Value |
|---|---|
| Mean DAM Price | €77.9/MWh |
| Median Price | €102.36/MWh |
| Std Dev | €49.48/MWh |
| Peak Price | €138.4/MWh (22:00) |
| Min Price | €5.29/MWh (12:00) |
| Price Range | €133.11/MWh |
| Periods above €150 | 0 of 48 (0%) |
| Periods above €200 | 0 of 48 (0%) |
| Peak Avg (07–22) | €53.74/MWh |
| Off-peak Avg (22–07) | €118.17/MWh |
| Peak/Off-Peak Spread | €-64.43/MWh |
| Wind % of Demand | 47.2% |
| Wind Range | 41.6%–55.6% |
| Mean Demand | 3302 MW |
Price Profile #
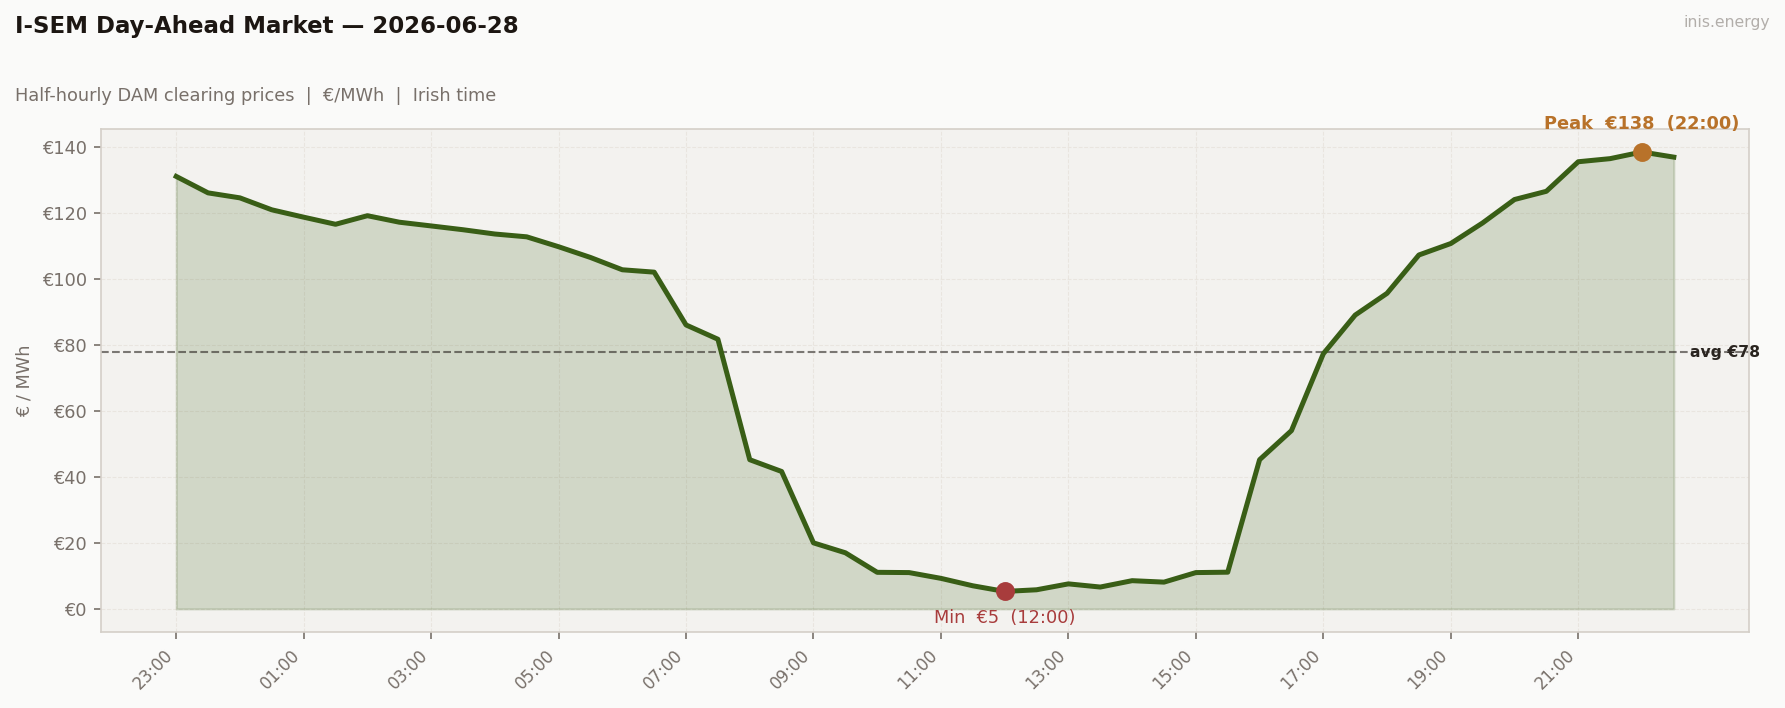
Std dev €49.48/MWh · Median €102.36/MWh · Periods above €150: 0 of 48 (0%)
Sunday went even further than Saturday. Mean €77.90, floor at €5.29 — barely above free. Wind stayed high (47%) but demand did the real damage: Sunday’s mean demand (3302MW) was the lowest of the week.
Price vs Wind #
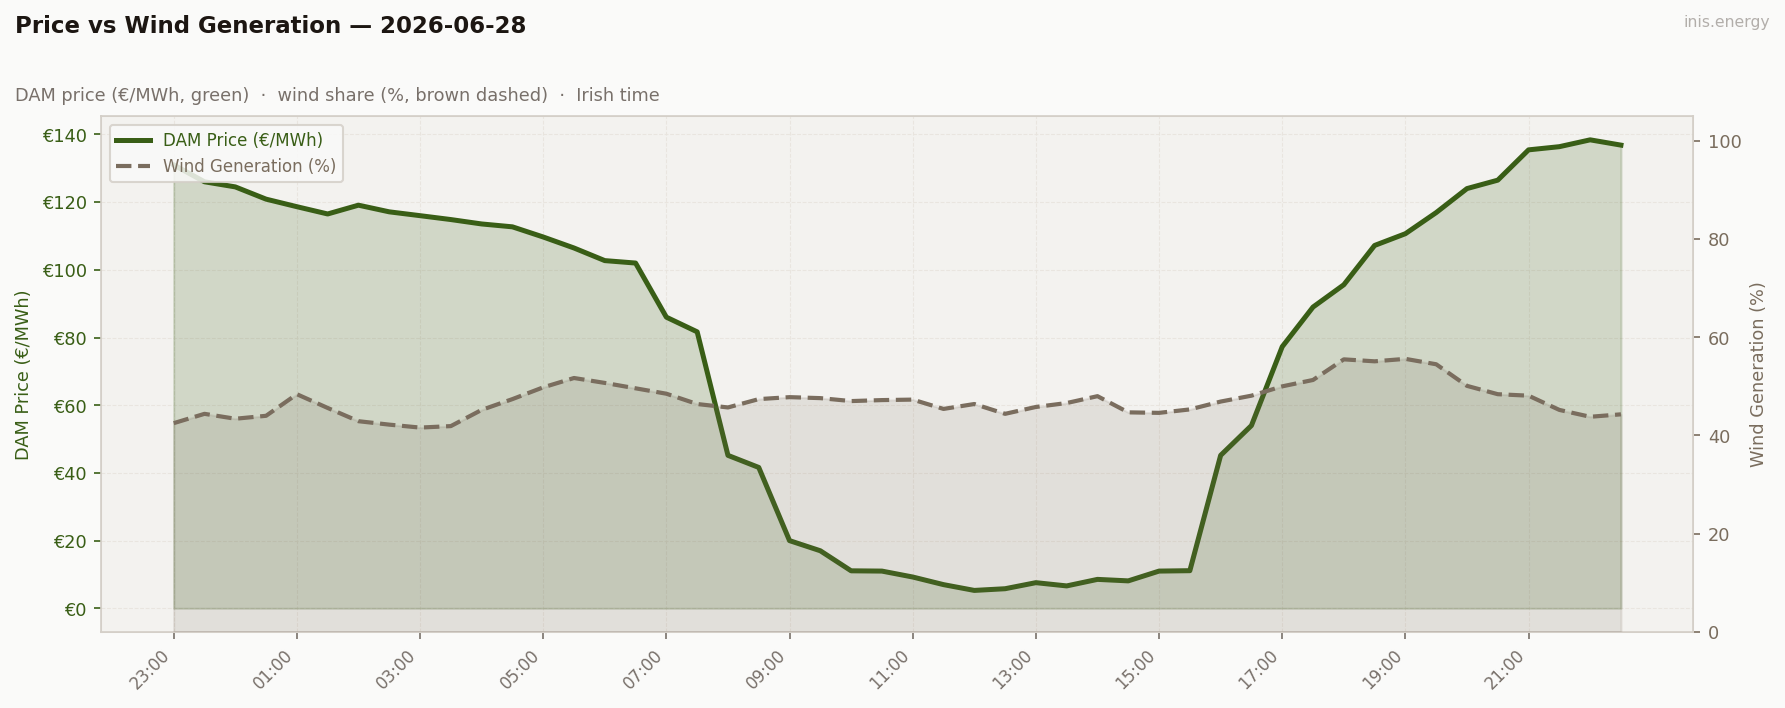
Mean wind: 47.2% · Range: 41.6%–55.6%
Wind held steady in the mid-40s all day, no big spikes or troughs. With demand this low, even moderate wind was enough to flatten the merit order onto the floor.
Week in Context #
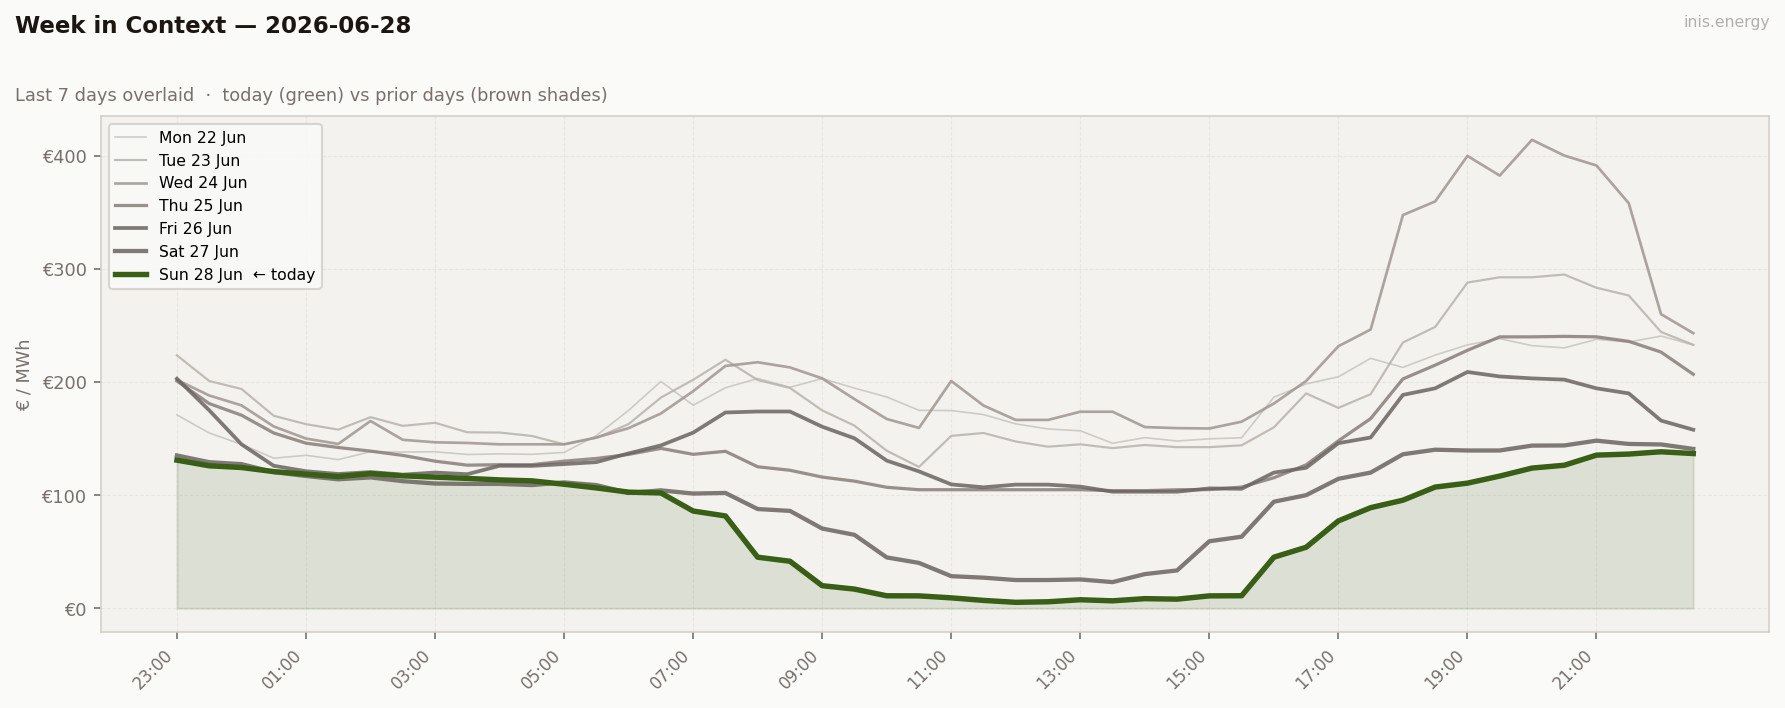
Two cheap days running — Sunday undercuts even Saturday, the low point of the week.
Price Duration Curve #
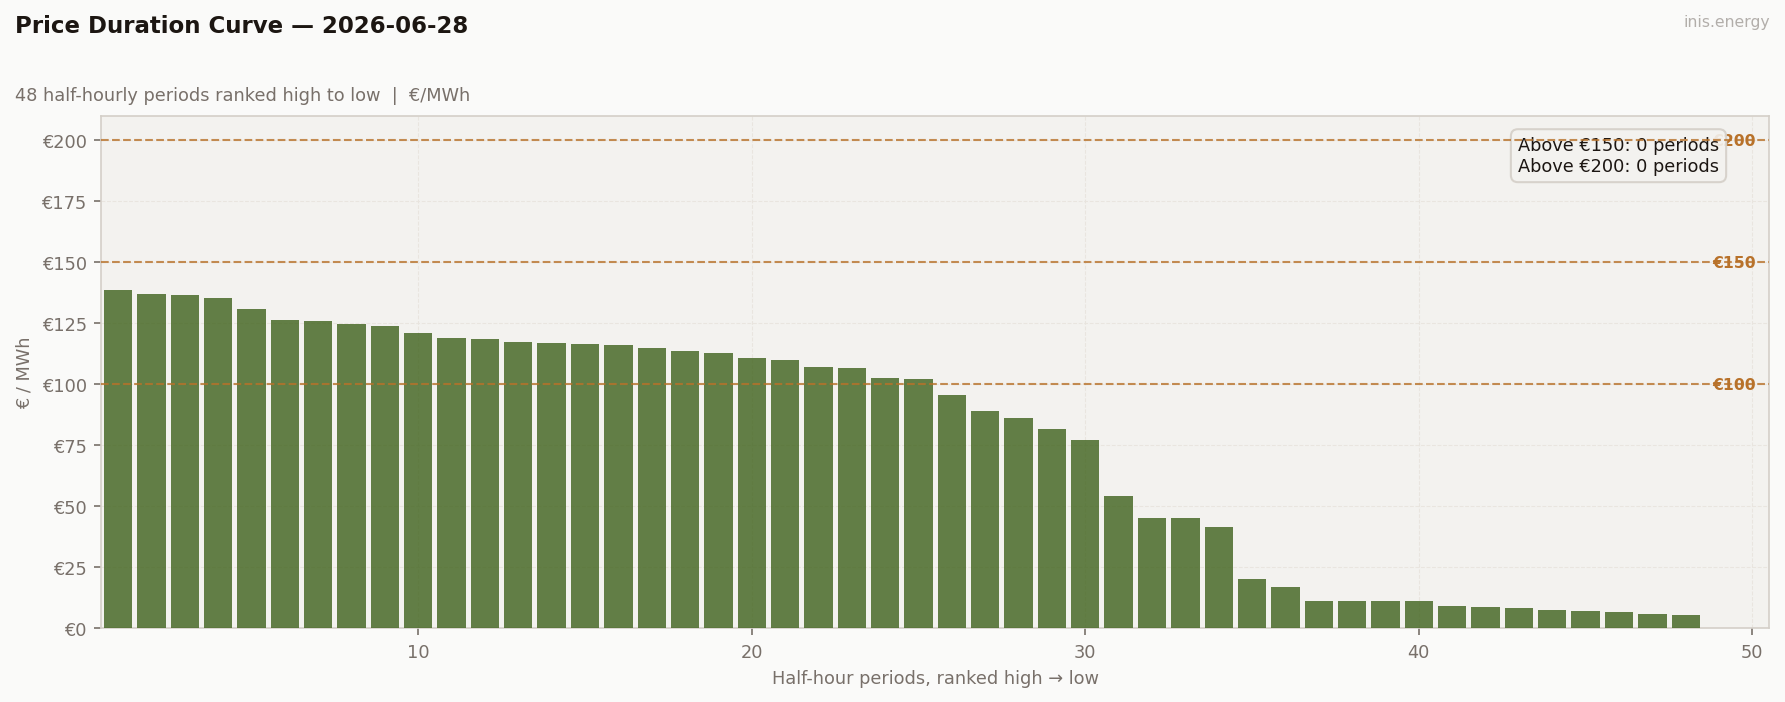
Periods above €150: 0 (0% of day) · Above €200: 0 (0% of day)
Flat and near-zero for most of the day — a full eight-hour stretch (09:00-16:00) under €12/MWh.
Peak / Off-Peak Spread #
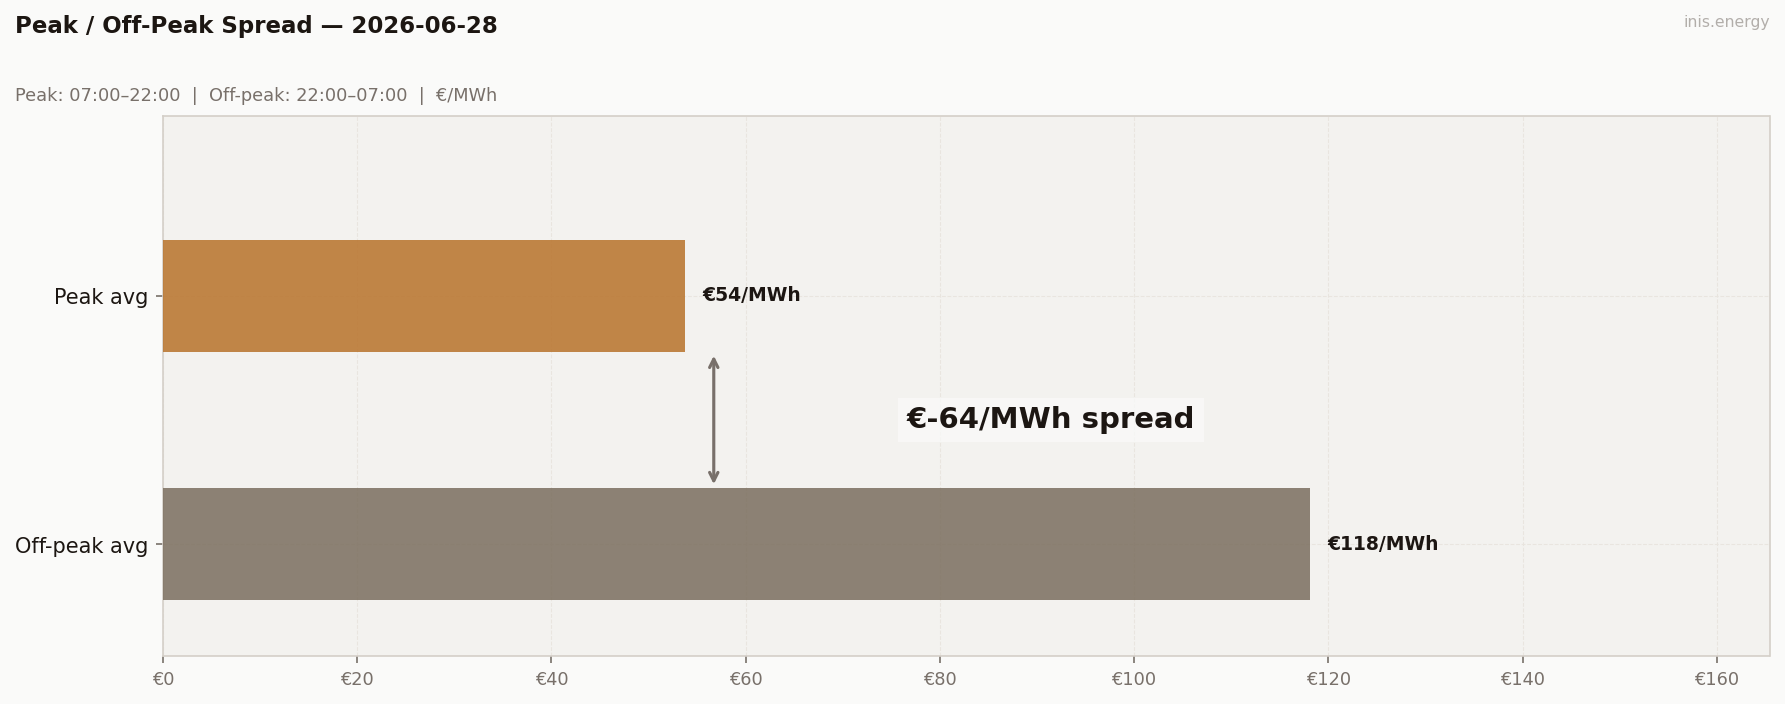
Peak avg (07:00–22:00): €53.74/MWh · Off-peak avg: €118.17/MWh · Spread: €-64.43/MWh
Deepest negative spread of the week. Sunday’s “peak” window collapsed below overnight levels — it wasn’t a peak at all.
BESS Dispatch Signal #
| Price | Time | Energy | Value | |
|---|---|---|---|---|
| Charge | €6/MWh | 12:00 | 2 MWh | −€13 |
| Discharge | €137/MWh | 21:00 | 1.7 MWh (85% RTE) | +€232 |
| Gross profit | €220 | |||
| Price spread | €130/MWh | ROI: 1739.4% |
Simulated 1MW/2MWh battery, one optimal DAM cycle. Gross before network charges and capacity costs.
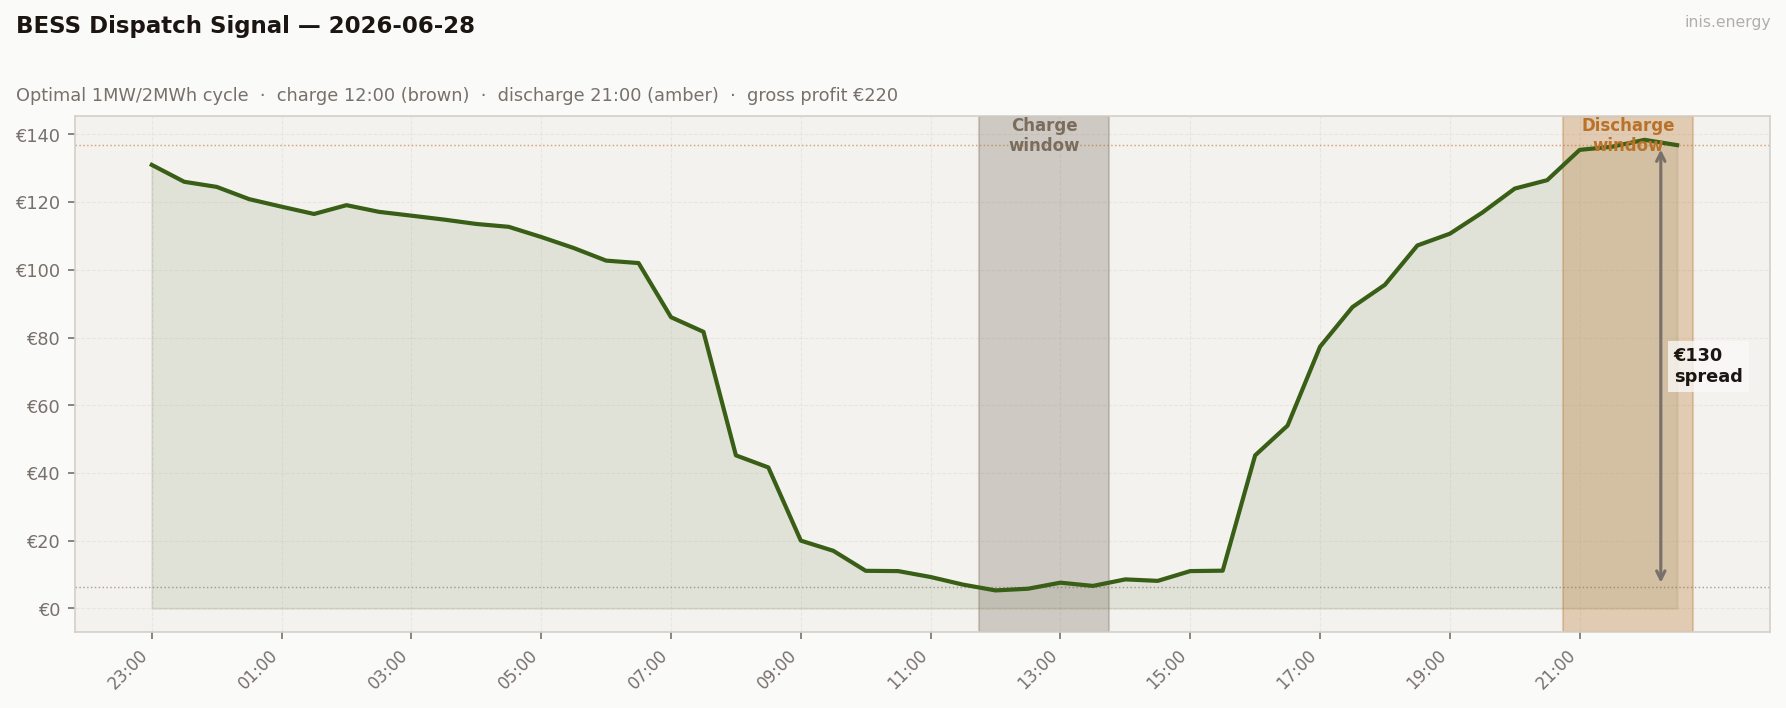
Extraordinary ROI (1739%) but tiny absolute numbers — charging at €6 costs almost nothing. €220 gross is the week’s best gross profit, earned entirely because the floor fell through the floor.
Commentary #
Two days of wind glut in a row, and Sunday was worse than Saturday. €5.29/MWh at noon — essentially free power for eight straight hours. Weekend demand cratering to a 3302MW average, combined with wind sitting comfortably in the high-40s, left the system with nowhere to send the extra generation.
This is the flip side of Wednesday and Thursday’s scarcity spikes: an oversupplied system is just as extreme in the other direction. Two consecutive giveaway days is unusual even by this month’s standards — worth watching whether Monday’s return to weekday demand snaps the market back.
Half-hourly data — 2026-06-28
| Period | Time | Price (€/MWh) | Wind % |
|---|---|---|---|
| 1 | 23:00 | 131.00 | 42.5% |
| 2 | 23:30 | 126.01 | 44.4% |
| 3 | 00:00 | 124.50 | 43.4% |
| 4 | 00:30 | 120.88 | 44.0% |
| 5 | 01:00 | 118.65 | 48.4% |
| 6 | 01:30 | 116.50 | 45.6% |
| 7 | 02:00 | 119.10 | 42.9% |
| 8 | 02:30 | 117.13 | 42.2% |
| 9 | 03:00 | 116.00 | 41.6% |
| 10 | 03:30 | 114.85 | 41.9% |
| 11 | 04:00 | 113.55 | 45.2% |
| 12 | 04:30 | 112.70 | 47.4% |
| 13 | 05:00 | 109.70 | 49.8% |
| 14 | 05:30 | 106.45 | 51.7% |
| 15 | 06:00 | 102.72 | 50.7% |
| 16 | 06:30 | 102.00 | 49.6% |
| 17 | 07:00 | 86.01 | 48.5% |
| 18 | 07:30 | 81.68 | 46.4% |
| 19 | 08:00 | 45.19 | 45.7% |
| 20 | 08:30 | 41.62 | 47.4% |
| 21 | 09:00 | 20.00 | 47.8% |
| 22 | 09:30 | 17.00 | 47.6% |
| 23 | 10:00 | 11.08 | 47.0% |
| 24 | 10:30 | 11.00 | 47.2% |
| 25 | 11:00 | 9.25 | 47.3% |
| 26 | 11:30 | 7.00 | 45.4% |
| 27 | 12:00 | 5.29 | 46.4% |
| 28 | 12:30 | 5.79 | 44.4% |
| 29 | 13:00 | 7.58 | 45.8% |
| 30 | 13:30 | 6.62 | 46.6% |
| 31 | 14:00 | 8.55 | 48.0% |
| 32 | 14:30 | 8.11 | 44.7% |
| 33 | 15:00 | 11.00 | 44.6% |
| 34 | 15:30 | 11.12 | 45.3% |
| 35 | 16:00 | 45.19 | 46.9% |
| 36 | 16:30 | 54.00 | 48.1% |
| 37 | 17:00 | 77.29 | 50.0% |
| 38 | 17:30 | 89.00 | 51.3% |
| 39 | 18:00 | 95.59 | 55.5% |
| 40 | 18:30 | 107.20 | 55.1% |
| 41 | 19:00 | 110.67 | 55.6% |
| 42 | 19:30 | 116.91 | 54.5% |
| 43 | 20:00 | 124.00 | 50.1% |
| 44 | 20:30 | 126.49 | 48.4% |
| 45 | 21:00 | 135.44 | 48.1% |
| 46 | 21:30 | 136.38 | 45.2% |
| 47 | 22:00 | 138.40 | 43.8% |
| 48 | 22:30 | 136.84 | 44.3% |
Compare your business electricity and gas rates in minutes with INIS Energy Brokers.
Compare rates