I-SEM Daily Briefing — 1 July 2026
Table of Contents
Market Snapshot
| Metric | Value |
|---|---|
| Mean DAM Price | €131.11/MWh |
| Median Price | €131.07/MWh |
| Std Dev | €37.79/MWh |
| Peak Price | €235.0/MWh (07:30) |
| Min Price | €86.0/MWh (22:30) |
| Price Range | €149.0/MWh |
| Periods above €150 | 9 of 48 (19%) |
| Periods above €200 | 5 of 48 (10%) |
| Peak Avg (07–22) | €128.6/MWh |
| Off-peak Avg (22–07) | €135.29/MWh |
| Peak/Off-Peak Spread | €-6.69/MWh |
| Wind % of Demand | 36.1% |
| Wind Range | 6.8%–63.5% |
| Mean Demand | 3903 MW |
Price Profile #
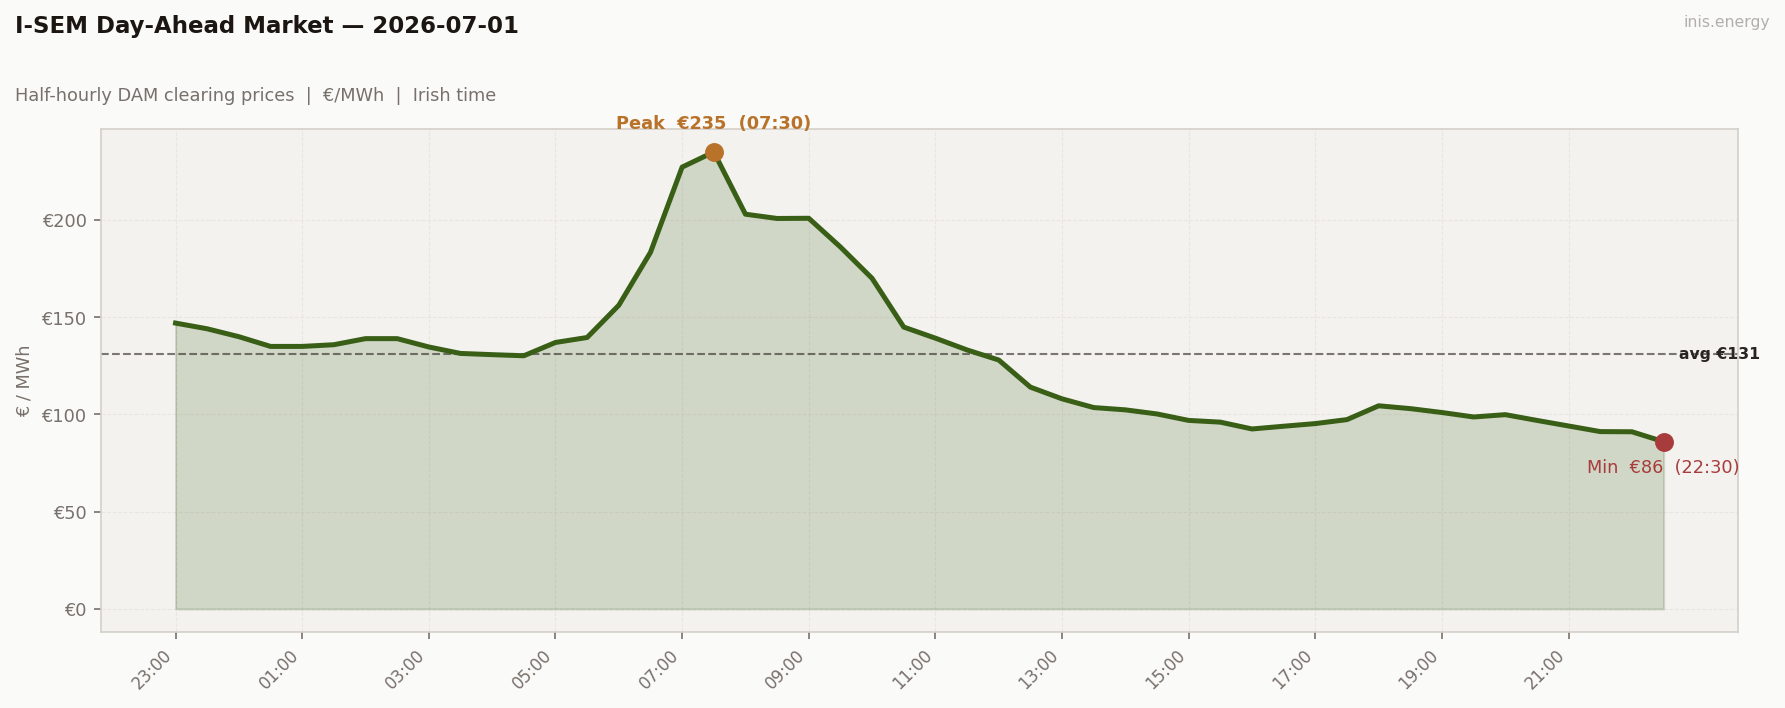
Std dev €37.79/MWh · Median €131.07/MWh · Periods above €150: 9 of 48 (19%)
Wind at 63% overnight held price near €145, then crashed to 7% by 07:30 — the sharpest overnight wind collapse of the week, and it landed right on the morning ramp. €235 at 07:30, day’s peak. Then wind flooded straight back in through the afternoon, past 60% by evening, and dragged price down to an €86 floor by 22:30. Up, down, and back up again in the same 24 hours.
Price vs Wind #
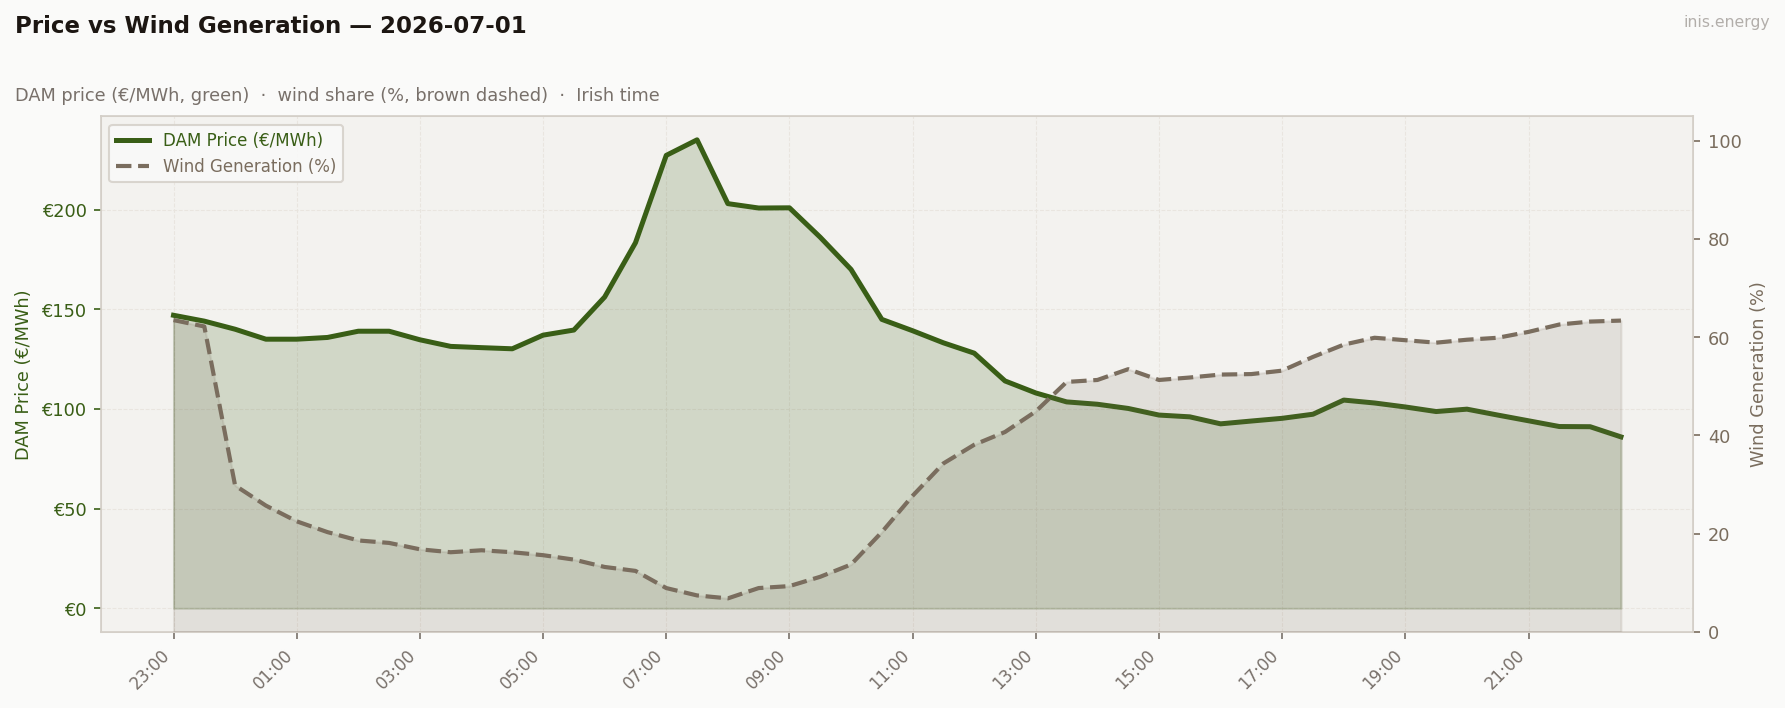
Mean wind: 36.1% · Range: 6.8%–63.5%
Two inversions in one day, not one. Wind falling 63%→7% overnight builds the €235 spike; wind rising 7%→64% through the afternoon tears the floor out from under price by evening. Same driver, opposite direction, twice.
Week in Context #
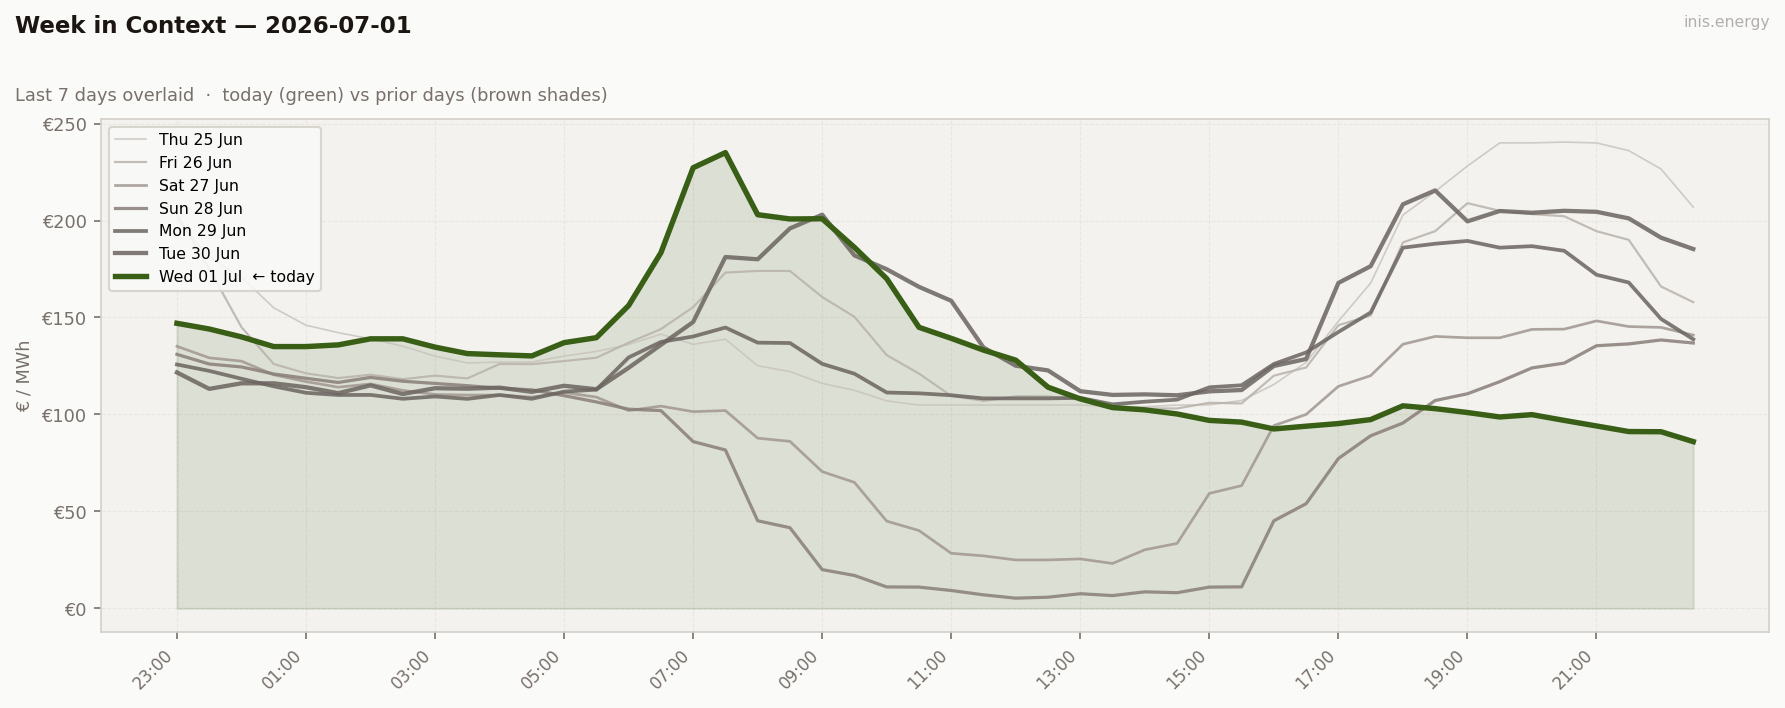
A much messier wind profile to open July than Tuesday’s clean single-direction arc. Tuesday’s wind fell steadily all day into the evening peak; Wednesday’s wind whipsawed — crashed, spiked price, then flooded straight back and crushed it. Same ingredients, no consistent shape.
Price Duration Curve #
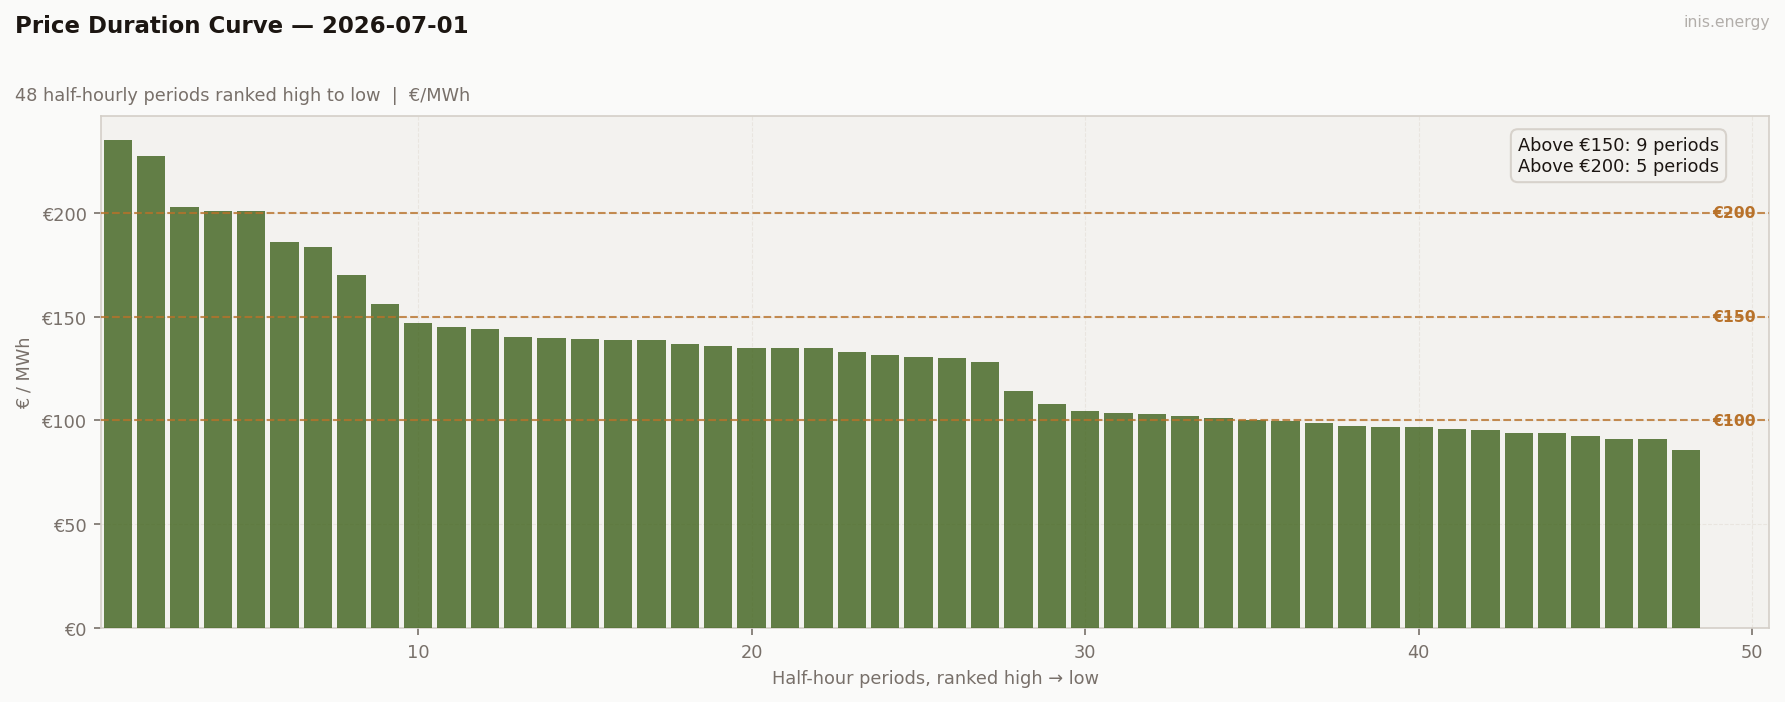
Periods above €150: 9 (19% of day) · Above €200: 5 (10% of day)
Most of the day sat flat and cheap — the €150+ periods are almost entirely the morning spike, not a broad ceiling.
Peak / Off-Peak Spread #
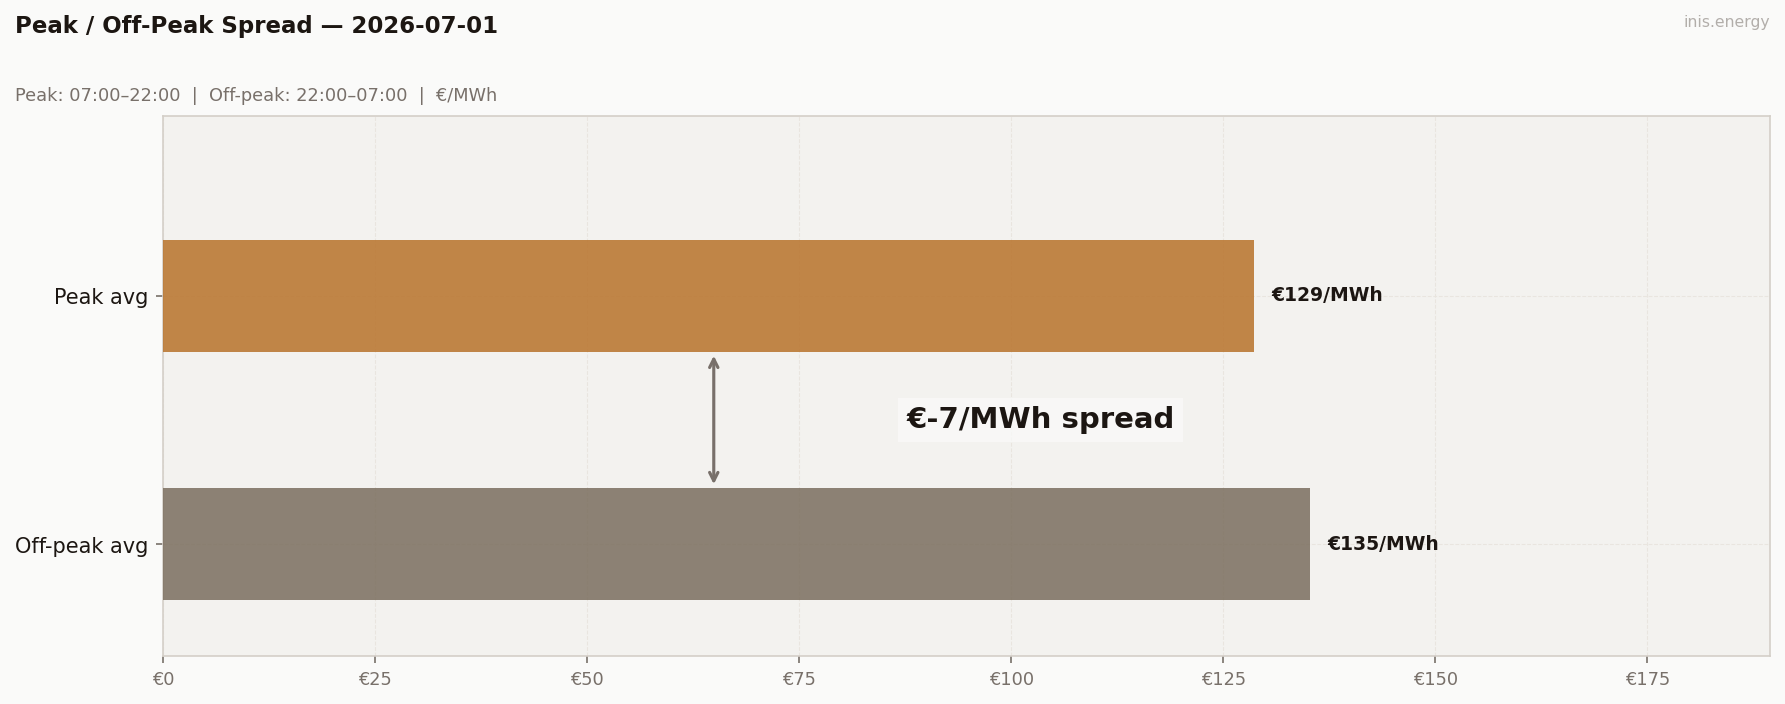
Peak avg (07:00–22:00): €128.6/MWh · Off-peak avg: €135.29/MWh · Spread: €-6.69/MWh
Flipped spread. The overnight low-wind stretch (00:00–07:00) held the off-peak average up, while the afternoon wind glut inside the “peak” window dragged that average down below it. Wind timing beat the clock.
BESS Dispatch Signal #
Updated 2026-08-27: the BESS simulation previously allowed the discharge window to occur before the charge window ended, which is physically impossible for a battery. Recalculated enforcing charge-before-discharge — see below.
No profitable single-cycle trade today. The cheapest four-period block (€91/MWh, 21:00, into the evening wind surplus) sits after the day’s priciest block (€216/MWh, 07:00, the morning wind-collapse spike) has already passed. A same-day model can’t charge into tonight’s trough and then discharge into a peak that happened this morning.
Commentary #
Wednesday opens July with the messiest wind profile of the week: a hard overnight collapse that spiked price to €235, followed by an equally hard afternoon flood that crushed it back to €86. Neither move was gradual — both happened inside a handful of periods, which is what makes the day tricky to read off a single chart. You need the whole 24 hours to see the story.
It’s also the reason the peak/off-peak spread flipped negative. The usual daytime premium got wiped out by the afternoon wind glut sitting right inside the “peak” window, while the pre-dawn lull pushed the off-peak average up instead. When wind moves fast enough, it can invert the clock entirely.
A volatile open to the month. Worth watching whether this whipsaw pattern repeats or whether the week settles back into steadier single-direction wind days.
Half-hourly data — 2026-07-01
| Period | Time | Price (€/MWh) | Wind % |
|---|---|---|---|
| 1 | 23:00 | 147.00 | 63.5% |
| 2 | 23:30 | 144.06 | 62.2% |
| 3 | 00:00 | 140.00 | 29.8% |
| 4 | 00:30 | 135.00 | 25.7% |
| 5 | 01:00 | 135.00 | 22.5% |
| 6 | 01:30 | 135.87 | 20.3% |
| 7 | 02:00 | 139.00 | 18.6% |
| 8 | 02:30 | 139.00 | 18.1% |
| 9 | 03:00 | 134.71 | 16.8% |
| 10 | 03:30 | 131.39 | 16.2% |
| 11 | 04:00 | 130.76 | 16.6% |
| 12 | 04:30 | 130.19 | 16.2% |
| 13 | 05:00 | 137.03 | 15.6% |
| 14 | 05:30 | 139.59 | 14.7% |
| 15 | 06:00 | 156.16 | 13.2% |
| 16 | 06:30 | 183.37 | 12.4% |
| 17 | 07:00 | 227.21 | 8.9% |
| 18 | 07:30 | 235.00 | 7.4% |
| 19 | 08:00 | 203.00 | 6.8% |
| 20 | 08:30 | 200.80 | 8.9% |
| 21 | 09:00 | 200.90 | 9.3% |
| 22 | 09:30 | 186.13 | 11.2% |
| 23 | 10:00 | 170.00 | 13.7% |
| 24 | 10:30 | 144.94 | 20.3% |
| 25 | 11:00 | 139.24 | 27.7% |
| 26 | 11:30 | 133.18 | 34.3% |
| 27 | 12:00 | 128.00 | 38.1% |
| 28 | 12:30 | 114.06 | 40.7% |
| 29 | 13:00 | 108.03 | 44.9% |
| 30 | 13:30 | 103.55 | 50.9% |
| 31 | 14:00 | 102.37 | 51.3% |
| 32 | 14:30 | 100.26 | 53.5% |
| 33 | 15:00 | 96.94 | 51.3% |
| 34 | 15:30 | 96.05 | 51.8% |
| 35 | 16:00 | 92.54 | 52.4% |
| 36 | 16:30 | 93.95 | 52.5% |
| 37 | 17:00 | 95.31 | 53.2% |
| 38 | 17:30 | 97.36 | 56.0% |
| 39 | 18:00 | 104.46 | 58.5% |
| 40 | 18:30 | 103.00 | 59.9% |
| 41 | 19:00 | 101.00 | 59.4% |
| 42 | 19:30 | 98.71 | 58.9% |
| 43 | 20:00 | 99.90 | 59.5% |
| 44 | 20:30 | 96.94 | 59.9% |
| 45 | 21:00 | 94.07 | 61.1% |
| 46 | 21:30 | 91.19 | 62.6% |
| 47 | 22:00 | 91.10 | 63.2% |
| 48 | 22:30 | 86.00 | 63.4% |
Compare your business electricity and gas rates in minutes with INIS Energy Brokers.
Compare rates