I-SEM Daily Briefing — 2 July 2026
Table of Contents
Market Snapshot
| Metric | Value |
|---|---|
| Mean DAM Price | €122.55/MWh |
| Median Price | €101.71/MWh |
| Std Dev | €48.48/MWh |
| Peak Price | €220.0/MWh (22:00) |
| Min Price | €55.23/MWh (03:00) |
| Price Range | €164.77/MWh |
| Periods above €150 | 13 of 48 (27%) |
| Periods above €200 | 5 of 48 (10%) |
| Peak Avg (07–22) | €140.62/MWh |
| Off-peak Avg (22–07) | €92.44/MWh |
| Peak/Off-Peak Spread | €48.18/MWh |
| Wind % of Demand | 28.0% |
| Wind Range | 9.9%–65.0% |
| Mean Demand | 3782 MW |
Price Profile #
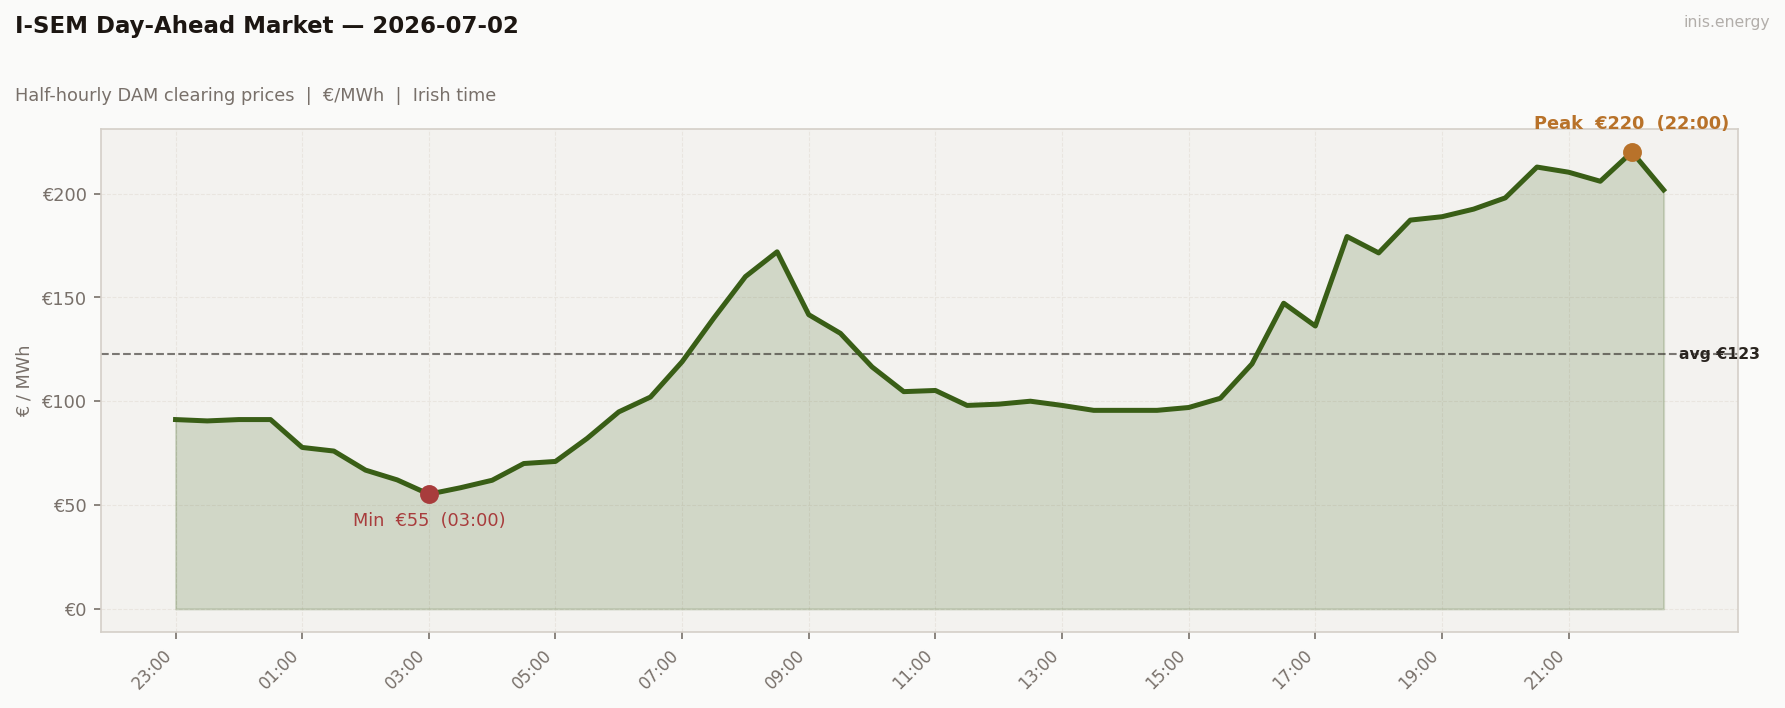
Std dev €48.48/MWh · Median €101.71/MWh · Periods above €150: 13 of 48 (27%)
Widest spread of the week so far. A short overnight wind spike to 65% put a €55 floor under 03:00, then wind bled away steadily all day — no crash, just a slow decline to 10% by 22:00 — and price climbed with it, right through to a late €220 peak at 22:00. A slow bleed, not a whipsaw.
Price vs Wind #
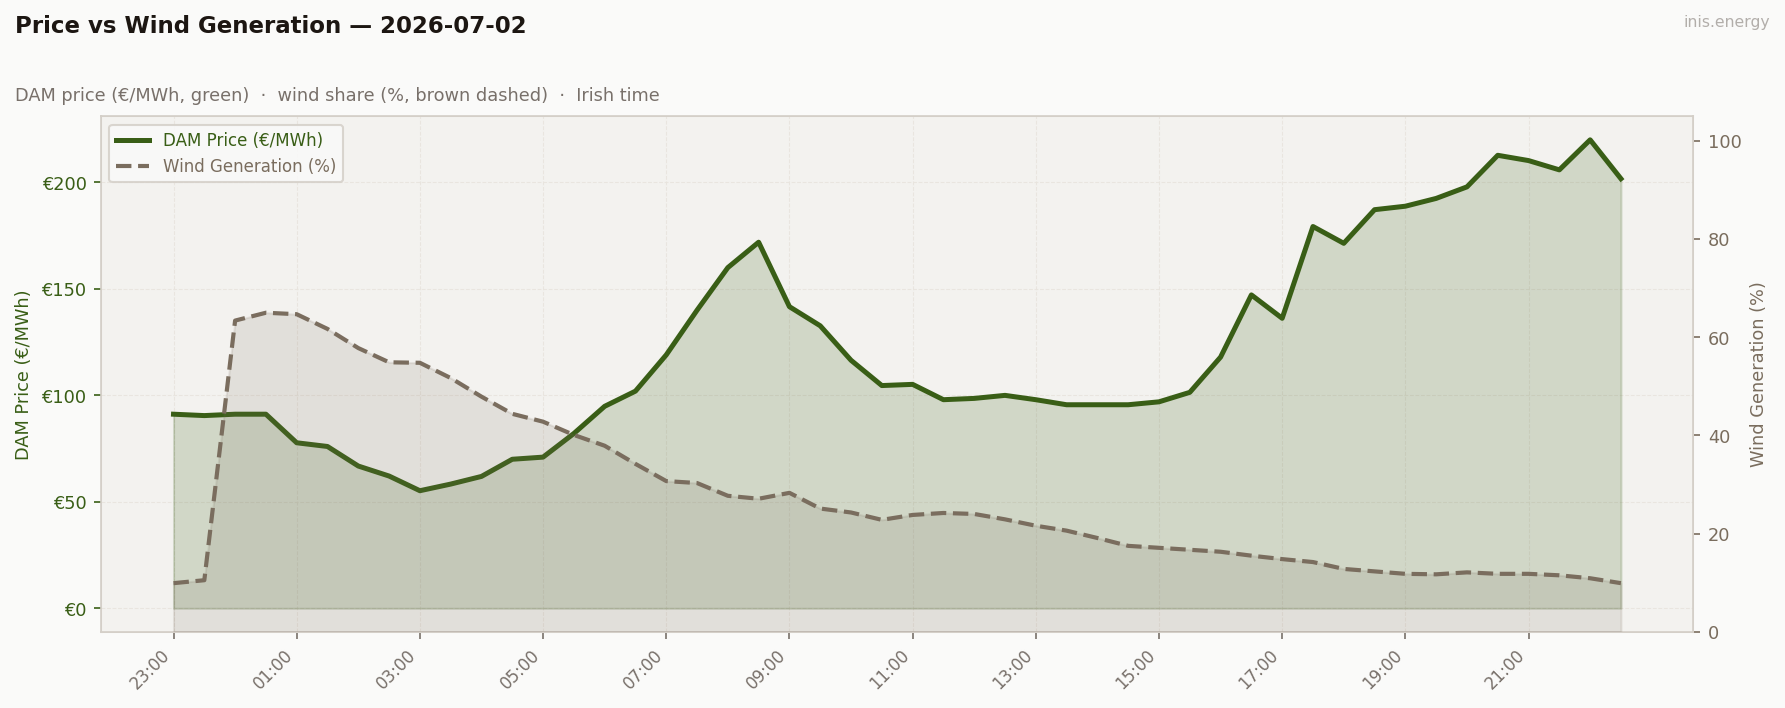
Mean wind: 28.0% · Range: 9.9%–65.0%
Textbook inverse, just stretched over the whole day instead of concentrated in one ramp. Wind’s overnight spike buys the €55 floor; its steady erosion from there buys every euro of the climb to €220.
Week in Context #
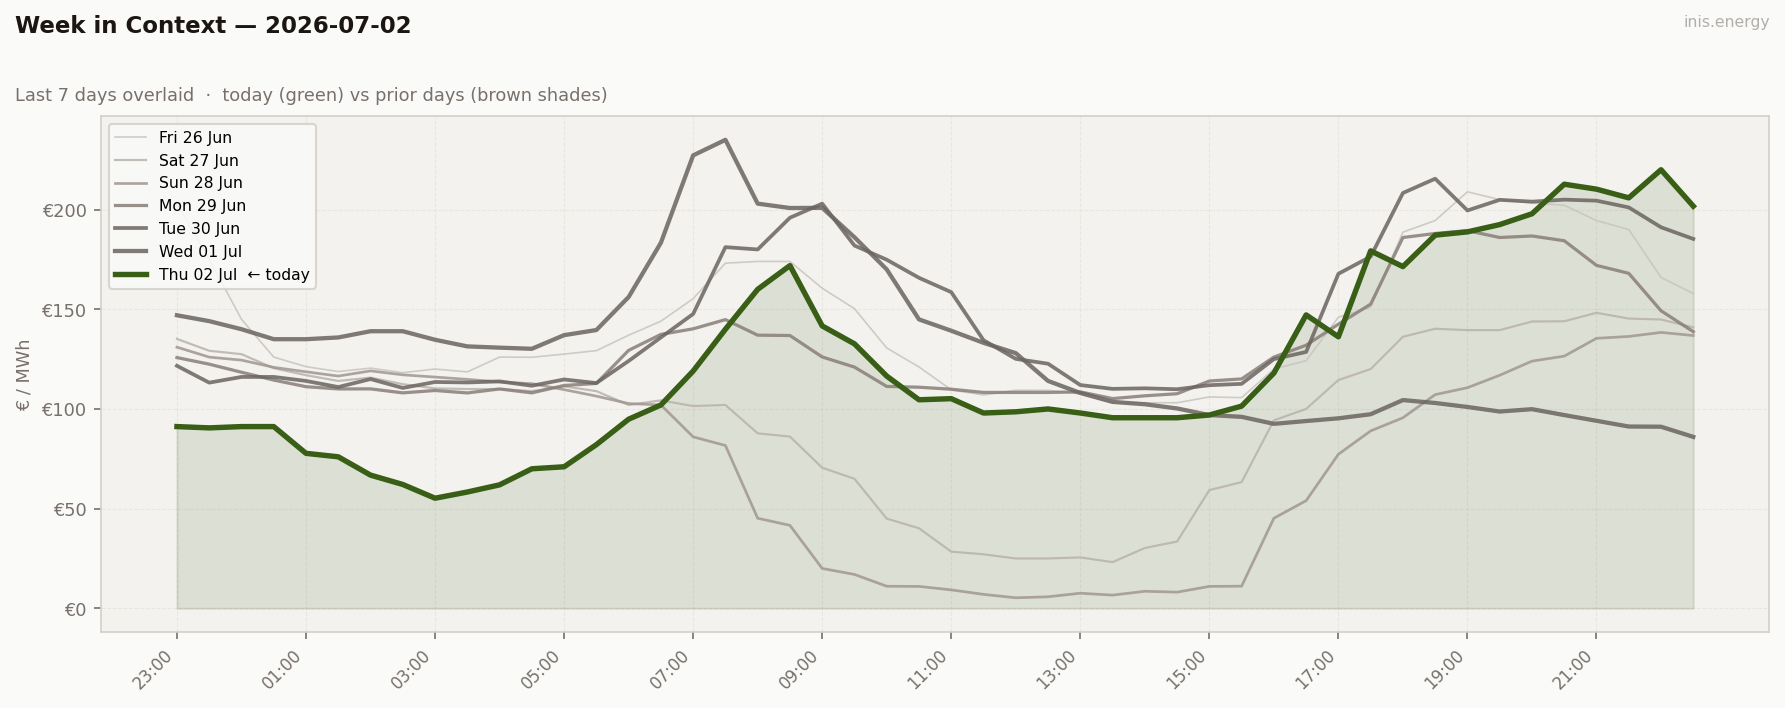
Highest std dev of the week so far (€48.48) — a proper floor-to-ceiling day, versus Wednesday’s whipsaw between two extremes. Different shape, similar-sized swing.
Price Duration Curve #
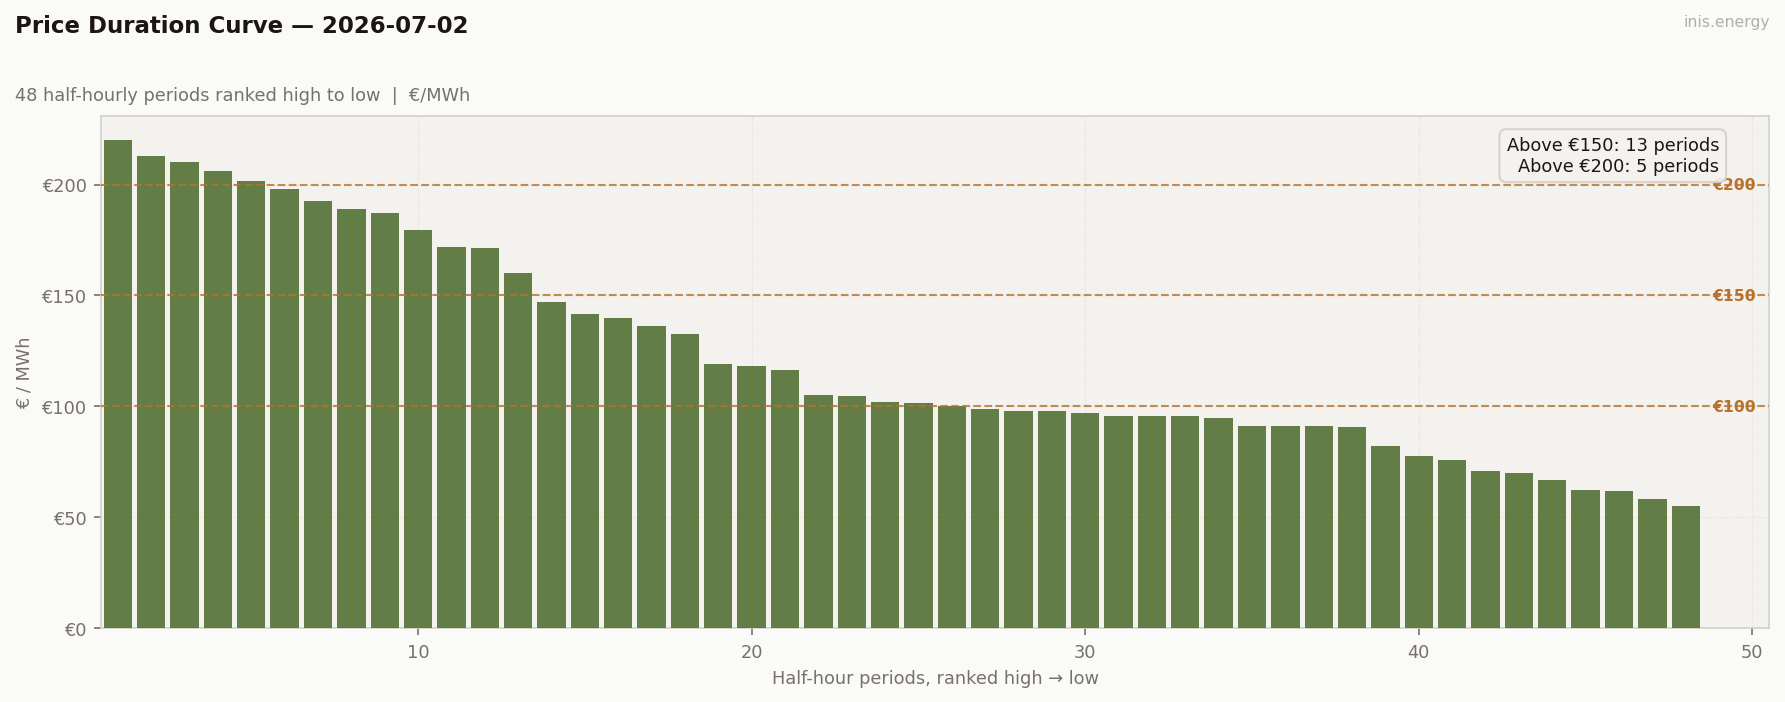
Periods above €150: 13 (27% of day) · Above €200: 5 (10% of day)
Broader ceiling than Wednesday — 27% of the day above €150 versus 19%, because the evening squeeze here built gradually rather than spiking and releasing.
Peak / Off-Peak Spread #
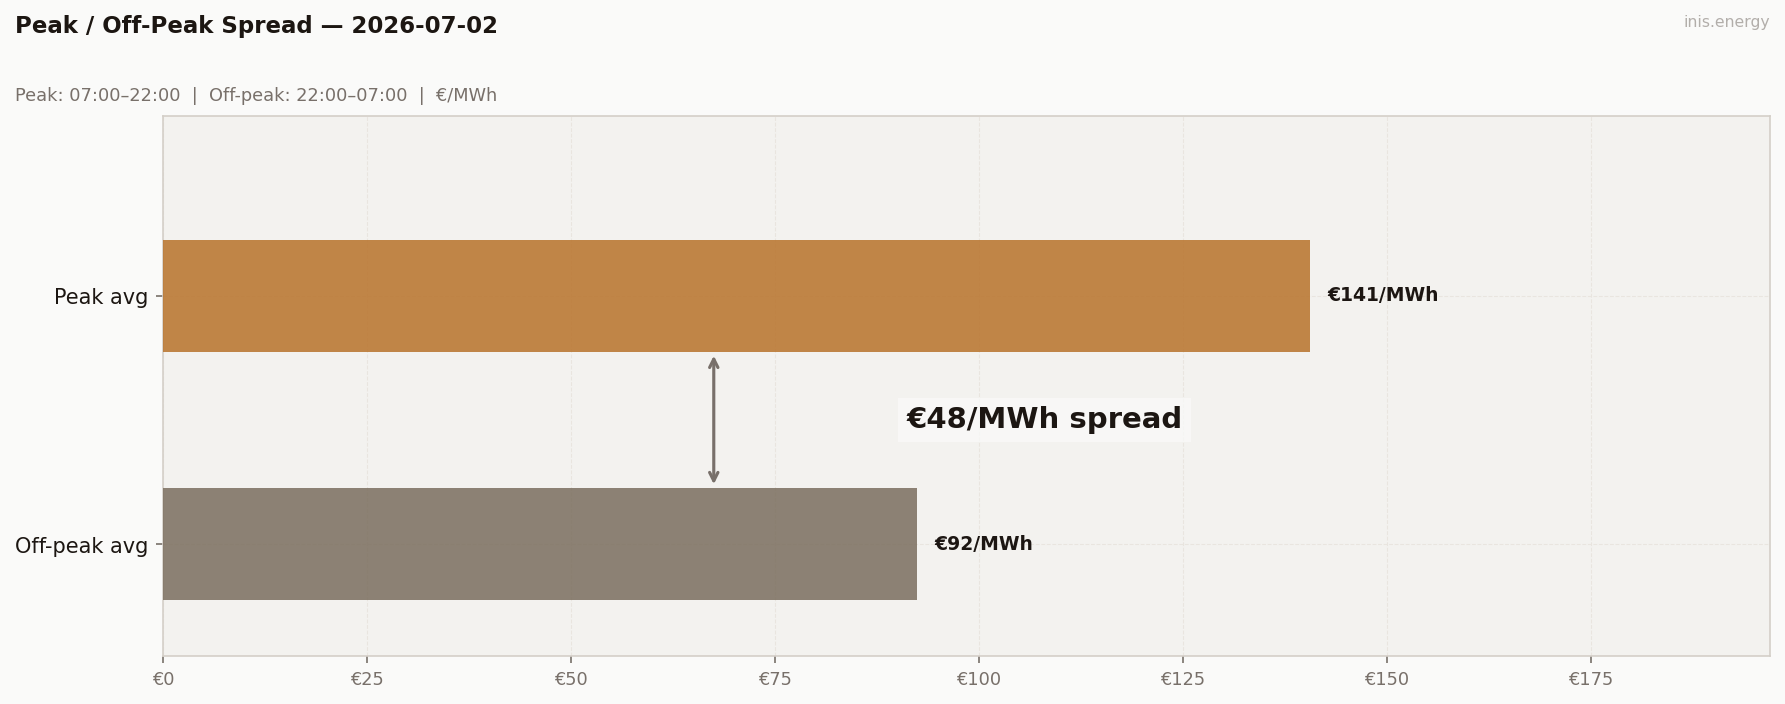
Peak avg (07:00–22:00): €140.62/MWh · Off-peak avg: €92.44/MWh · Spread: €48.18/MWh
Widest positive spread yet — a genuine cheap overnight window built on real wind, against an expensive, wind-starved evening. This is the spread shape storage actually wants.
BESS Dispatch Signal #
| Price | Time | Energy | Value | |
|---|---|---|---|---|
| Charge | €59/MWh | 02:30 | 2 MWh | −€119 |
| Discharge | €212/MWh | 20:30 | 1.7 MWh (85% RTE) | +€361 |
| Gross profit | €242 | |||
| Price spread | €153/MWh | ROI: 203.6% |
Simulated 1MW/2MWh battery, one optimal DAM cycle. Gross before network charges and capacity costs.
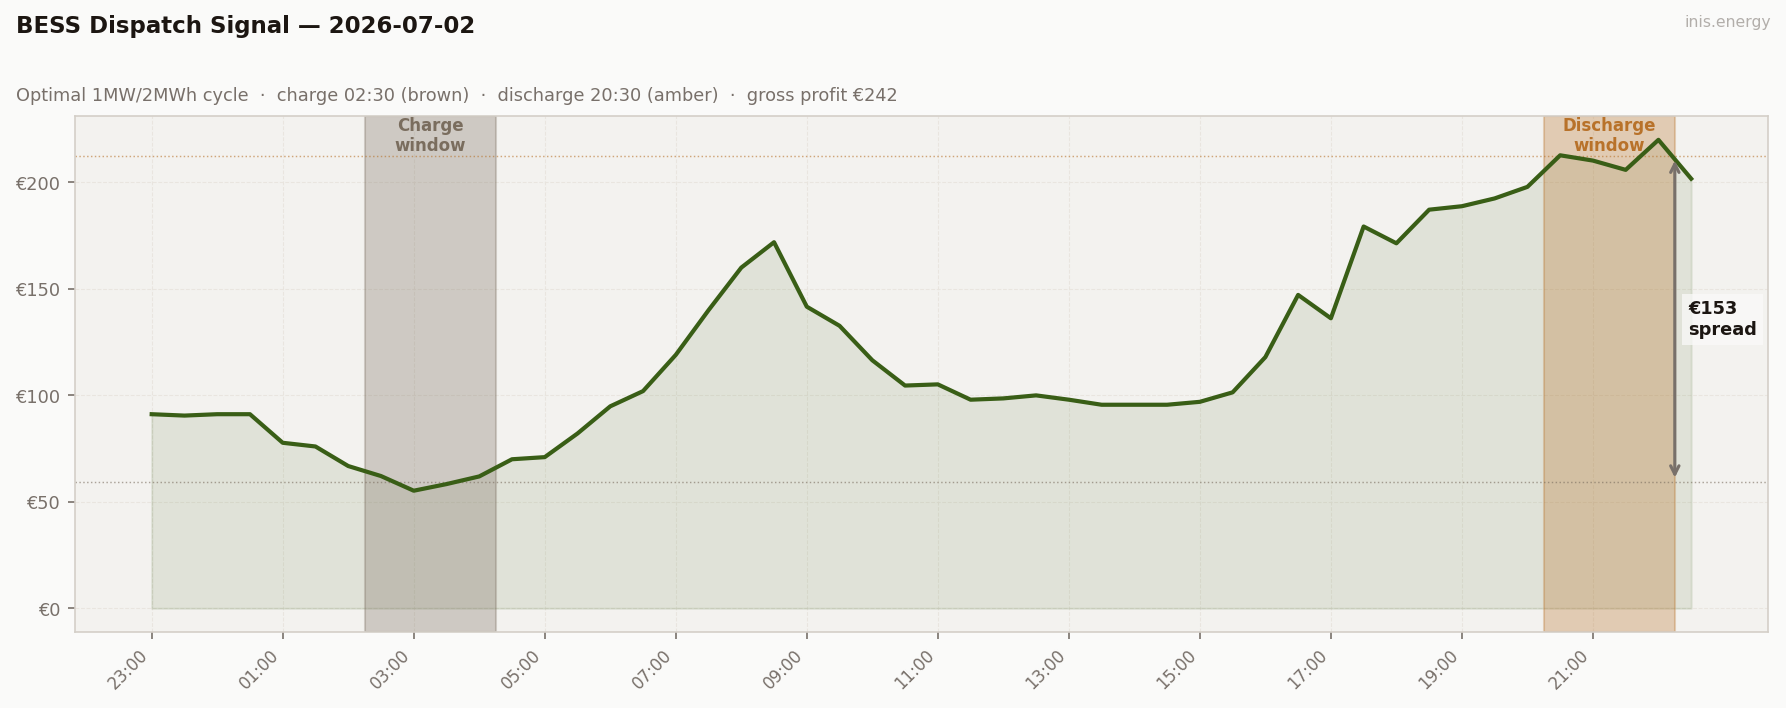
Charged at €59 (02:30, wind near 55%), discharged into the late €212 evening peak (20:30). Gross €242, ROI 204% — the best-defined trade of the week so far, and it didn’t need a dramatic wind crash, just a long, steady decline.
Commentary #
Thursday traded Wednesday’s whipsaw for a slow bleed. Wind spiked briefly overnight, then fell away in a straight line for the rest of the day — no sharp reversal, just a steady erosion that pushed price up period after period until it peaked late, at 22:00 rather than the usual 17:00–19:00 ramp window.
That late peak is the interesting bit. Wind was still falling into the evening, so instead of the price topping out and easing back once the evening ramp cleared, it kept climbing until wind bottomed out for the night. Demand and wind scarcity lined up at exactly the wrong moment.
Two very different mechanisms, two big swings back to back. Worth watching whether Friday brings a third variation or a return to something calmer.
Half-hourly data — 2026-07-02
| Period | Time | Price (€/MWh) | Wind % |
|---|---|---|---|
| 1 | 23:00 | 91.16 | 9.9% |
| 2 | 23:30 | 90.51 | 10.5% |
| 3 | 00:00 | 91.16 | 63.4% |
| 4 | 00:30 | 91.16 | 65.0% |
| 5 | 01:00 | 77.74 | 64.7% |
| 6 | 01:30 | 76.00 | 61.7% |
| 7 | 02:00 | 66.82 | 57.8% |
| 8 | 02:30 | 62.12 | 54.9% |
| 9 | 03:00 | 55.23 | 54.8% |
| 10 | 03:30 | 58.34 | 51.7% |
| 11 | 04:00 | 61.94 | 47.9% |
| 12 | 04:30 | 70.00 | 44.4% |
| 13 | 05:00 | 71.00 | 42.8% |
| 14 | 05:30 | 82.10 | 40.1% |
| 15 | 06:00 | 94.86 | 37.9% |
| 16 | 06:30 | 102.00 | 34.2% |
| 17 | 07:00 | 119.02 | 30.7% |
| 18 | 07:30 | 140.00 | 30.3% |
| 19 | 08:00 | 160.00 | 27.7% |
| 20 | 08:30 | 171.93 | 27.1% |
| 21 | 09:00 | 141.65 | 28.3% |
| 22 | 09:30 | 132.67 | 25.1% |
| 23 | 10:00 | 116.49 | 24.3% |
| 24 | 10:30 | 104.61 | 22.8% |
| 25 | 11:00 | 105.17 | 23.8% |
| 26 | 11:30 | 97.97 | 24.2% |
| 27 | 12:00 | 98.58 | 24.0% |
| 28 | 12:30 | 100.00 | 22.9% |
| 29 | 13:00 | 97.97 | 21.6% |
| 30 | 13:30 | 95.60 | 20.6% |
| 31 | 14:00 | 95.60 | 19.1% |
| 32 | 14:30 | 95.60 | 17.5% |
| 33 | 15:00 | 96.97 | 17.1% |
| 34 | 15:30 | 101.42 | 16.7% |
| 35 | 16:00 | 117.98 | 16.3% |
| 36 | 16:30 | 147.18 | 15.5% |
| 37 | 17:00 | 136.20 | 14.8% |
| 38 | 17:30 | 179.30 | 14.2% |
| 39 | 18:00 | 171.41 | 12.8% |
| 40 | 18:30 | 187.20 | 12.3% |
| 41 | 19:00 | 188.83 | 11.8% |
| 42 | 19:30 | 192.49 | 11.7% |
| 43 | 20:00 | 197.91 | 12.1% |
| 44 | 20:30 | 212.74 | 11.8% |
| 45 | 21:00 | 210.26 | 11.8% |
| 46 | 21:30 | 205.90 | 11.5% |
| 47 | 22:00 | 220.00 | 10.9% |
| 48 | 22:30 | 201.74 | 9.9% |
Compare your business electricity and gas rates in minutes with INIS Energy Brokers.
Compare rates