I-SEM Daily Briefing — 3 July 2026
Table of Contents
Market Snapshot
| Metric | Value |
|---|---|
| Mean DAM Price | €140.91/MWh |
| Median Price | €137.62/MWh |
| Std Dev | €32.01/MWh |
| Peak Price | €224.0/MWh (07:30) |
| Min Price | €95.74/MWh (15:30) |
| Price Range | €128.26/MWh |
| Periods above €150 | 11 of 48 (23%) |
| Periods above €200 | 5 of 48 (10%) |
| Peak Avg (07–22) | €138.64/MWh |
| Off-peak Avg (22–07) | €144.7/MWh |
| Peak/Off-Peak Spread | €-6.06/MWh |
| Wind % of Demand | 25.4% |
| Wind Range | 8.1%–43.9% |
| Mean Demand | 3776 MW |
Price Profile #
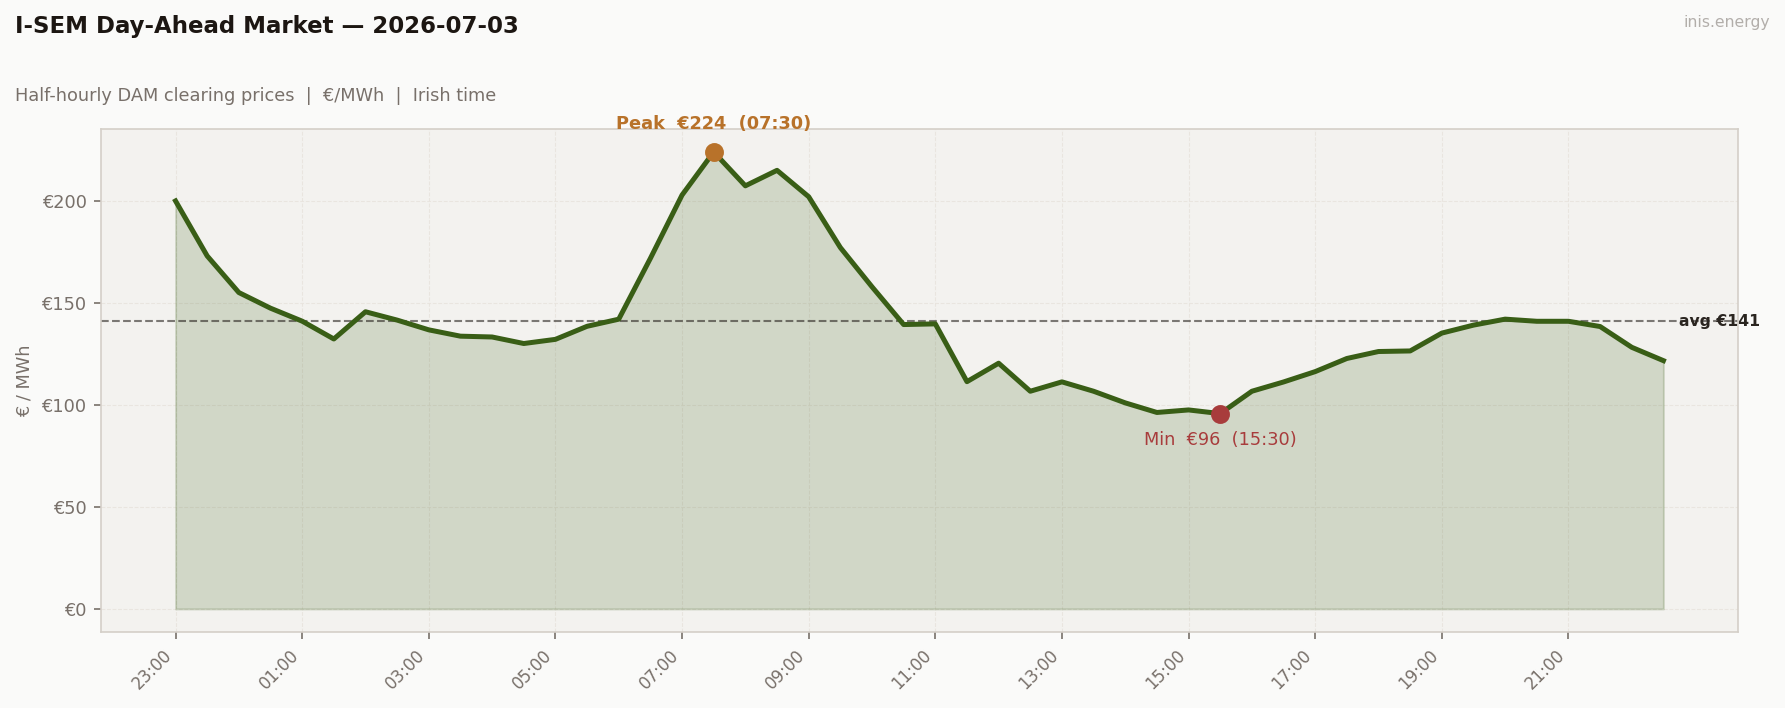
Std dev €32.01/MWh · Median €137.62/MWh · Periods above €150: 11 of 48 (23%)
Wind never got out of second gear today — 44% was the ceiling, and it spent the small hours down at 8%. That pre-dawn low held price above €130 all night, then wind bottoming out again for the morning ramp bought the day’s €224 peak at 07:30. Afternoon wind climbing back to 40%+ only pulled price down to a shallow €96 trough — nothing like Thursday’s €55 floor.
Price vs Wind #
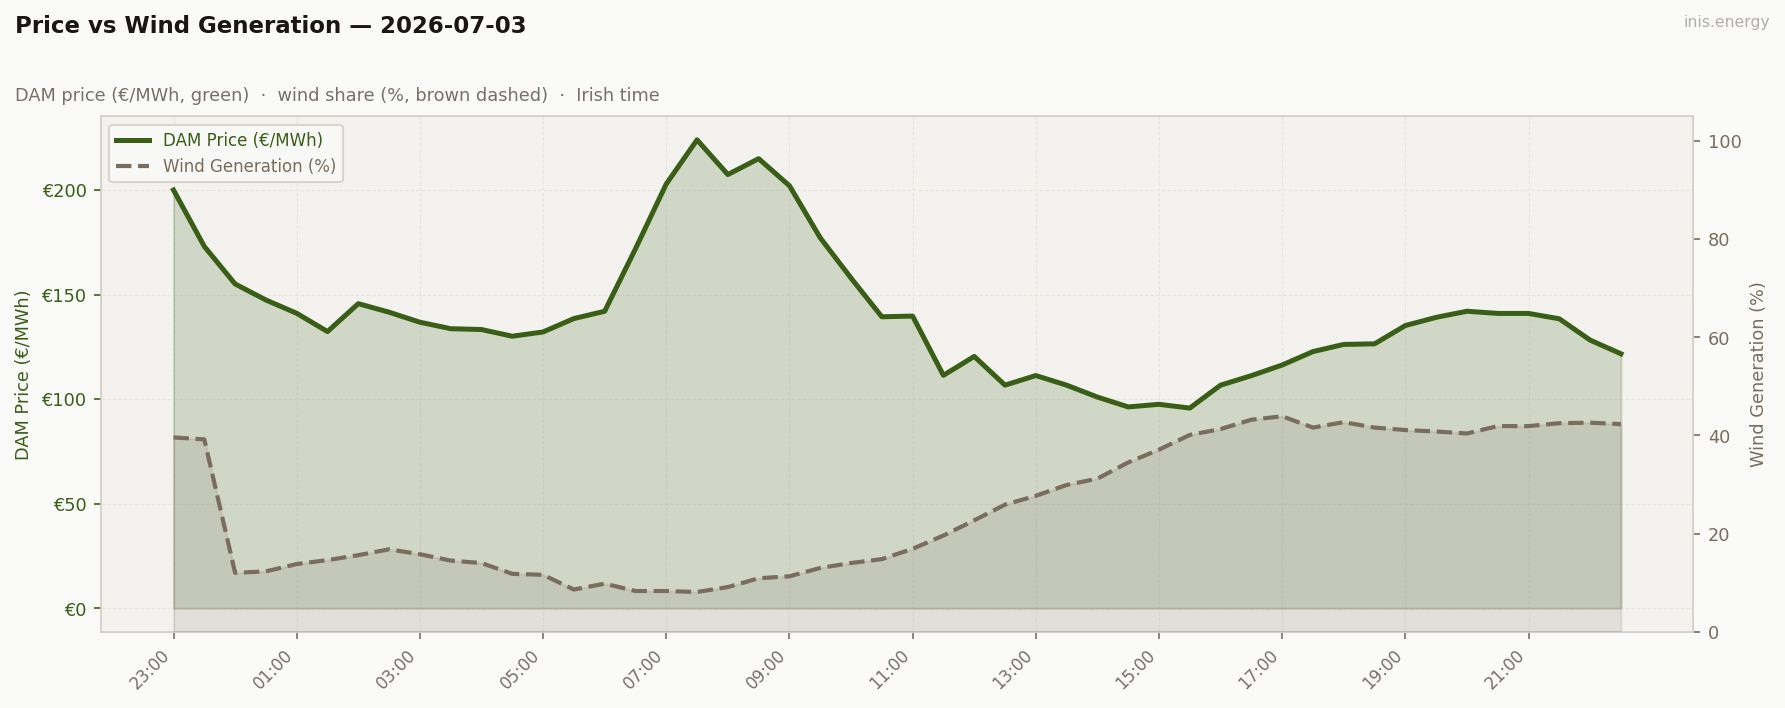
Mean wind: 25.4% · Range: 8.1%–43.9%
A muted version of the usual relationship. With wind capped at 44% there was never enough supply on the table to crush price the way Wednesday’s or Thursday’s wind highs did — the trough this time is a dip, not a floor.
Week in Context #
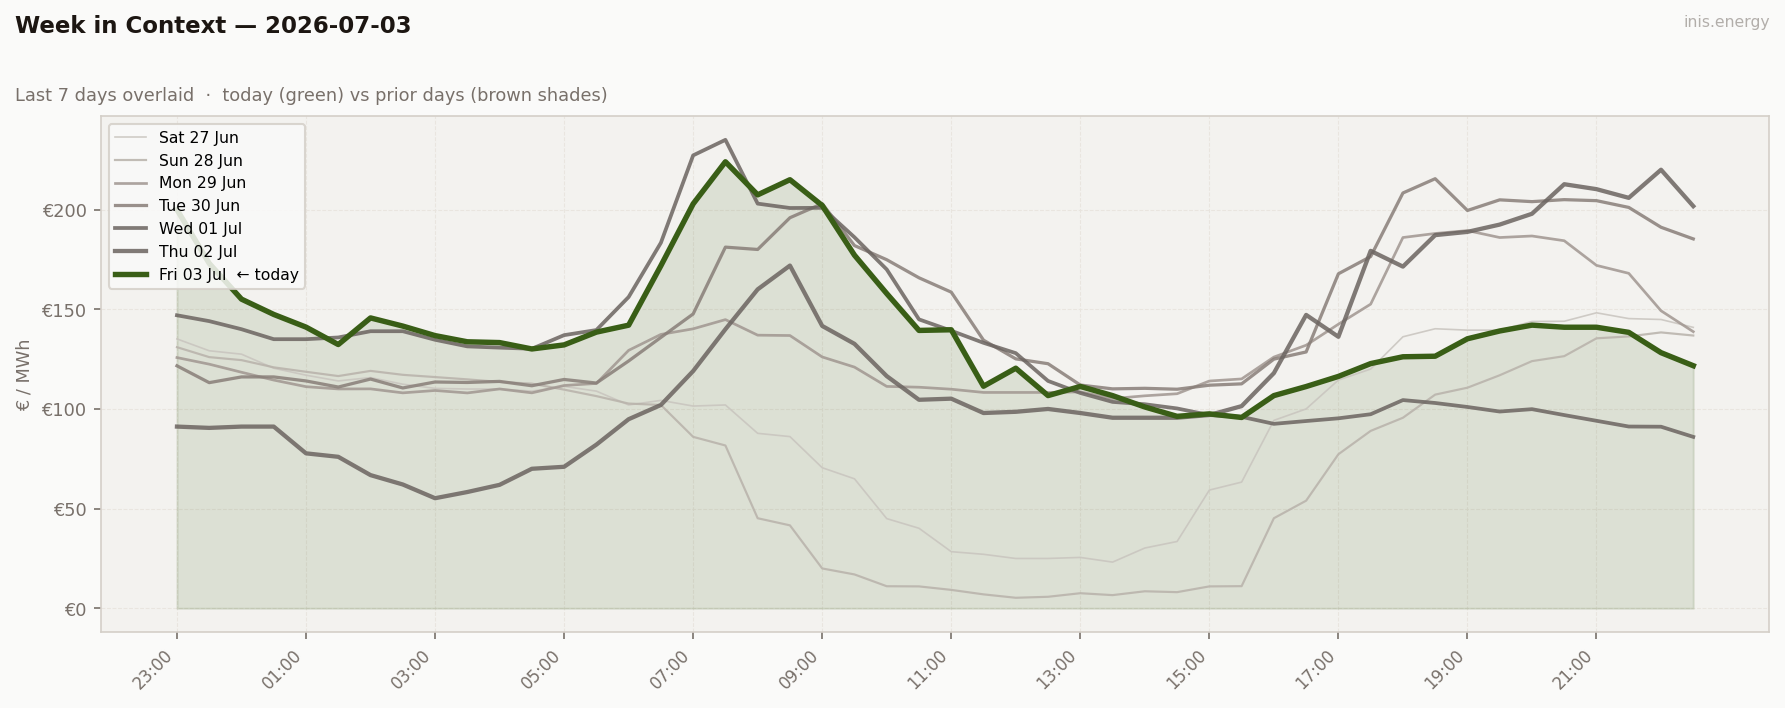
Third day, third shape. Wednesday whipsawed, Thursday bled steadily, Friday just ran short of wind all day. Std dev (€32.01) sits between the two — less violent than Thursday, still more than double Monday-style calm.
Price Duration Curve #
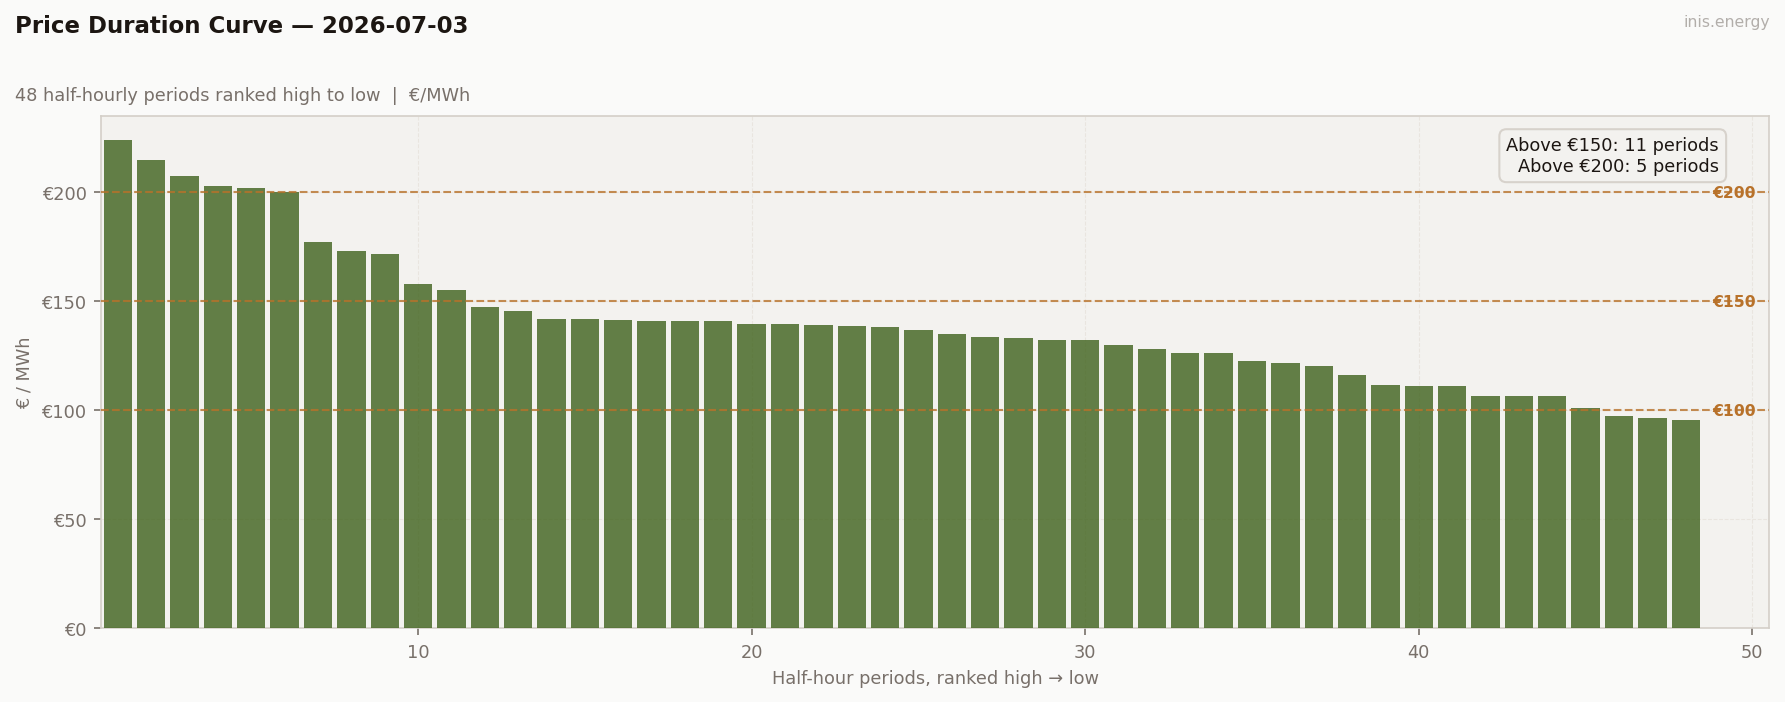
Periods above €150: 11 (23% of day) · Above €200: 5 (10% of day)
A morning-loaded ceiling — most of the €200+ periods cluster around the 07:30 spike rather than spreading through the evening.
Peak / Off-Peak Spread #
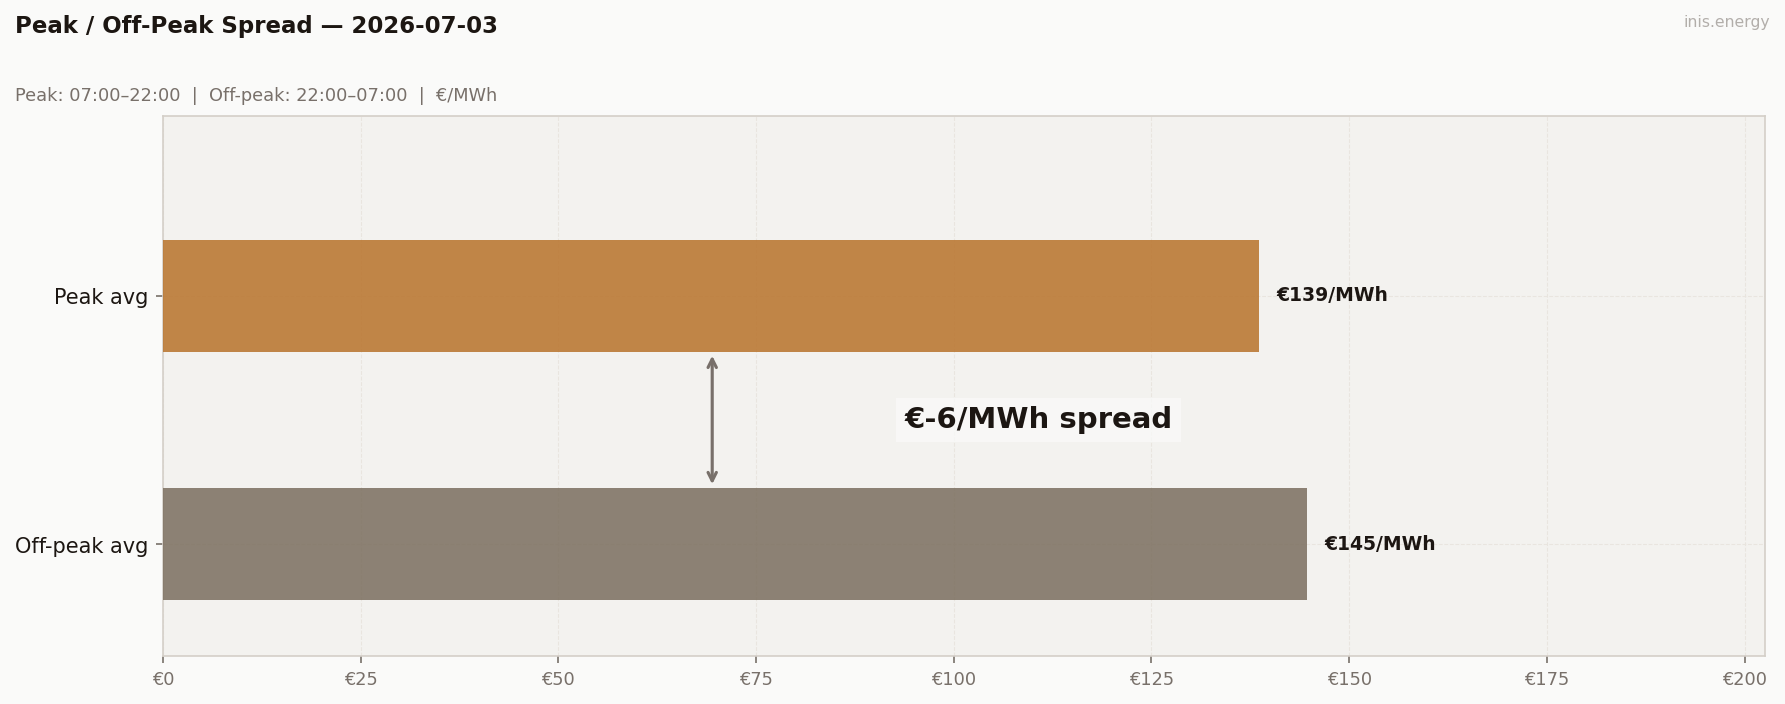
Peak avg (07:00–22:00): €138.64/MWh · Off-peak avg: €144.7/MWh · Spread: €-6.06/MWh
Negative again, same mechanism as Wednesday: a low-wind pre-dawn stretch drags the off-peak average above the daytime one, even with a €224 spike sitting inside the peak window.
BESS Dispatch Signal #
| Price | Time | Energy | Value | |
|---|---|---|---|---|
| Charge | €98/MWh | 14:00 | 2 MWh | −€195 |
| Discharge | €141/MWh | 19:30 | 1.7 MWh (85% RTE) | +€239 |
| Gross profit | €44 | |||
| Price spread | €43/MWh | ROI: 22.6% |
Simulated 1MW/2MWh battery, one optimal DAM cycle. Gross before network charges and capacity costs.
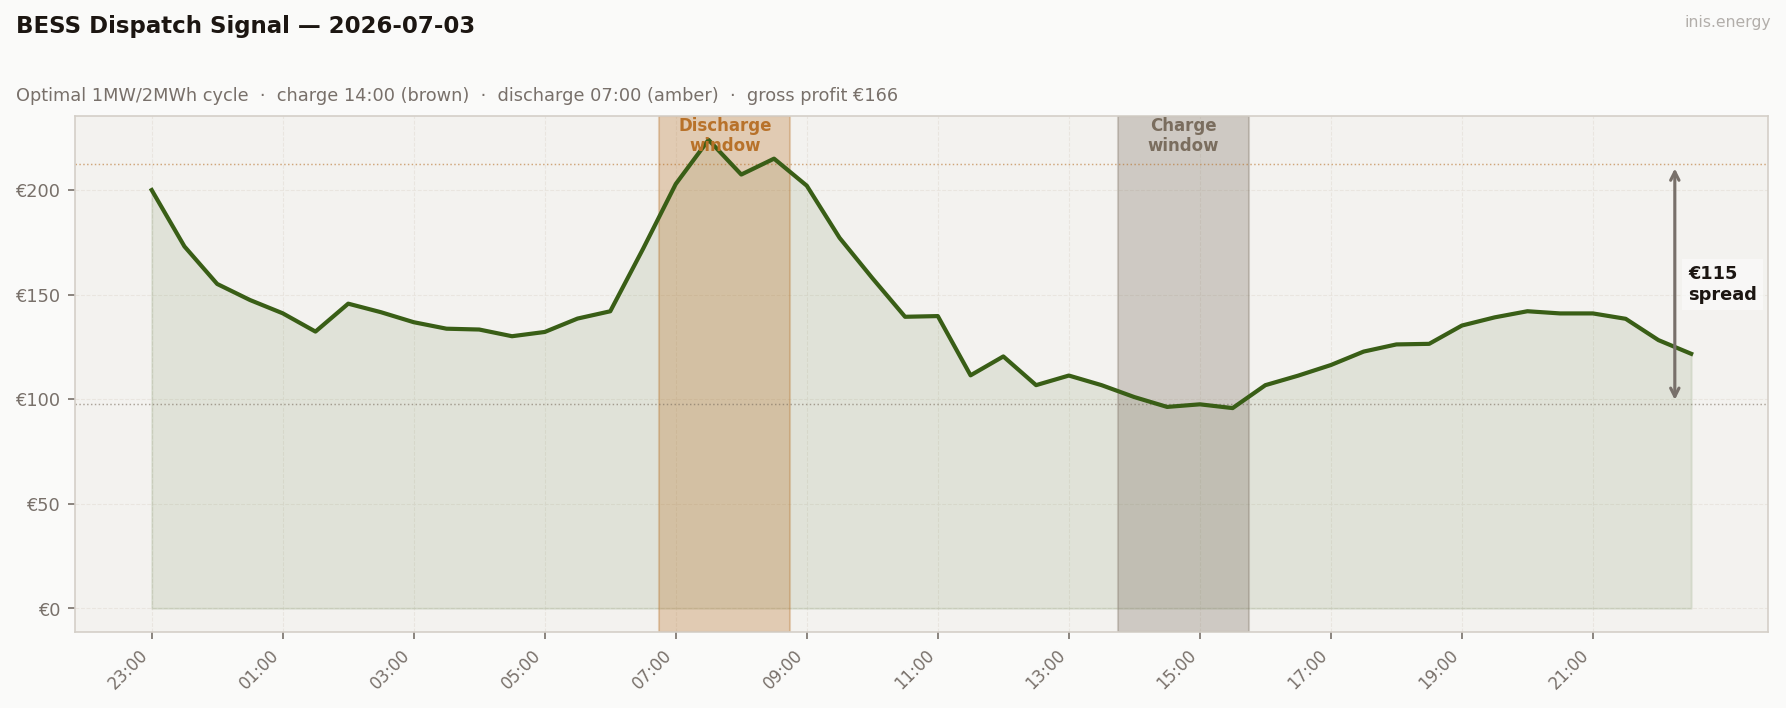
Updated 2026-08-27: the BESS simulation previously allowed the discharge window to occur before the charge window ended, which is physically impossible for a battery. This day’s figure was recalculated enforcing charge-before-discharge; gross profit corrected from €166 to €44.
Charged into the shallow afternoon trough (€98, 14:00), discharged into the evening peak (€141, 19:30) — the morning spike at €212 was higher, but it happened before the afternoon charge, so a same-day cycle couldn’t reach it. Gross €44, ROI 22.6% — the smallest spread of the week so far, because wind never gave the market a real floor to charge into and the only reachable peak was a modest one.
Commentary #
Friday was the low-wind day of the week — 44% was as high as it got, and it spent hours down at 8-9%. That persistent scarcity is what built the sharp €224 morning spike and kept the whole overnight period elevated above €130. There just wasn’t enough supply on the table to force a real floor anywhere.
It’s a useful contrast with Thursday. Same general shape — low wind overnight, some relief in the afternoon — but Thursday’s wind actually got up into the 60s and manufactured a €55 trough; Friday’s afternoon wind only reached the low 40s, so the trough stayed shallow at €96. Same story, half the amplitude.
Three very different Julys-so-far in three days. With the weekend coming, demand is about to become the bigger swing factor than wind.
Half-hourly data — 2026-07-03
| Period | Time | Price (€/MWh) | Wind % |
|---|---|---|---|
| 1 | 23:00 | 200.00 | 39.6% |
| 2 | 23:30 | 173.03 | 39.2% |
| 3 | 00:00 | 155.09 | 12.0% |
| 4 | 00:30 | 147.42 | 12.3% |
| 5 | 01:00 | 141.06 | 13.8% |
| 6 | 01:30 | 132.32 | 14.6% |
| 7 | 02:00 | 145.67 | 15.6% |
| 8 | 02:30 | 141.58 | 16.8% |
| 9 | 03:00 | 136.80 | 15.8% |
| 10 | 03:30 | 133.70 | 14.5% |
| 11 | 04:00 | 133.30 | 14.0% |
| 12 | 04:30 | 130.10 | 11.8% |
| 13 | 05:00 | 132.14 | 11.6% |
| 14 | 05:30 | 138.54 | 8.6% |
| 15 | 06:00 | 142.03 | 9.8% |
| 16 | 06:30 | 171.86 | 8.3% |
| 17 | 07:00 | 202.89 | 8.3% |
| 18 | 07:30 | 224.00 | 8.1% |
| 19 | 08:00 | 207.41 | 9.1% |
| 20 | 08:30 | 215.00 | 10.9% |
| 21 | 09:00 | 202.06 | 11.3% |
| 22 | 09:30 | 177.15 | 13.0% |
| 23 | 10:00 | 157.90 | 14.0% |
| 24 | 10:30 | 139.40 | 14.8% |
| 25 | 11:00 | 139.73 | 16.9% |
| 26 | 11:30 | 111.40 | 19.6% |
| 27 | 12:00 | 120.44 | 22.7% |
| 28 | 12:30 | 106.71 | 25.9% |
| 29 | 13:00 | 111.30 | 27.7% |
| 30 | 13:30 | 106.70 | 29.9% |
| 31 | 14:00 | 101.00 | 31.2% |
| 32 | 14:30 | 96.30 | 34.5% |
| 33 | 15:00 | 97.54 | 37.1% |
| 34 | 15:30 | 95.74 | 40.1% |
| 35 | 16:00 | 106.70 | 41.3% |
| 36 | 16:30 | 111.25 | 43.2% |
| 37 | 17:00 | 116.33 | 43.9% |
| 38 | 17:30 | 122.76 | 41.6% |
| 39 | 18:00 | 126.18 | 42.7% |
| 40 | 18:30 | 126.46 | 41.6% |
| 41 | 19:00 | 135.21 | 41.1% |
| 42 | 19:30 | 139.12 | 40.8% |
| 43 | 20:00 | 142.05 | 40.4% |
| 44 | 20:30 | 141.00 | 41.9% |
| 45 | 21:00 | 141.00 | 41.9% |
| 46 | 21:30 | 138.43 | 42.5% |
| 47 | 22:00 | 128.24 | 42.6% |
| 48 | 22:30 | 121.70 | 42.3% |
Compare your business electricity and gas rates in minutes with INIS Energy Brokers.
Compare rates