I-SEM Daily Briefing — 4 July 2026
Table of Contents
Market Snapshot
| Metric | Value |
|---|---|
| Mean DAM Price | €86.05/MWh |
| Median Price | €84.02/MWh |
| Std Dev | €57.58/MWh |
| Peak Price | €201.0/MWh (22:00) |
| Min Price | €9.46/MWh (13:30) |
| Price Range | €191.54/MWh |
| Periods above €150 | 8 of 48 (17%) |
| Periods above €200 | 1 of 48 (2%) |
| Peak Avg (07–22) | €64.12/MWh |
| Off-peak Avg (22–07) | €122.58/MWh |
| Peak/Off-Peak Spread | €-58.46/MWh |
| Wind % of Demand | 41.2% |
| Wind Range | 34.5%–46.4% |
| Mean Demand | 3537 MW |
Price Profile #
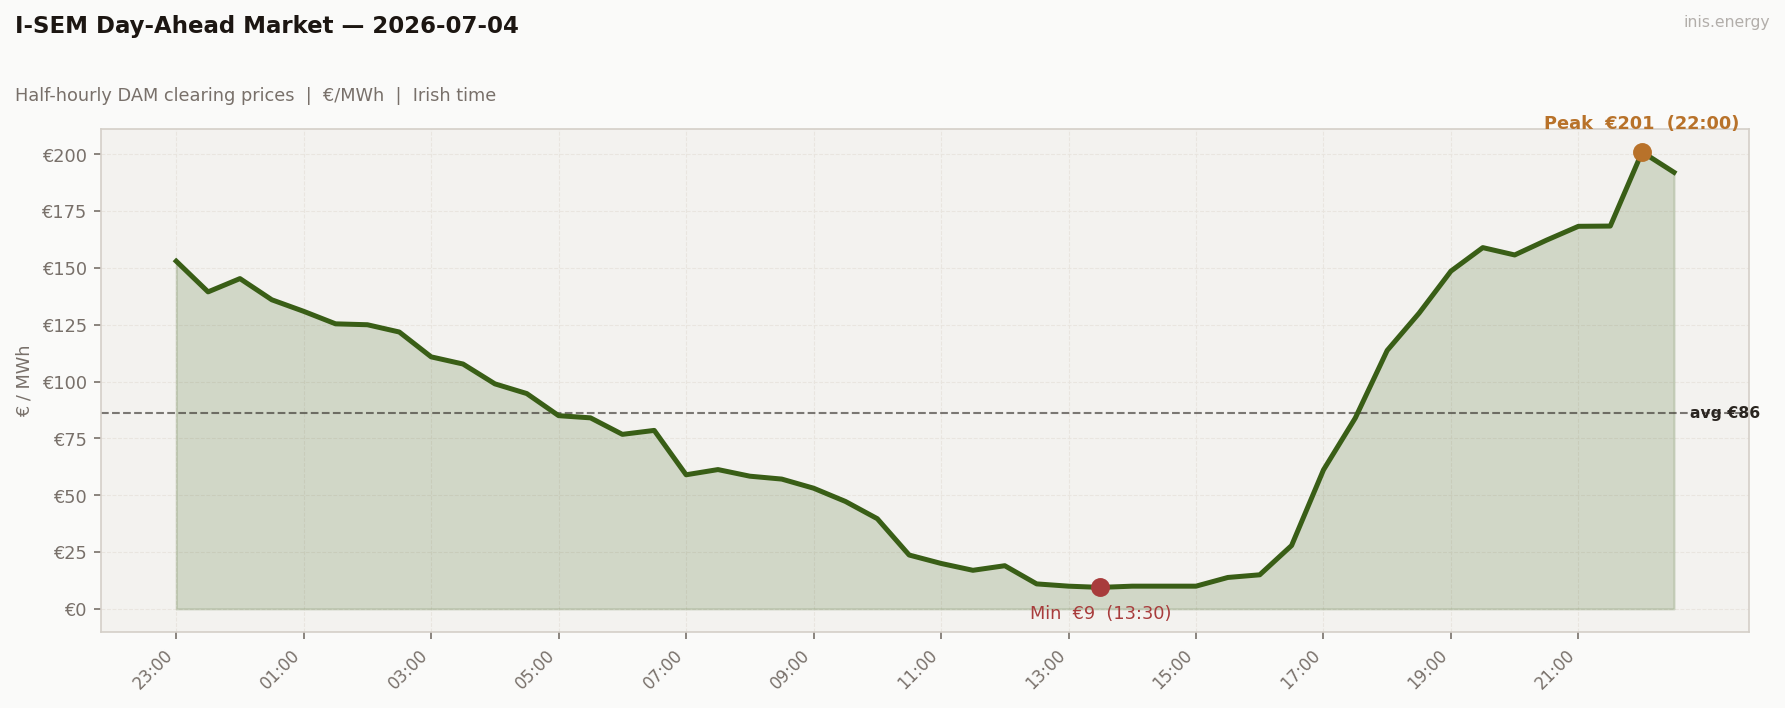
Std dev €57.58/MWh · Median €84.02/MWh · Periods above €150: 8 of 48 (17%)
Saturday, and wind barely moved all day — a tight 35-46% band, no crash, no glut. Yet price cratered to €9.46 at 13:30, essentially free power, before rocketing back to €201 by 22:00. Widest range of the week (€191.54) built almost entirely by demand, not wind.
Price vs Wind #
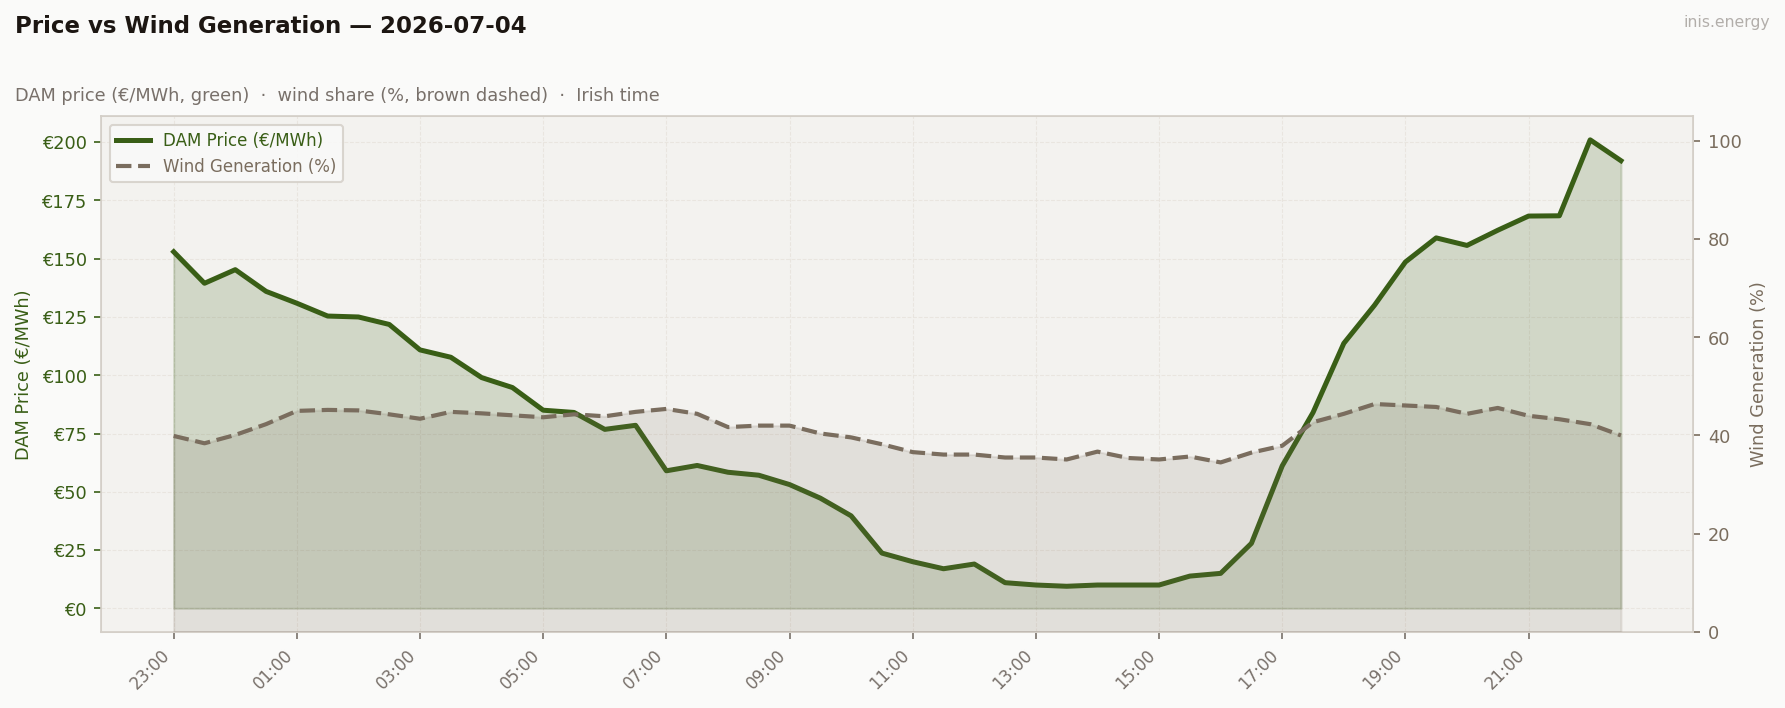
Mean wind: 41.2% · Range: 34.5%–46.4%
The exception that proves the rule. Wind stayed flat all day — this chart has none of the usual inverse shape because wind isn’t what’s moving. Weekend demand collapsing under steady wind supply did all the work here.
Week in Context #
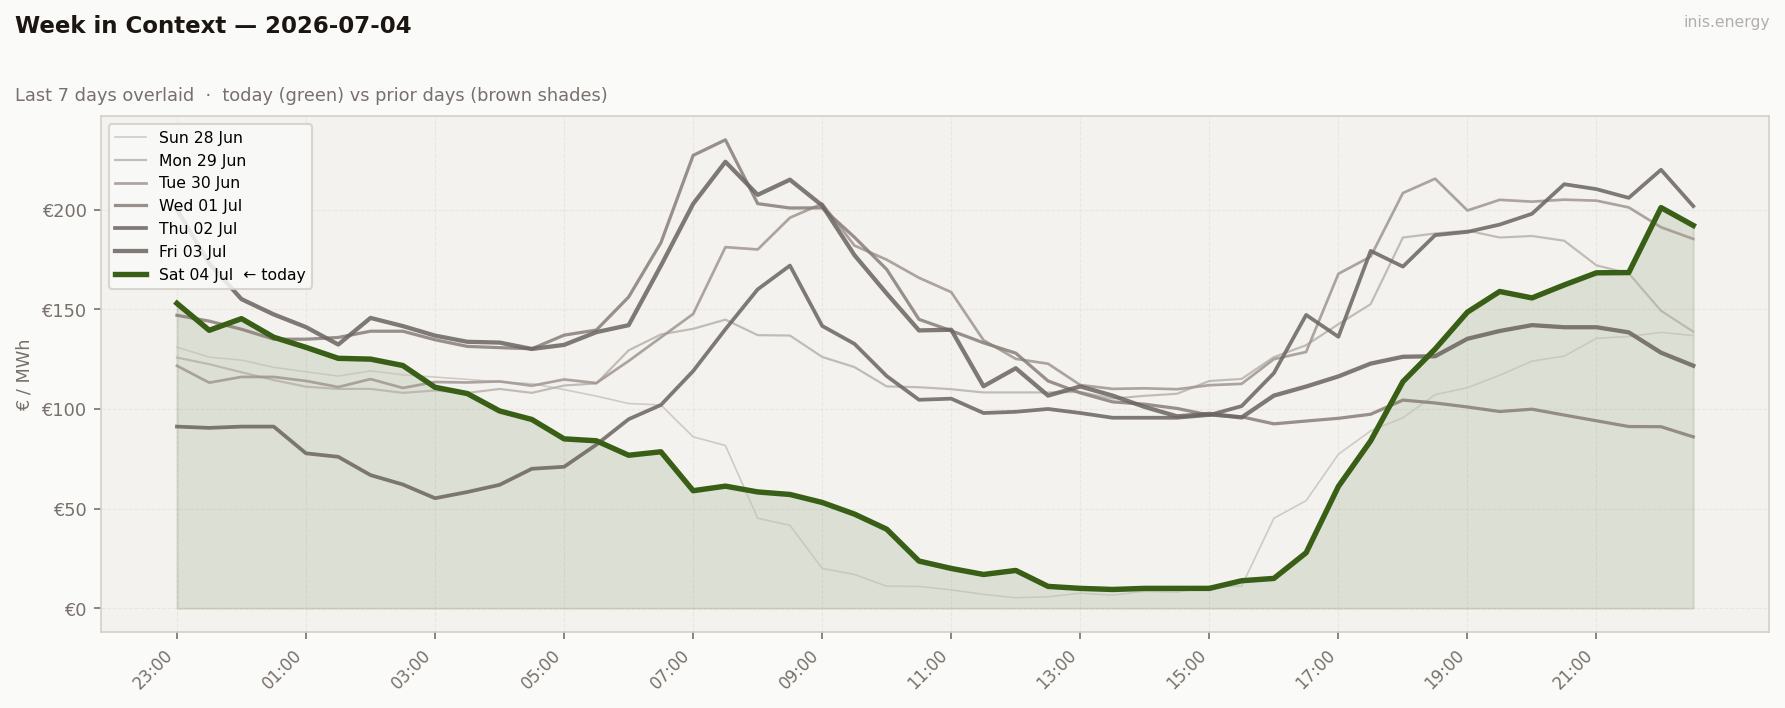
This is the extreme version of the pattern flagged back on Tuesday: the same wind level can produce a completely different market depending on demand. Weekday wind swings this week (Wed-Fri) never got below €82 at the trough; Saturday’s flat, moderate wind against collapsed weekend demand pushed price to near zero.
Price Duration Curve #
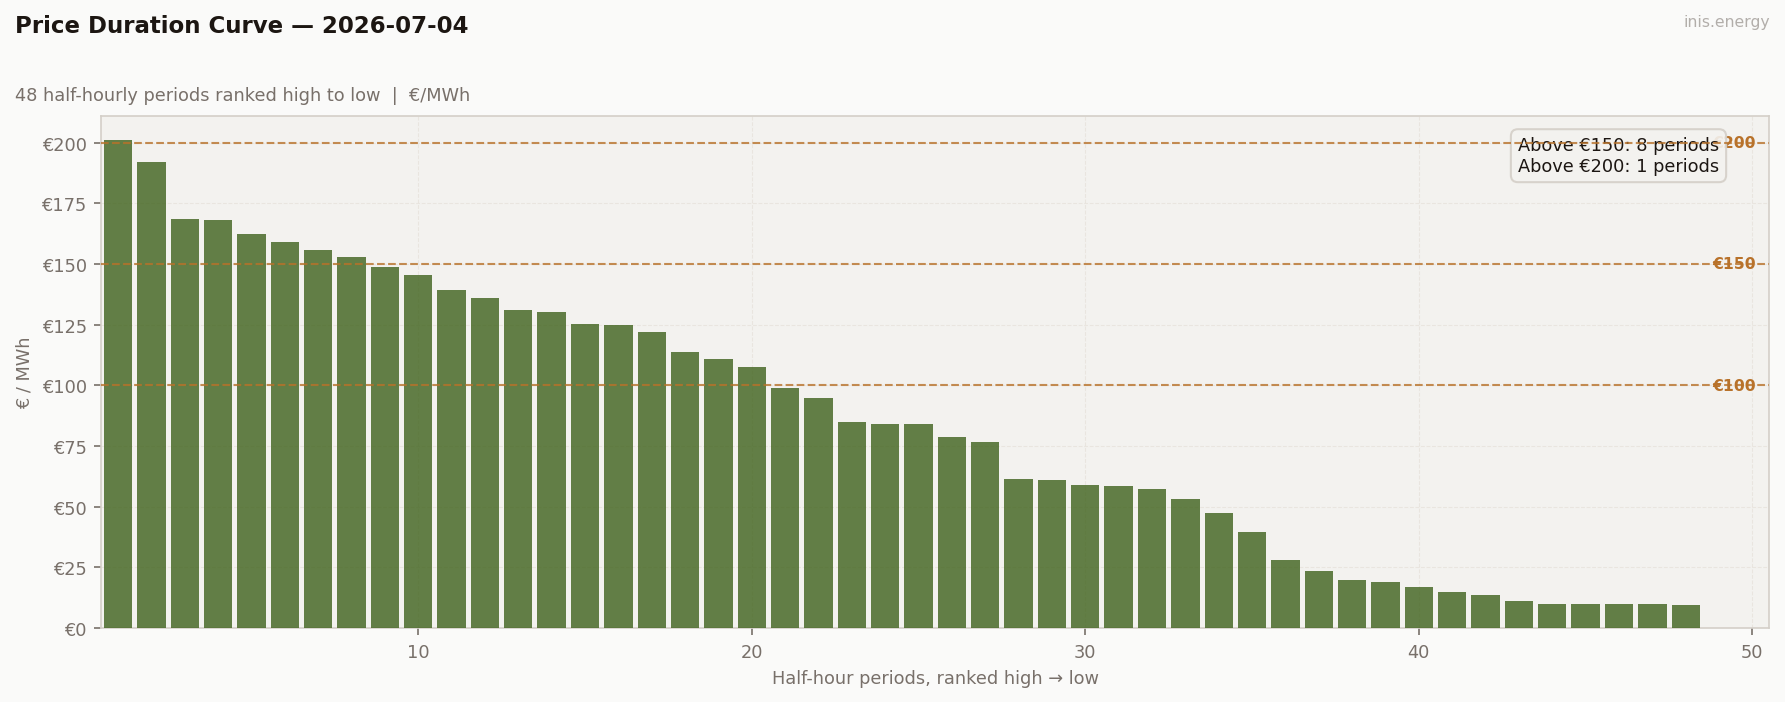
Periods above €150: 8 (17% of day) · Above €200: 1 (2% of day)
Flat and cheap for most of the day, one solitary spike above €200 in the evening — the flattest ceiling of the week outside of that single late ramp.
Peak / Off-Peak Spread #
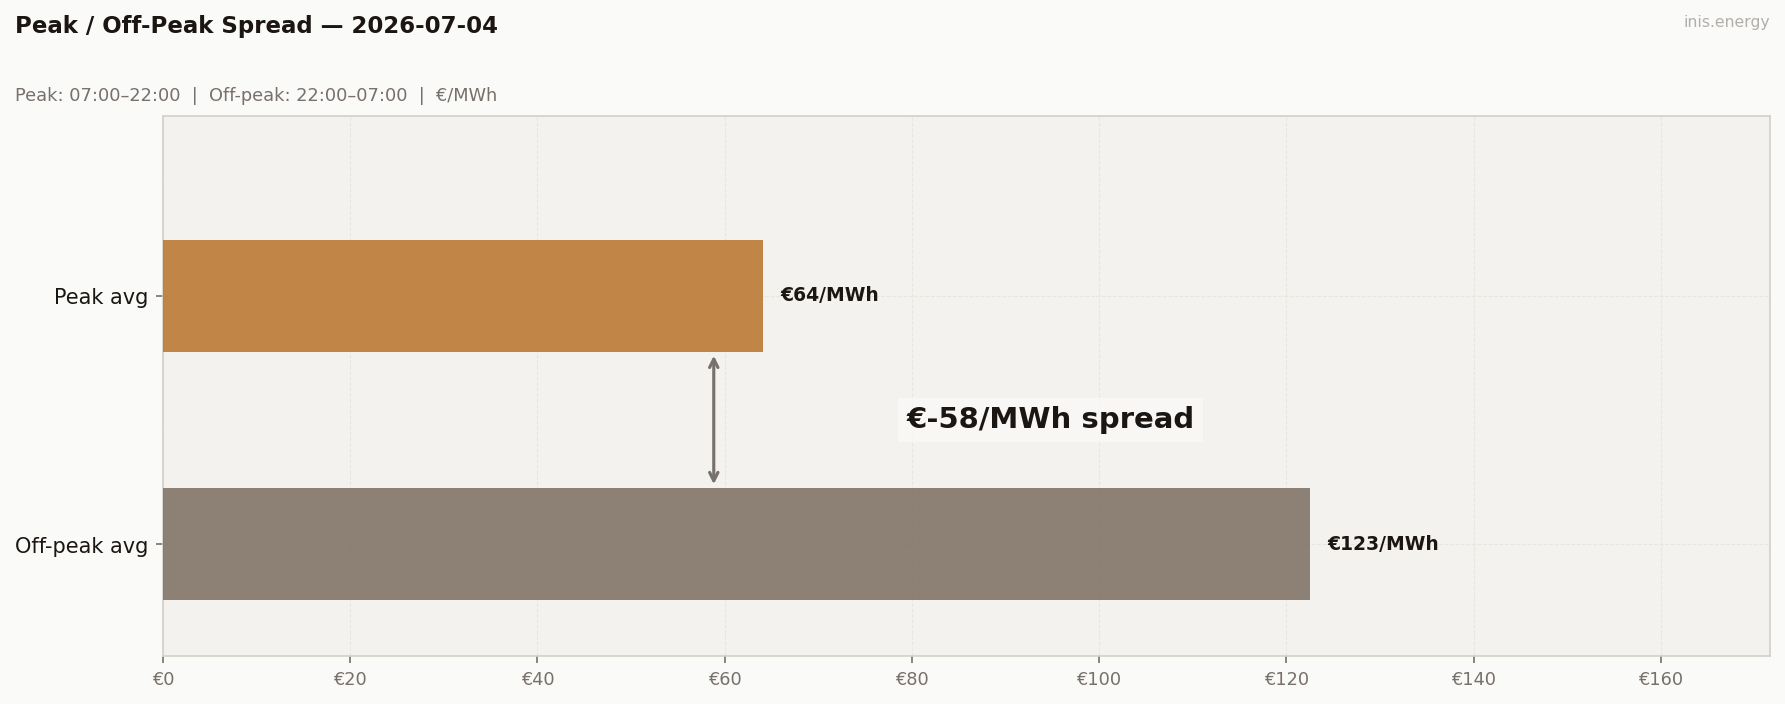
Peak avg (07:00–22:00): €64.12/MWh · Off-peak avg: €122.58/MWh · Spread: €-58.46/MWh
By far the widest negative spread of the week. The “peak” window is actually the cheapest part of the day, because weekend demand craters right in the middle of it while wind just sits there, unmoved.
BESS Dispatch Signal #
| Price | Time | Energy | Value | |
|---|---|---|---|---|
| Charge | €10/MWh | 13:00 | 2 MWh | −€20 |
| Discharge | €182/MWh | 21:00 | 1.7 MWh (85% RTE) | +€310 |
| Gross profit | €290 | |||
| Price spread | €173/MWh | ROI: 1472.0% |
Simulated 1MW/2MWh battery, one optimal DAM cycle. Gross before network charges and capacity costs.
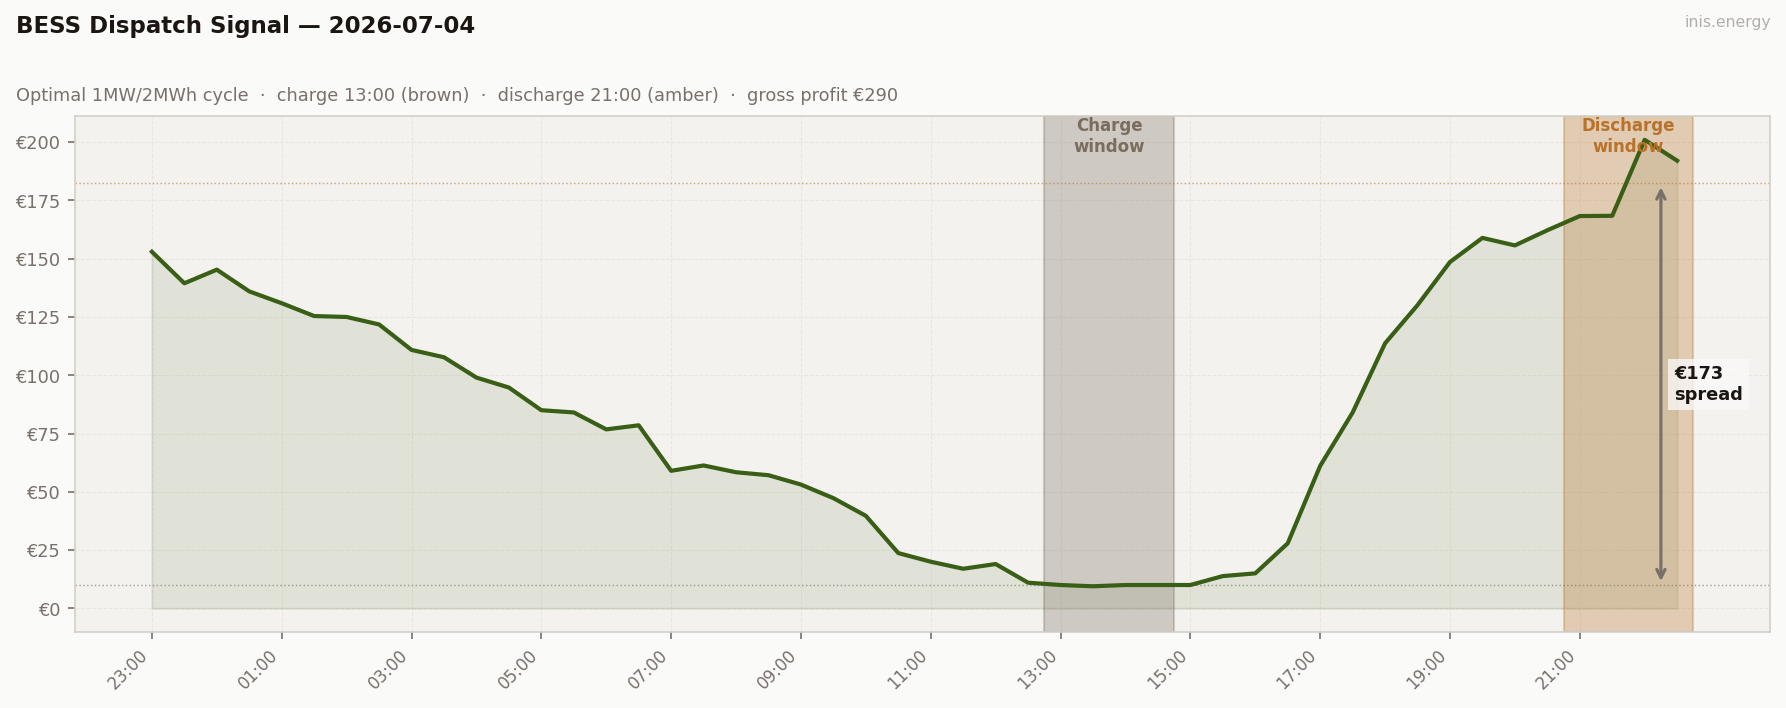
Charged at €10 (13:00), essentially free, discharged into the €182 evening squeeze (21:00). Gross €290, ROI 1472% — the best trade of the week by a mile, and it cost almost nothing to set up.
Commentary #
Saturday didn’t need a wind story — wind sat in a boring 35-46% band all day. The whole shape came from demand falling off a cliff at midday, the way it does every weekend, and steady wind supply having nowhere useful to go. €9.46 at 13:30 is about as close to free power as this market gets.
It’s the sharpest illustration yet of a point that’s come up all week: wind level alone doesn’t tell you the price. Timing against demand does. The exact same 40%-ish wind that built a modest afternoon trough on a weekday would have been unremarkable; against a collapsed Saturday midday it produced near-zero pricing and then a €201 evening spike once demand came back.
Cheap power in the middle of the day, sharp squeeze at night — about as clean a storage setup as you’ll see. Sunday next, and it’s usually a quieter version of the same story.
Half-hourly data — 2026-07-04
| Period | Time | Price (€/MWh) | Wind % |
|---|---|---|---|
| 1 | 23:00 | 152.97 | 39.9% |
| 2 | 23:30 | 139.46 | 38.4% |
| 3 | 00:00 | 145.30 | 40.1% |
| 4 | 00:30 | 135.98 | 42.3% |
| 5 | 01:00 | 130.90 | 45.0% |
| 6 | 01:30 | 125.40 | 45.2% |
| 7 | 02:00 | 125.00 | 45.1% |
| 8 | 02:30 | 121.80 | 44.3% |
| 9 | 03:00 | 110.87 | 43.4% |
| 10 | 03:30 | 107.72 | 44.8% |
| 11 | 04:00 | 99.00 | 44.5% |
| 12 | 04:30 | 94.73 | 44.1% |
| 13 | 05:00 | 85.00 | 43.7% |
| 14 | 05:30 | 84.04 | 44.3% |
| 15 | 06:00 | 76.78 | 43.9% |
| 16 | 06:30 | 78.52 | 44.8% |
| 17 | 07:00 | 59.00 | 45.4% |
| 18 | 07:30 | 61.29 | 44.4% |
| 19 | 08:00 | 58.38 | 41.7% |
| 20 | 08:30 | 57.11 | 42.0% |
| 21 | 09:00 | 53.10 | 42.0% |
| 22 | 09:30 | 47.27 | 40.4% |
| 23 | 10:00 | 39.68 | 39.6% |
| 24 | 10:30 | 23.70 | 38.2% |
| 25 | 11:00 | 20.00 | 36.6% |
| 26 | 11:30 | 16.98 | 36.1% |
| 27 | 12:00 | 19.00 | 36.1% |
| 28 | 12:30 | 11.00 | 35.5% |
| 29 | 13:00 | 10.00 | 35.5% |
| 30 | 13:30 | 9.46 | 35.1% |
| 31 | 14:00 | 10.00 | 36.7% |
| 32 | 14:30 | 10.00 | 35.4% |
| 33 | 15:00 | 10.00 | 35.1% |
| 34 | 15:30 | 13.83 | 35.7% |
| 35 | 16:00 | 15.00 | 34.5% |
| 36 | 16:30 | 27.88 | 36.5% |
| 37 | 17:00 | 61.13 | 37.9% |
| 38 | 17:30 | 84.00 | 42.7% |
| 39 | 18:00 | 113.70 | 44.4% |
| 40 | 18:30 | 130.09 | 46.4% |
| 41 | 19:00 | 148.59 | 46.1% |
| 42 | 19:30 | 158.93 | 45.8% |
| 43 | 20:00 | 155.70 | 44.4% |
| 44 | 20:30 | 162.21 | 45.6% |
| 45 | 21:00 | 168.30 | 44.0% |
| 46 | 21:30 | 168.41 | 43.3% |
| 47 | 22:00 | 201.00 | 42.3% |
| 48 | 22:30 | 192.05 | 40.0% |
Compare your business electricity and gas rates in minutes with INIS Energy Brokers.
Compare rates