I-SEM Daily Briefing — 5 July 2026
Table of Contents
Market Snapshot
| Metric | Value |
|---|---|
| Mean DAM Price | €124.92/MWh |
| Median Price | €129.9/MWh |
| Std Dev | €22.71/MWh |
| Peak Price | €169.16/MWh (22:00) |
| Min Price | €82.21/MWh (15:00) |
| Price Range | €86.95/MWh |
| Periods above €150 | 5 of 48 (10%) |
| Periods above €200 | 0 of 48 (0%) |
| Peak Avg (07–22) | €119.2/MWh |
| Off-peak Avg (22–07) | €134.45/MWh |
| Peak/Off-Peak Spread | €-15.25/MWh |
| Wind % of Demand | 26.2% |
| Wind Range | 20.1%–36.0% |
| Mean Demand | 3447 MW |
Price Profile #
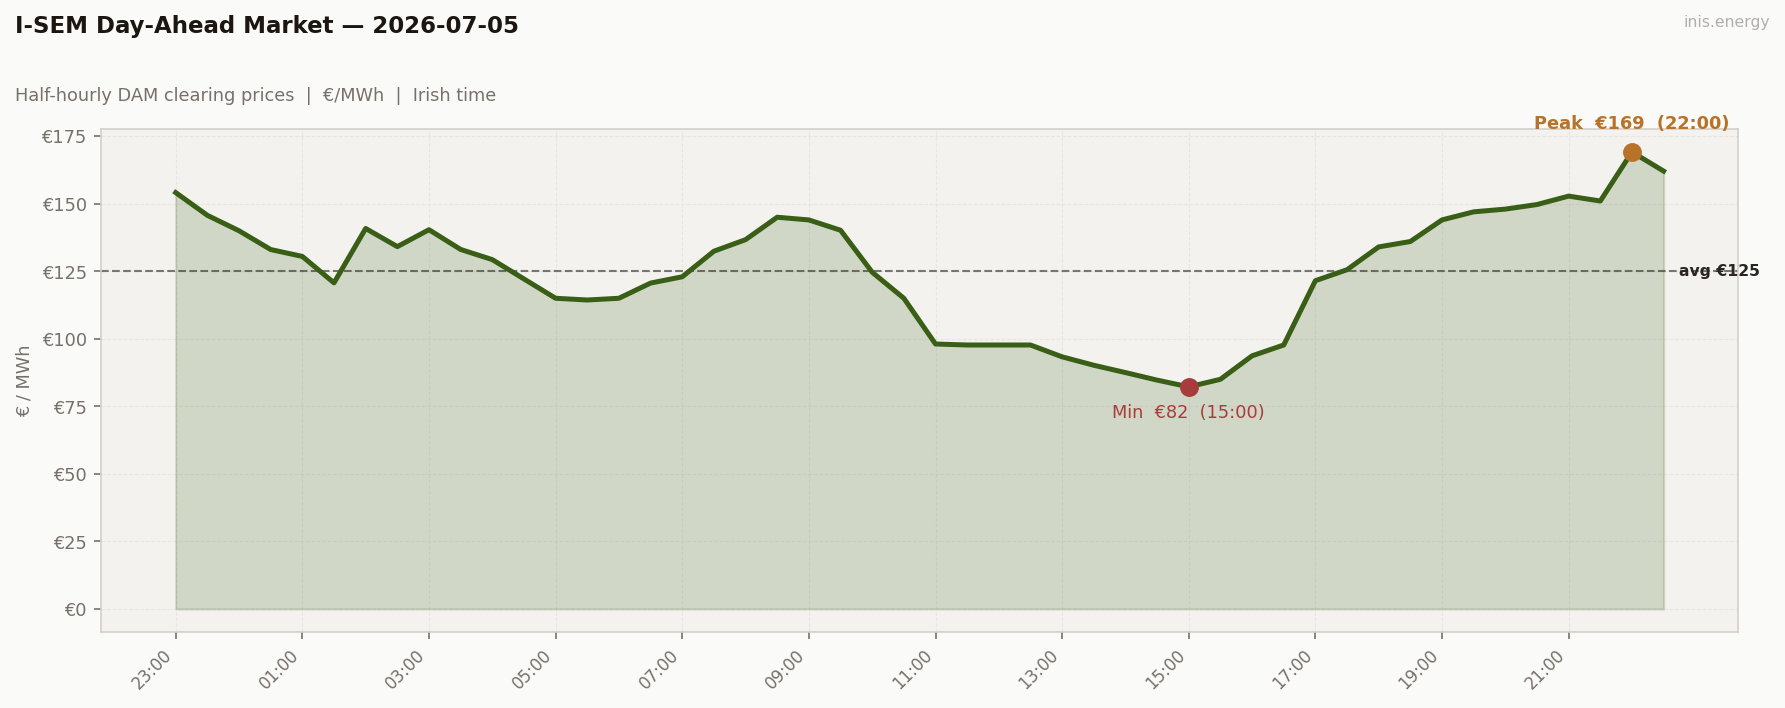
Std dev €22.71/MWh · Median €129.9/MWh · Periods above €150: 5 of 48 (10%)
Quietest day of the week by a distance. Wind stayed in a narrow 20-36% band, never spiking, never collapsing, and price followed suit — a gentle overnight drift down, a modest €82 trough mid-afternoon, a mild evening ramp to a muted €169 peak. No scarcity, no glut, just Sunday.
Price vs Wind #
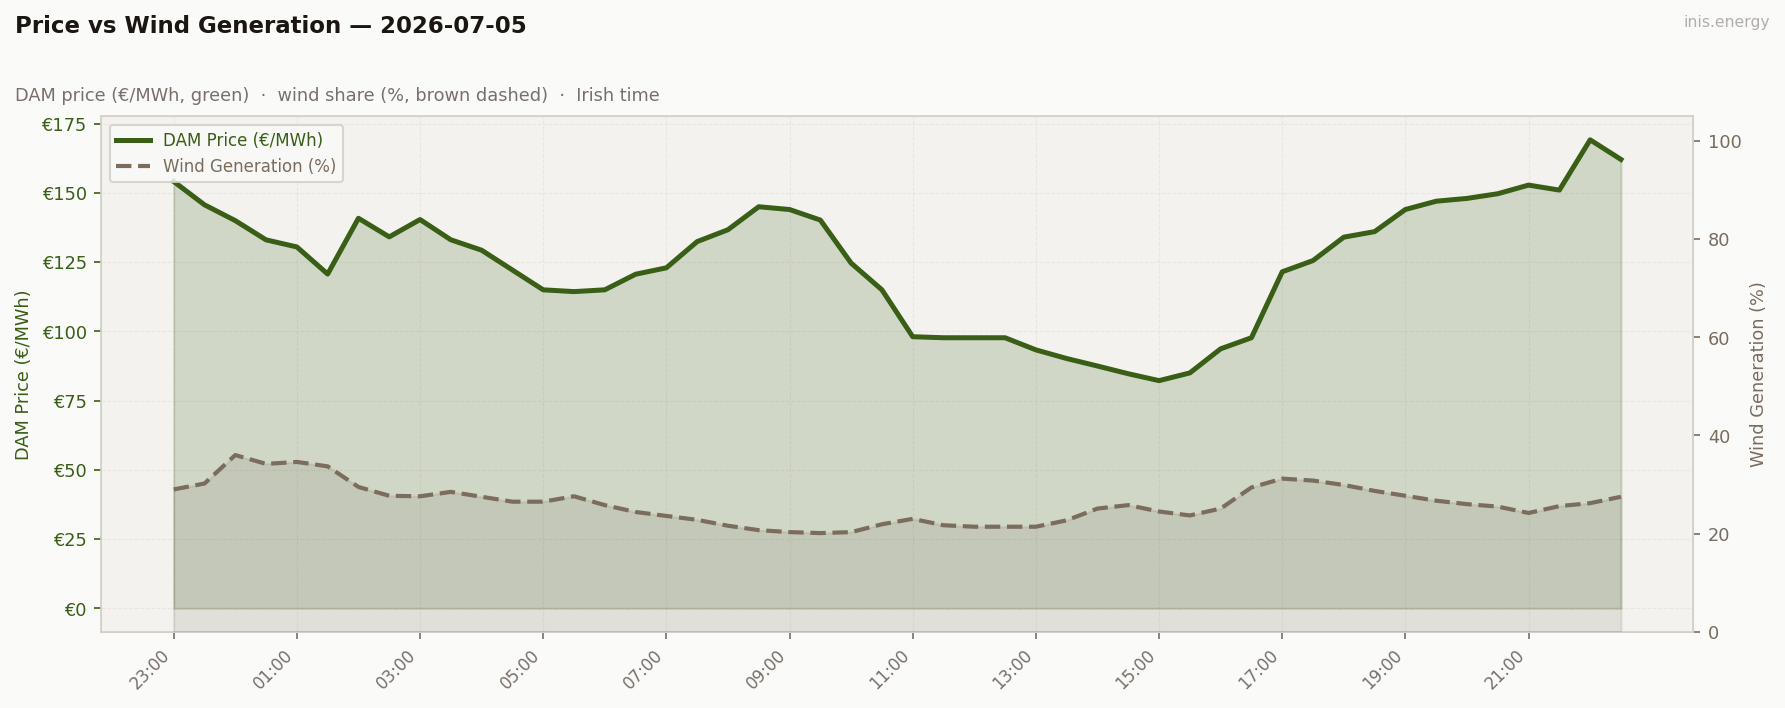
Mean wind: 26.2% · Range: 20.1%–36.0%
Narrow wind range, narrow price range. There’s no dramatic cause-effect swing to point at here — wind wasn’t doing much, and with Sunday demand soft too, nothing pushed price to either extreme.
Week in Context #
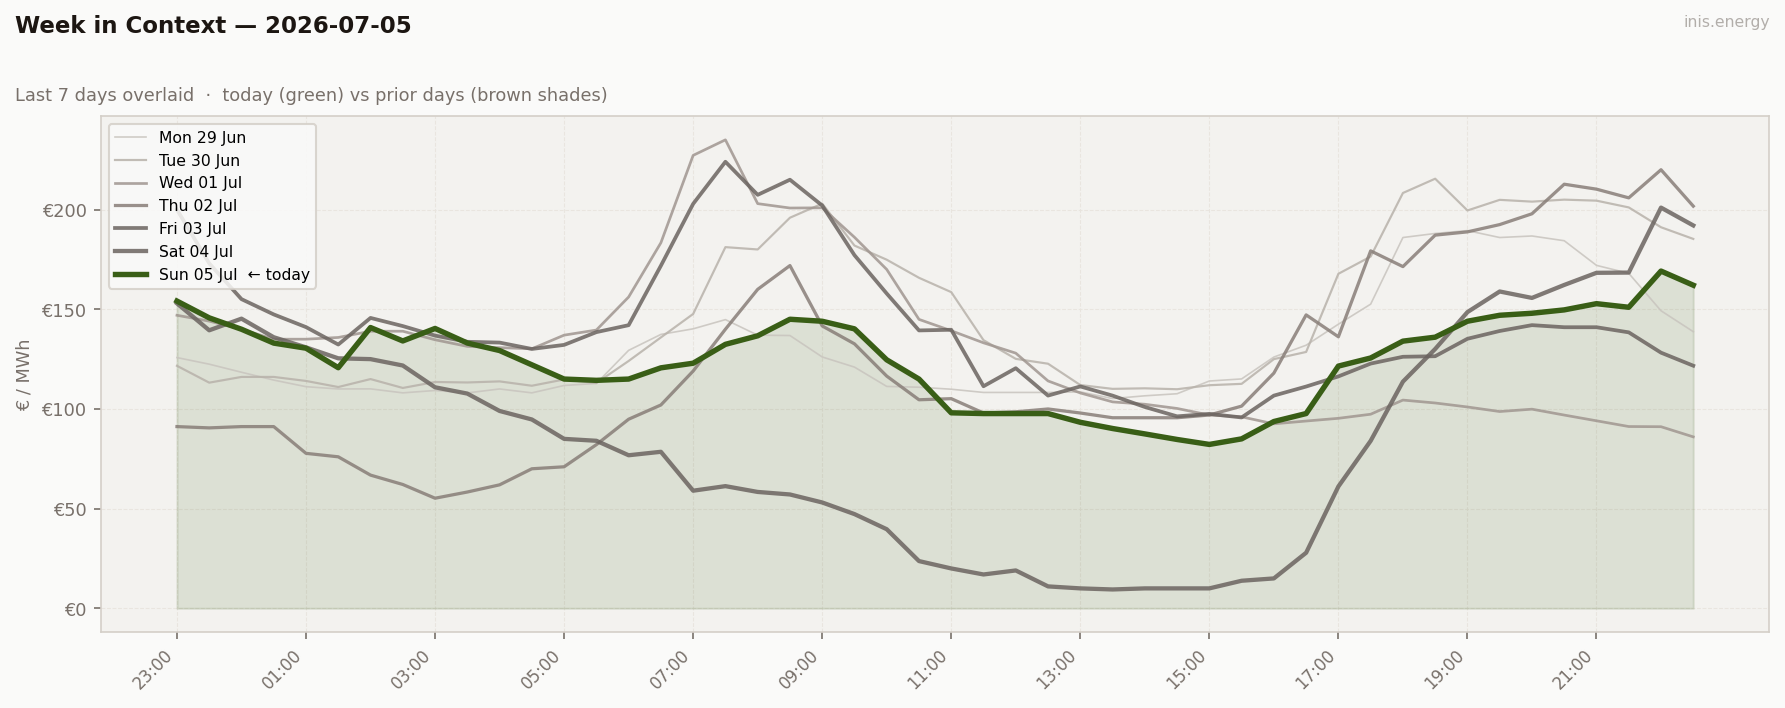
The calmest close to five wild days. Lowest std dev, lowest peak, narrowest range of the week — a soft landing after Saturday’s swing from €9 to €201. Same weekend demand pattern, but without Saturday’s flat-wind extreme to amplify it.
Price Duration Curve #
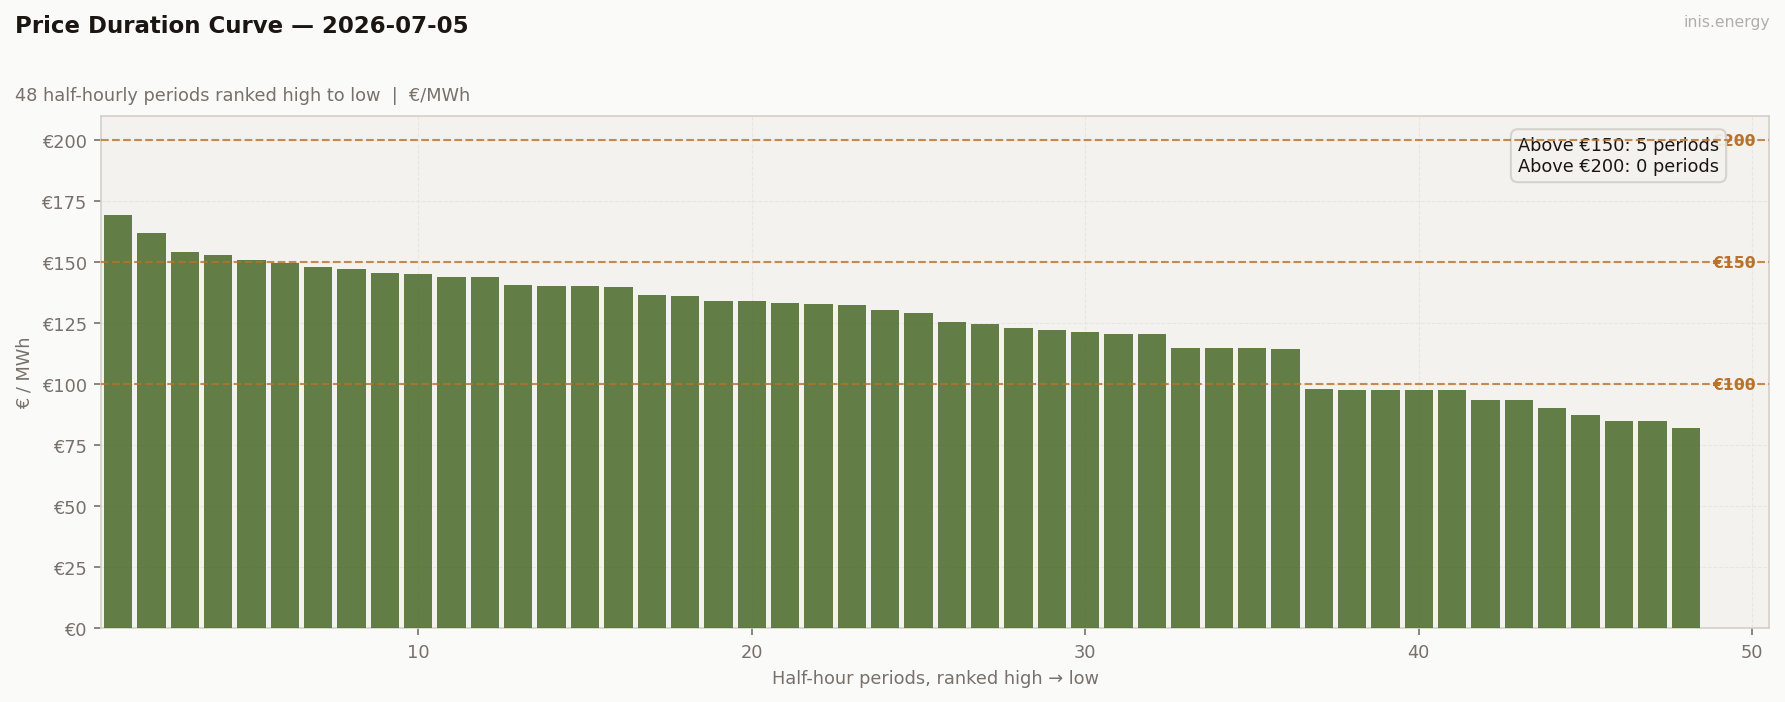
Periods above €150: 5 (10% of day) · Above €200: 0 (0% of day)
Flattest ceiling of the week — not a single period above €200. The whole day sat in a tight, unremarkable band.
Peak / Off-Peak Spread #
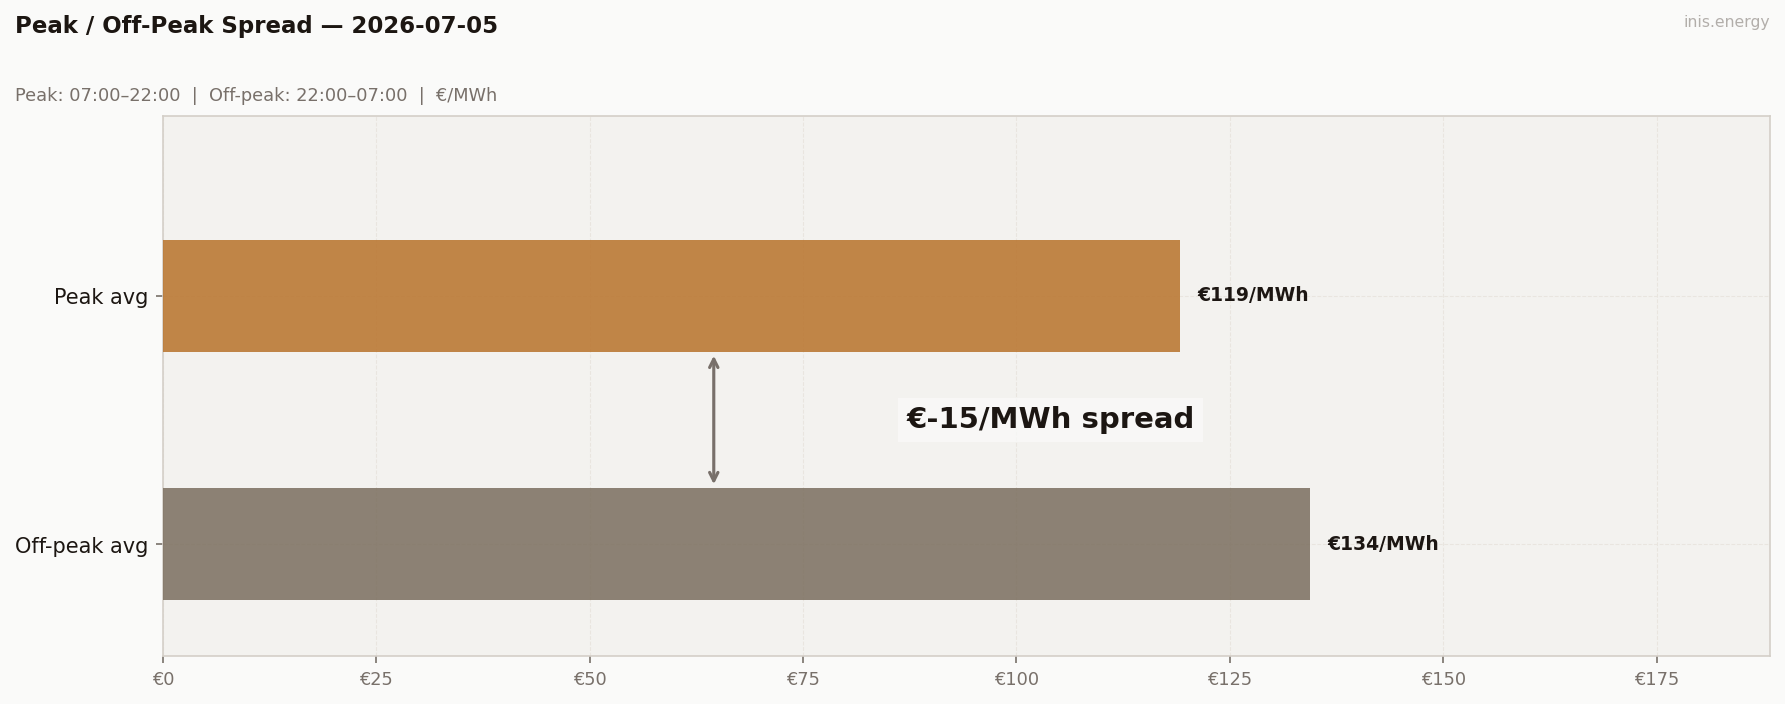
Peak avg (07:00–22:00): €119.2/MWh · Off-peak avg: €134.45/MWh · Spread: €-15.25/MWh
Off-peak still runs above peak, same low-wind-pre-dawn pattern seen most of this week, just smaller in magnitude than any other day.
BESS Dispatch Signal #
| Price | Time | Energy | Value | |
|---|---|---|---|---|
| Charge | €85/MWh | 14:00 | 2 MWh | −€170 |
| Discharge | €159/MWh | 21:00 | 1.7 MWh (85% RTE) | +€270 |
| Gross profit | €100 | |||
| Price spread | €74/MWh | ROI: 59.0% |
Simulated 1MW/2MWh battery, one optimal DAM cycle. Gross before network charges and capacity costs.
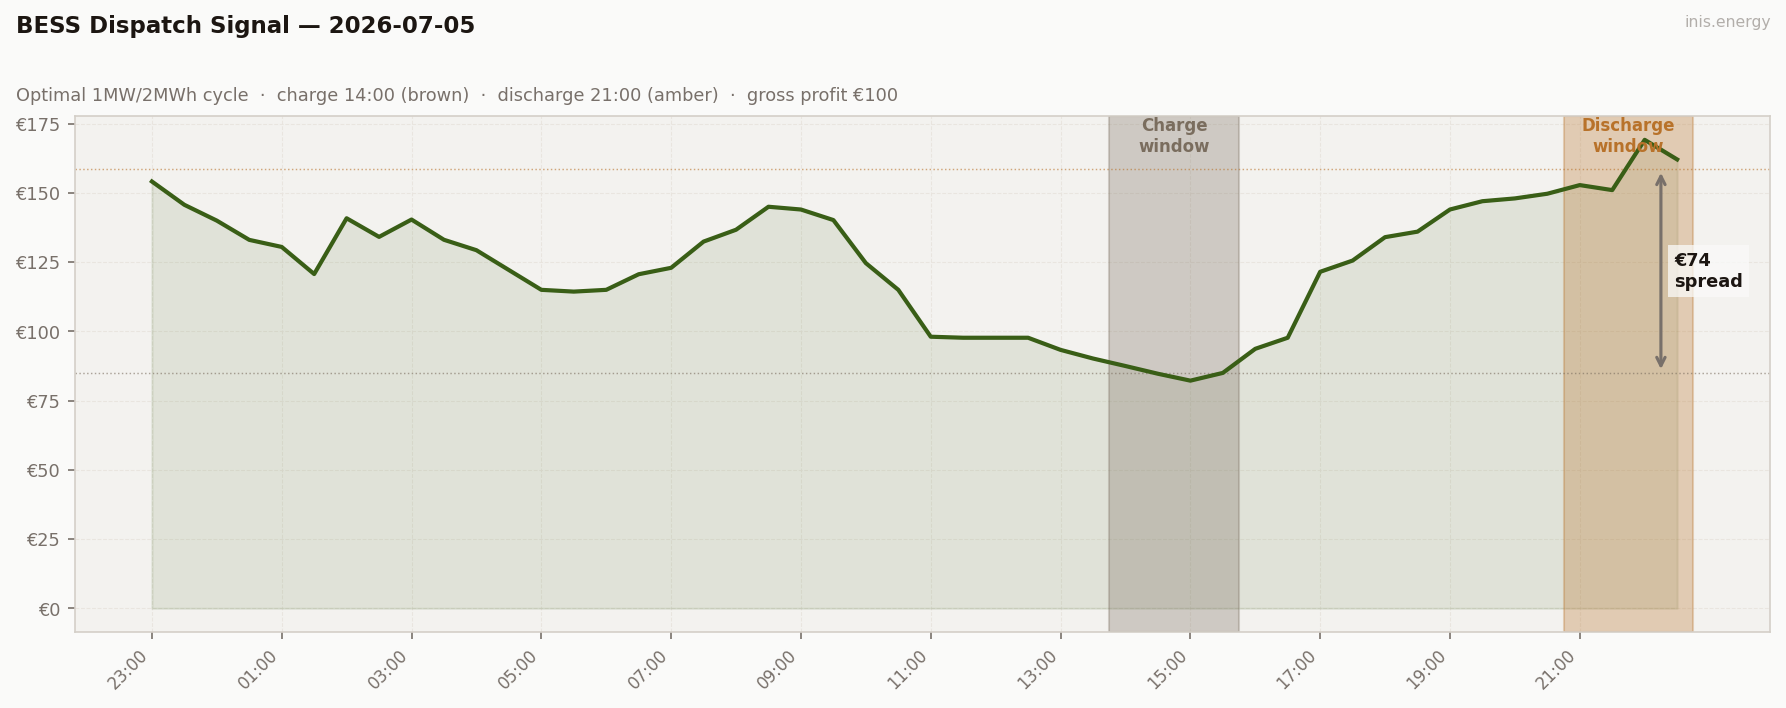
Charged at €85 (14:00), discharged at €159 (21:00). Gross €100, ROI 59% — smallest trade of the week. Thin spread, quiet market, nothing to arbitrage against.
Commentary #
Sunday closed out one of the more varied weeks the DAM has served up in a while — Wednesday’s overnight wind whipsaw, Thursday’s slow bleed to a late peak, Friday’s persistent low-wind squeeze, Saturday’s near-zero midday collapse under flat wind and dead demand. Sunday had none of that. Wind stayed in a tight band, demand stayed soft, and price never left a comfortable middle ground.
It’s a reminder that the wildest days this week weren’t really about wind extremes on their own — they needed wind and demand to misalign in a specific way. Sunday, both stayed calm together, so nothing amplified.
A quiet finish before the working week resumes and demand comes back with it.
Half-hourly data — 2026-07-05
| Period | Time | Price (€/MWh) | Wind % |
|---|---|---|---|
| 1 | 23:00 | 154.12 | 29.0% |
| 2 | 23:30 | 145.70 | 30.2% |
| 3 | 00:00 | 139.99 | 36.0% |
| 4 | 00:30 | 133.04 | 34.2% |
| 5 | 01:00 | 130.49 | 34.6% |
| 6 | 01:30 | 120.70 | 33.7% |
| 7 | 02:00 | 140.84 | 29.5% |
| 8 | 02:30 | 134.12 | 27.7% |
| 9 | 03:00 | 140.38 | 27.6% |
| 10 | 03:30 | 133.07 | 28.5% |
| 11 | 04:00 | 129.31 | 27.5% |
| 12 | 04:30 | 122.15 | 26.5% |
| 13 | 05:00 | 115.00 | 26.5% |
| 14 | 05:30 | 114.36 | 27.6% |
| 15 | 06:00 | 115.00 | 25.8% |
| 16 | 06:30 | 120.63 | 24.4% |
| 17 | 07:00 | 122.95 | 23.6% |
| 18 | 07:30 | 132.42 | 22.8% |
| 19 | 08:00 | 136.70 | 21.6% |
| 20 | 08:30 | 145.00 | 20.7% |
| 21 | 09:00 | 144.00 | 20.3% |
| 22 | 09:30 | 140.19 | 20.1% |
| 23 | 10:00 | 124.65 | 20.3% |
| 24 | 10:30 | 115.00 | 21.9% |
| 25 | 11:00 | 98.07 | 23.0% |
| 26 | 11:30 | 97.70 | 21.7% |
| 27 | 12:00 | 97.70 | 21.4% |
| 28 | 12:30 | 97.70 | 21.4% |
| 29 | 13:00 | 93.32 | 21.4% |
| 30 | 13:30 | 90.20 | 22.7% |
| 31 | 14:00 | 87.49 | 25.1% |
| 32 | 14:30 | 84.70 | 25.8% |
| 33 | 15:00 | 82.21 | 24.5% |
| 34 | 15:30 | 85.00 | 23.7% |
| 35 | 16:00 | 93.70 | 25.1% |
| 36 | 16:30 | 97.70 | 29.4% |
| 37 | 17:00 | 121.51 | 31.2% |
| 38 | 17:30 | 125.57 | 30.8% |
| 39 | 18:00 | 134.02 | 29.9% |
| 40 | 18:30 | 136.01 | 28.7% |
| 41 | 19:00 | 144.01 | 27.7% |
| 42 | 19:30 | 147.00 | 26.7% |
| 43 | 20:00 | 148.01 | 26.0% |
| 44 | 20:30 | 149.70 | 25.5% |
| 45 | 21:00 | 152.82 | 24.2% |
| 46 | 21:30 | 151.01 | 25.6% |
| 47 | 22:00 | 169.16 | 26.2% |
| 48 | 22:30 | 162.08 | 27.5% |
Compare your business electricity and gas rates in minutes with INIS Energy Brokers.
Compare rates