I-SEM Daily Briefing — 6 July 2026
Table of Contents
Market Snapshot
| Metric | Value |
|---|---|
| Mean DAM Price | €139.26/MWh |
| Median Price | €132.27/MWh |
| Std Dev | €27.56/MWh |
| Peak Price | €195.0/MWh (21:30) |
| Min Price | €110.0/MWh (15:00) |
| Price Range | €85.0/MWh |
| Periods above €150 | 17 of 48 (35%) |
| Periods above €200 | 0 of 48 (0%) |
| Peak Avg (07–22) | €145.89/MWh |
| Off-peak Avg (22–07) | €128.22/MWh |
| Peak/Off-Peak Spread | €17.67/MWh |
| Wind % of Demand | 28.8% |
| Wind Range | 22.8%–39.1% |
| Mean Demand | 3728 MW |
Price Profile #
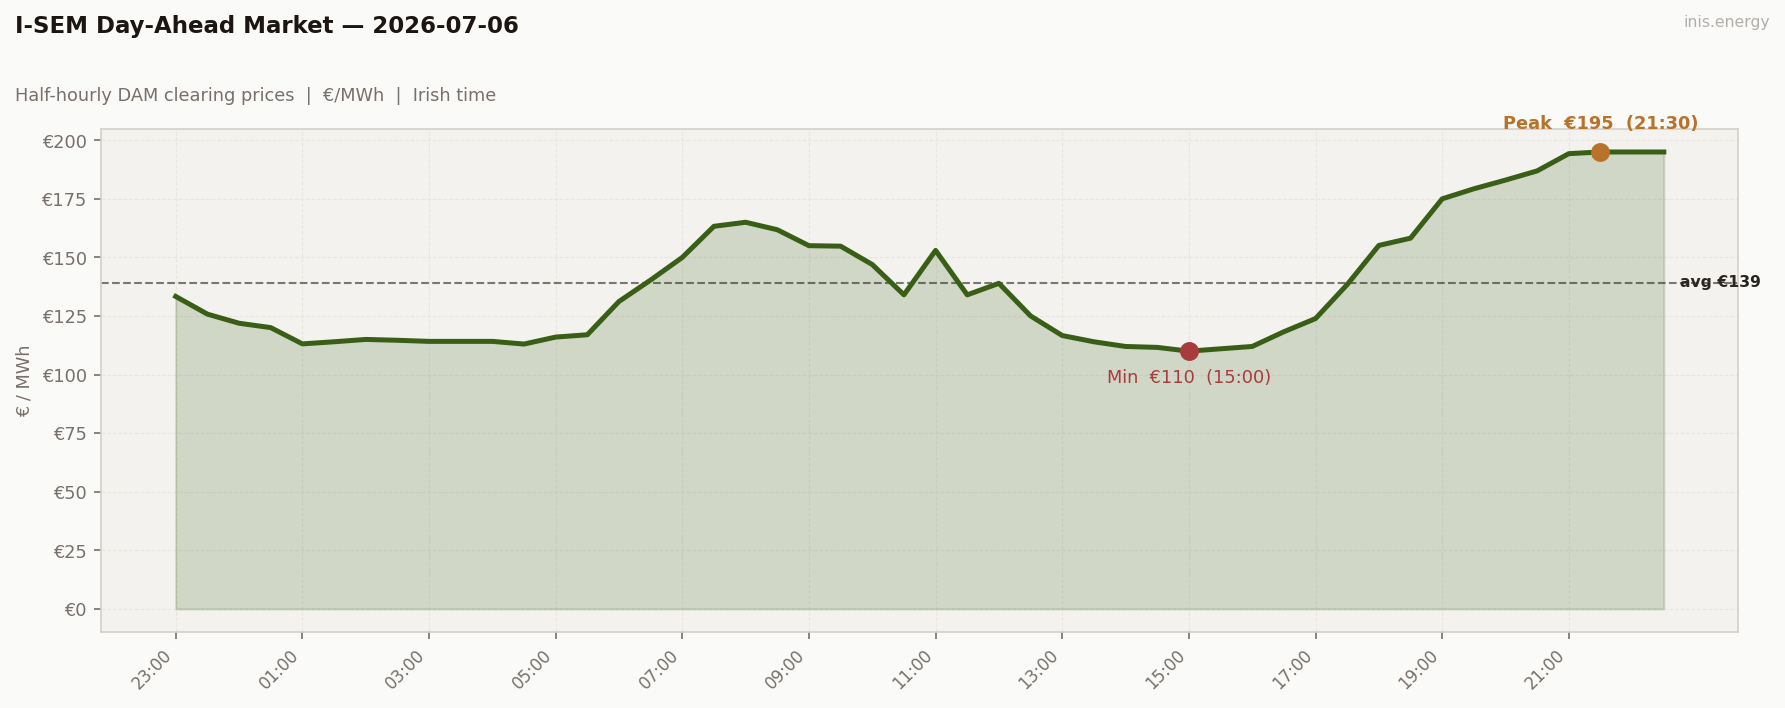
Std dev €27.56/MWh · Median €132.27/MWh · Periods above €150: 17 of 48 (35%)
Wind held a moderate 23–39% band all day — never crashing, never flooding — and price built one steady ramp instead of a spike. Overnight wind near 39% kept price down around €113–120. It climbed through the 06:00 morning ramp, dipped again through midday as wind ticked back up, then ran unbroken through the evening to a €195 peak at 21:30. No scarcity shock, just a grind upward.
Price vs Wind #
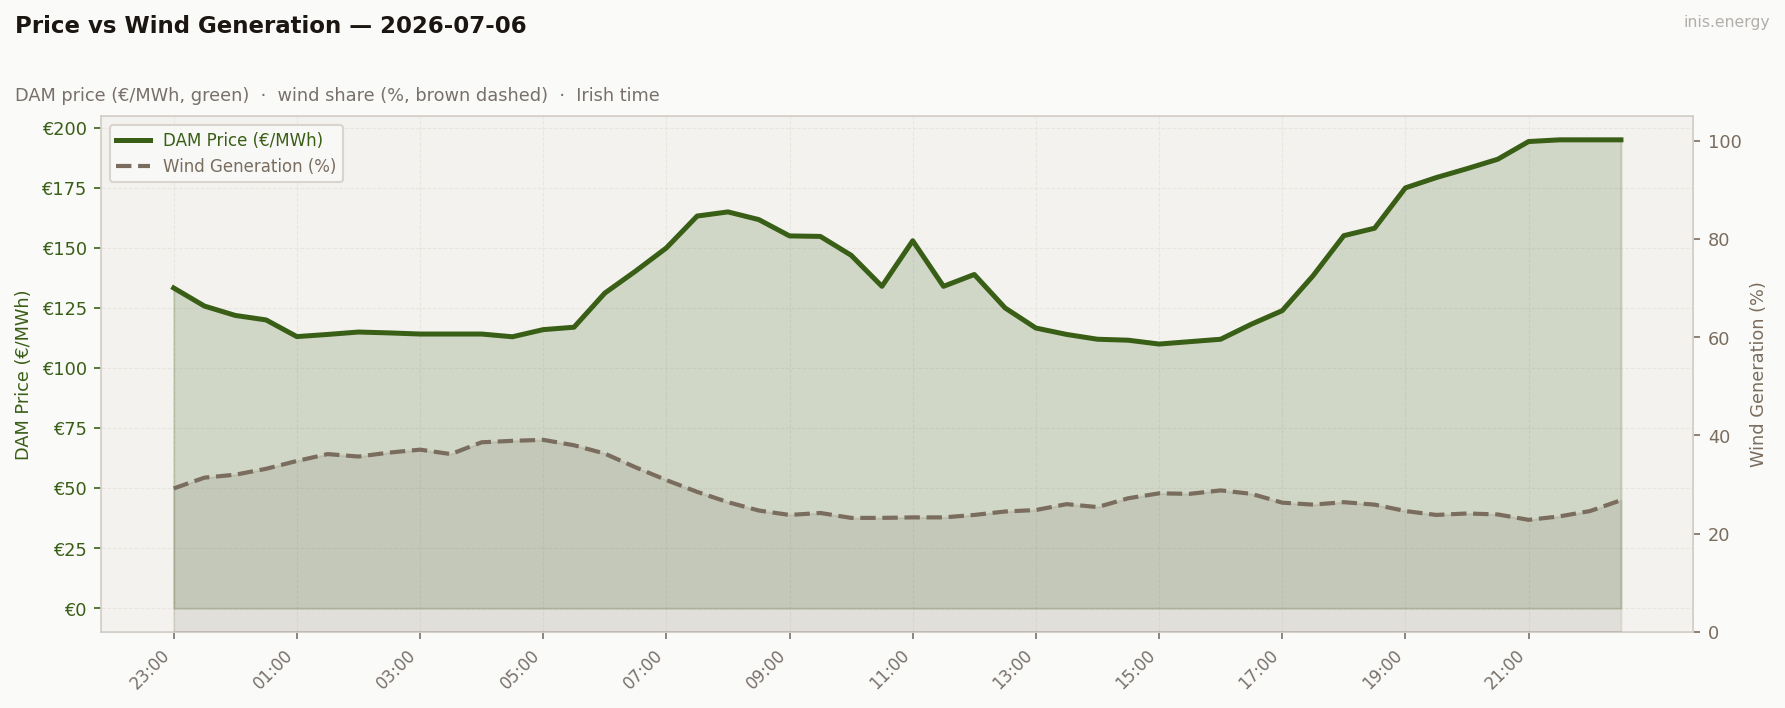
Mean wind: 28.8% · Range: 22.8%–39.1%
A narrow wind range makes for a clean wind-to-price relationship — the cleanest of the week so far. Wind falling through the evening (28%→23%) tracks almost period-for-period with price climbing from €123 to €195.
Week in Context #
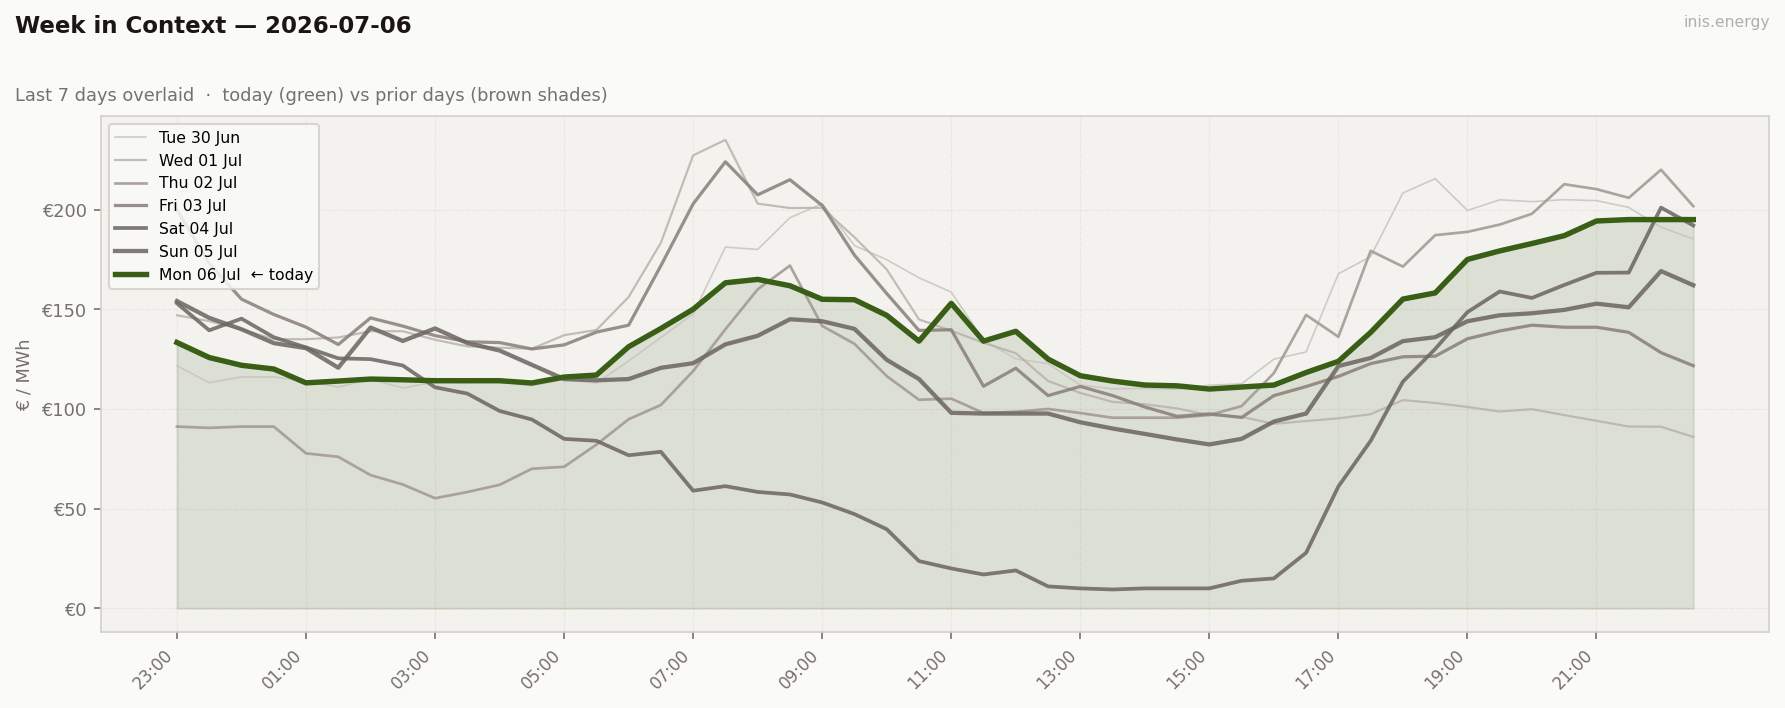
A calmer open than most of last week’s swings. After Sunday’s tight, unremarkable band, Monday brings back a real evening ramp — but a controlled one, capped well short of €200, not a Wednesday-style whipsaw.
Price Duration Curve #
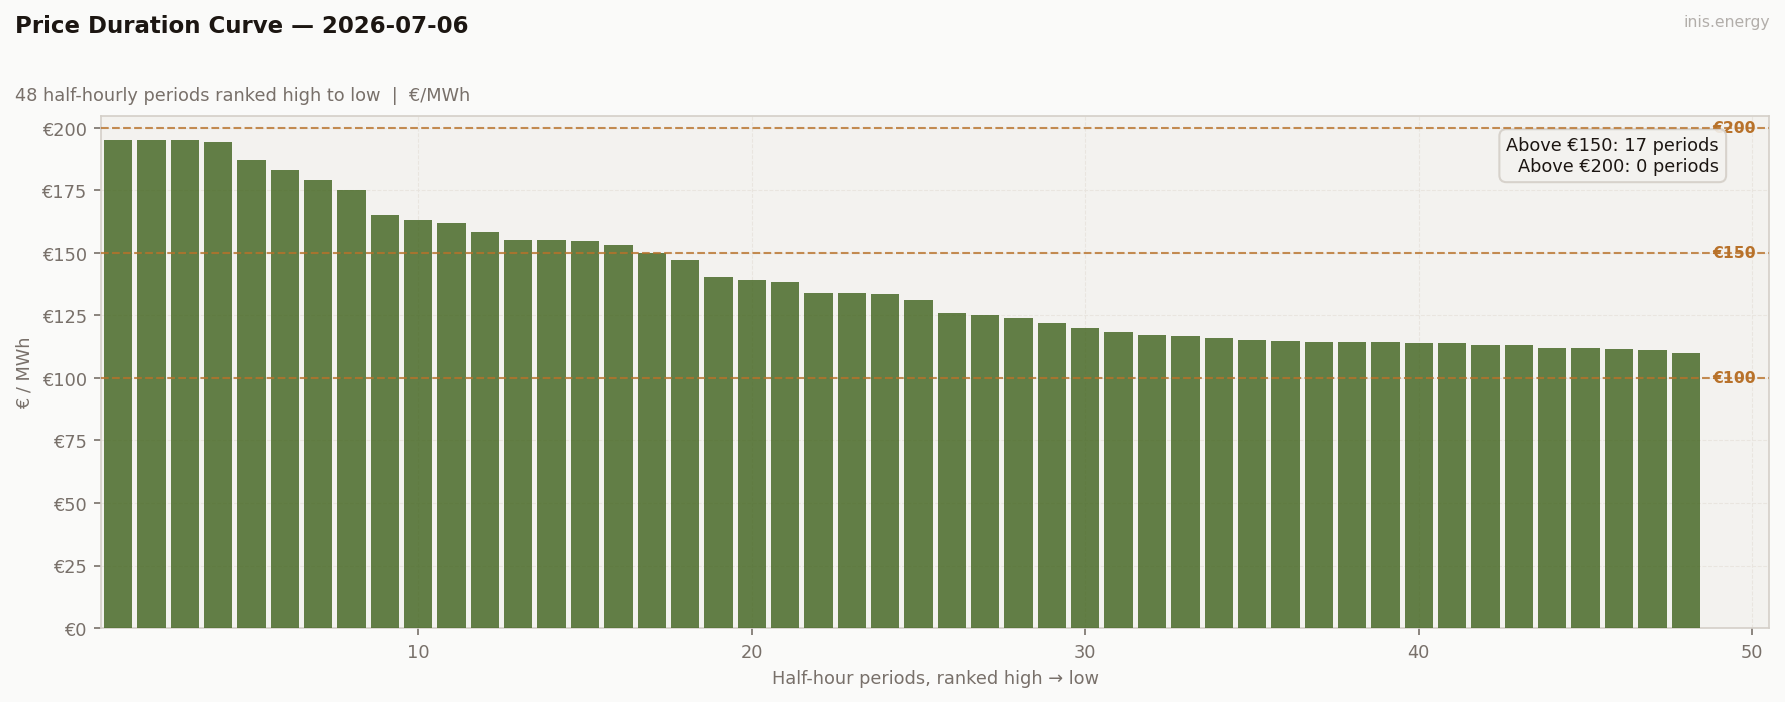
Periods above €150: 17 (35% of day) · Above €200: 0 (0% of day)
Peak / Off-Peak Spread #
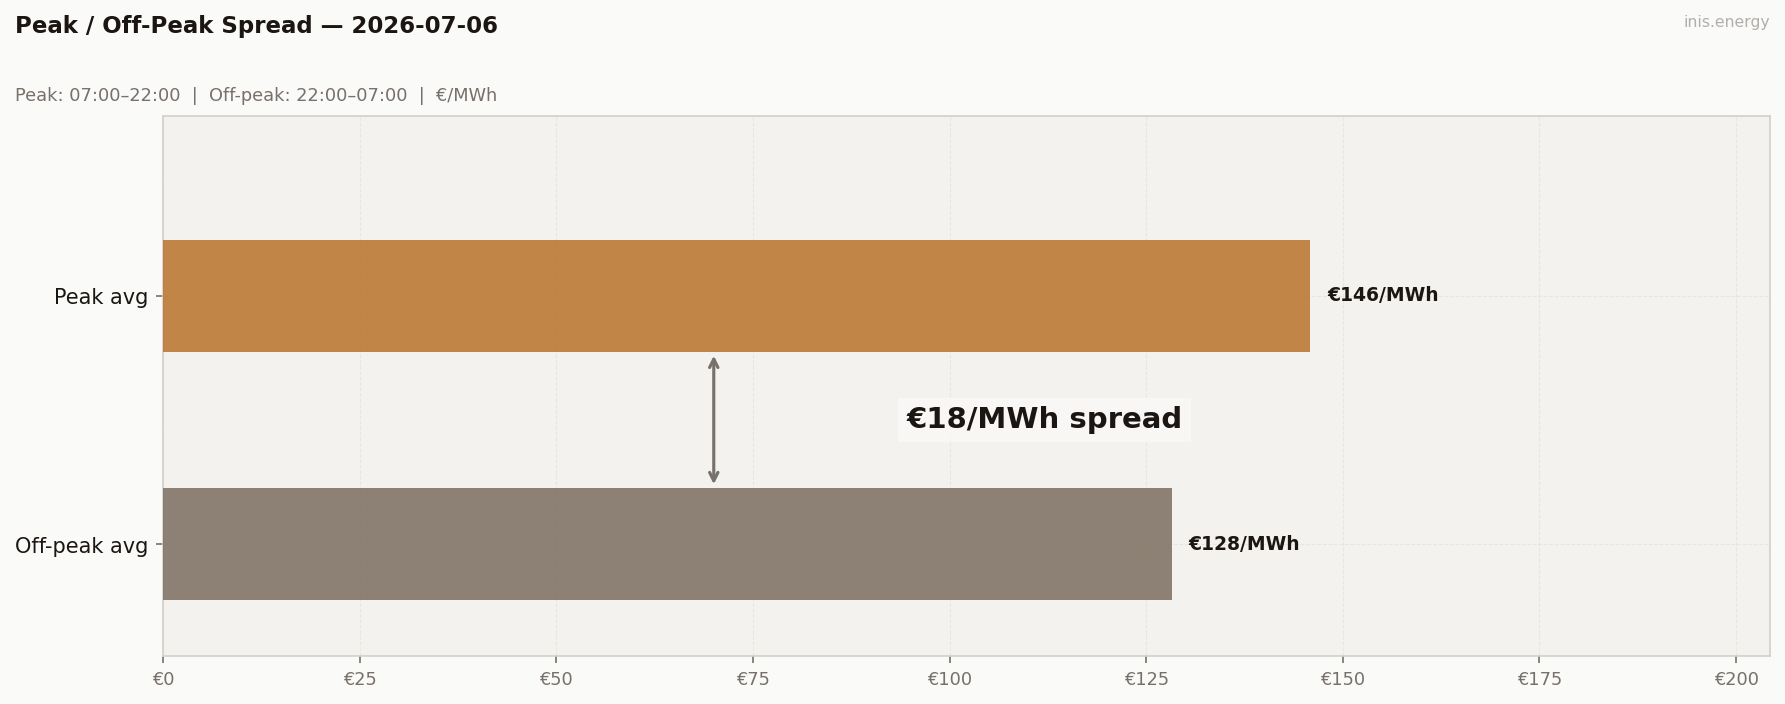
Peak avg (07:00–22:00): €145.89/MWh · Off-peak avg: €128.22/MWh · Spread: €17.67/MWh
Normal shape restored — peak beats off-peak, first positive spread in a while. Evening demand plus the gradual evening wind fade did the work; no overnight low-wind stretch or afternoon glut around to flip it this time.
BESS Dispatch Signal #
| Price | Time | Energy | Value | |
|---|---|---|---|---|
| Charge | €111/MWh | 14:00 | 2 MWh | −€222 |
| Discharge | €195/MWh | 21:00 | 1.7 MWh (85% RTE) | +€331 |
| Gross profit | €109 | |||
| Price spread | €84/MWh | ROI: 49.0% |
Simulated 1MW/2MWh battery, one optimal DAM cycle. Gross before network charges and capacity costs.
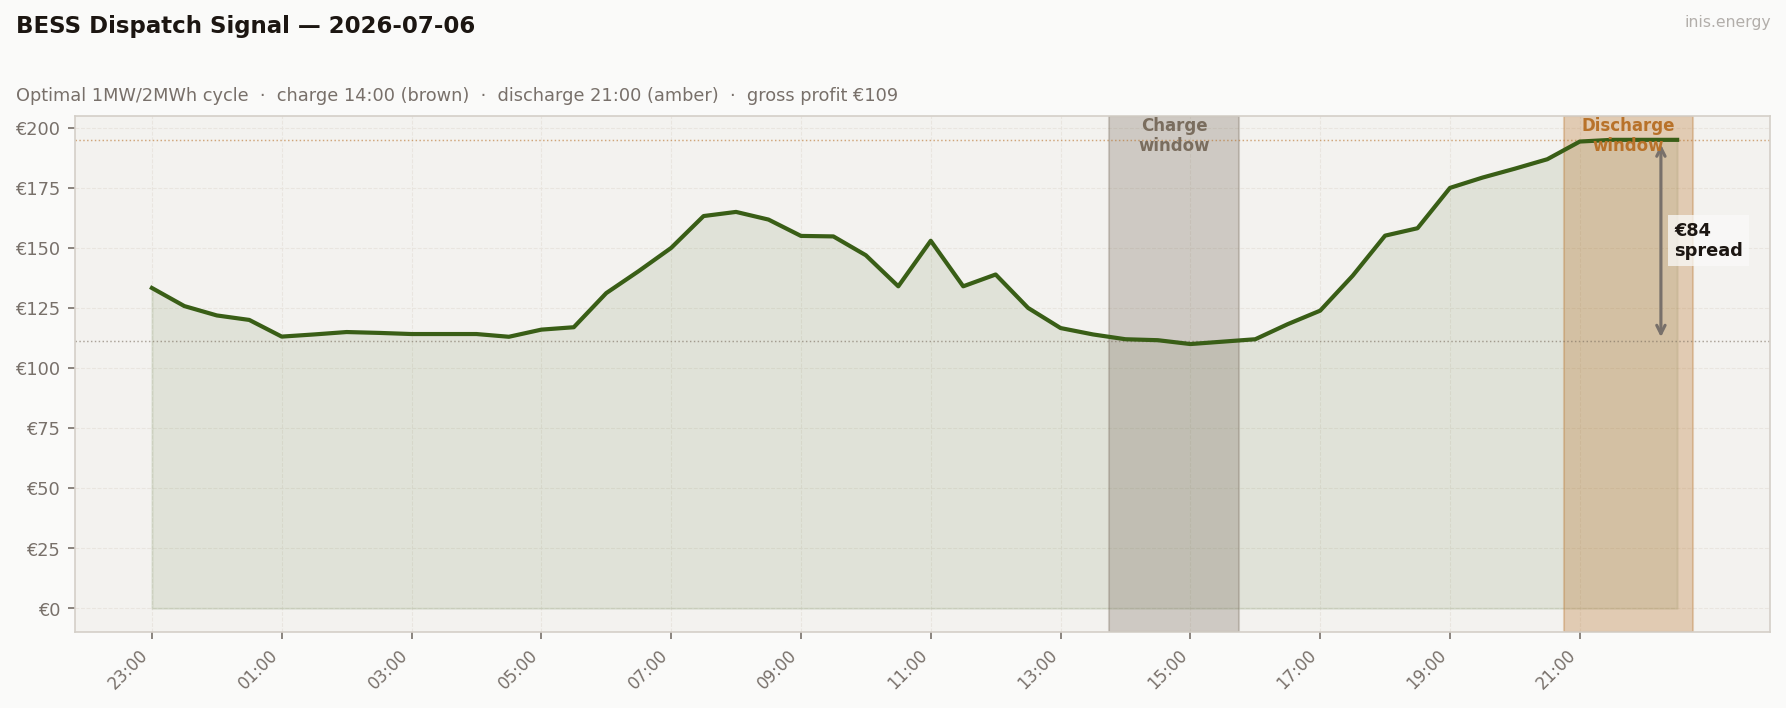
Charged at €111 (14:00) while wind was still rising, discharged into the €195 evening ceiling. ROI 49% — solid but unspectacular. The gradual ramp gave the battery time to see the peak coming rather than chase a scarcity shock.
Commentary #
Monday opens the week the way markets are supposed to work: wind fades gently through the evening, demand builds toward its usual peak, and price follows in one clean line to €195. No inversions, no whipsaws, nothing that needed a second chart to explain.
It’s a contrast with last week’s volatility, but also a reminder of what “normal” looks like here — wind moderate but declining, a positive peak/off-peak spread, and a ceiling that never gets near €200. Worth watching whether this is a one-off calm Monday or the start of a genuine lull in wind.
If wind keeps easing through the week the way it started today, expect the ramps to get steeper and the peaks to climb — Monday’s €195 may be a floor, not a ceiling, for what’s coming.
Half-hourly data — 2026-07-06
| Period | Time | Price (€/MWh) | Wind % |
|---|---|---|---|
| 1 | 23:00 | 133.34 | 29.2% |
| 2 | 23:30 | 125.80 | 31.4% |
| 3 | 00:00 | 121.91 | 32.0% |
| 4 | 00:30 | 120.04 | 33.2% |
| 5 | 01:00 | 113.10 | 34.8% |
| 6 | 01:30 | 114.00 | 36.2% |
| 7 | 02:00 | 115.00 | 35.7% |
| 8 | 02:30 | 114.64 | 36.5% |
| 9 | 03:00 | 114.17 | 37.1% |
| 10 | 03:30 | 114.17 | 36.2% |
| 11 | 04:00 | 114.17 | 38.6% |
| 12 | 04:30 | 113.03 | 38.9% |
| 13 | 05:00 | 116.00 | 39.1% |
| 14 | 05:30 | 117.00 | 38.0% |
| 15 | 06:00 | 131.20 | 36.3% |
| 16 | 06:30 | 140.36 | 33.5% |
| 17 | 07:00 | 150.01 | 30.9% |
| 18 | 07:30 | 163.28 | 28.5% |
| 19 | 08:00 | 165.00 | 26.4% |
| 20 | 08:30 | 161.81 | 24.7% |
| 21 | 09:00 | 155.01 | 23.8% |
| 22 | 09:30 | 154.80 | 24.2% |
| 23 | 10:00 | 146.96 | 23.2% |
| 24 | 10:30 | 134.03 | 23.2% |
| 25 | 11:00 | 152.99 | 23.3% |
| 26 | 11:30 | 134.03 | 23.3% |
| 27 | 12:00 | 138.95 | 23.8% |
| 28 | 12:30 | 125.03 | 24.5% |
| 29 | 13:00 | 116.66 | 24.8% |
| 30 | 13:30 | 114.00 | 26.0% |
| 31 | 14:00 | 112.00 | 25.4% |
| 32 | 14:30 | 111.60 | 27.2% |
| 33 | 15:00 | 110.00 | 28.2% |
| 34 | 15:30 | 111.00 | 28.1% |
| 35 | 16:00 | 112.00 | 28.8% |
| 36 | 16:30 | 118.28 | 28.1% |
| 37 | 17:00 | 123.90 | 26.3% |
| 38 | 17:30 | 138.42 | 25.9% |
| 39 | 18:00 | 155.12 | 26.4% |
| 40 | 18:30 | 158.21 | 25.9% |
| 41 | 19:00 | 175.00 | 24.6% |
| 42 | 19:30 | 179.28 | 23.8% |
| 43 | 20:00 | 183.00 | 24.1% |
| 44 | 20:30 | 186.93 | 23.9% |
| 45 | 21:00 | 194.29 | 22.8% |
| 46 | 21:30 | 195.00 | 23.5% |
| 47 | 22:00 | 195.00 | 24.6% |
| 48 | 22:30 | 195.00 | 26.8% |
Compare your business electricity and gas rates in minutes with INIS Energy Brokers.
Compare rates