I-SEM Daily Briefing — 7 July 2026
Table of Contents
Market Snapshot
| Metric | Value |
|---|---|
| Mean DAM Price | €151.57/MWh |
| Median Price | €132.5/MWh |
| Std Dev | €35.04/MWh |
| Peak Price | €233.0/MWh (22:00) |
| Min Price | €114.64/MWh (11:30) |
| Price Range | €118.36/MWh |
| Periods above €150 | 18 of 48 (38%) |
| Periods above €200 | 8 of 48 (17%) |
| Peak Avg (07–22) | €157.06/MWh |
| Off-peak Avg (22–07) | €142.42/MWh |
| Peak/Off-Peak Spread | €14.64/MWh |
| Wind % of Demand | 16.3% |
| Wind Range | 4.0%–31.0% |
| Mean Demand | 3770 MW |
Price Profile #
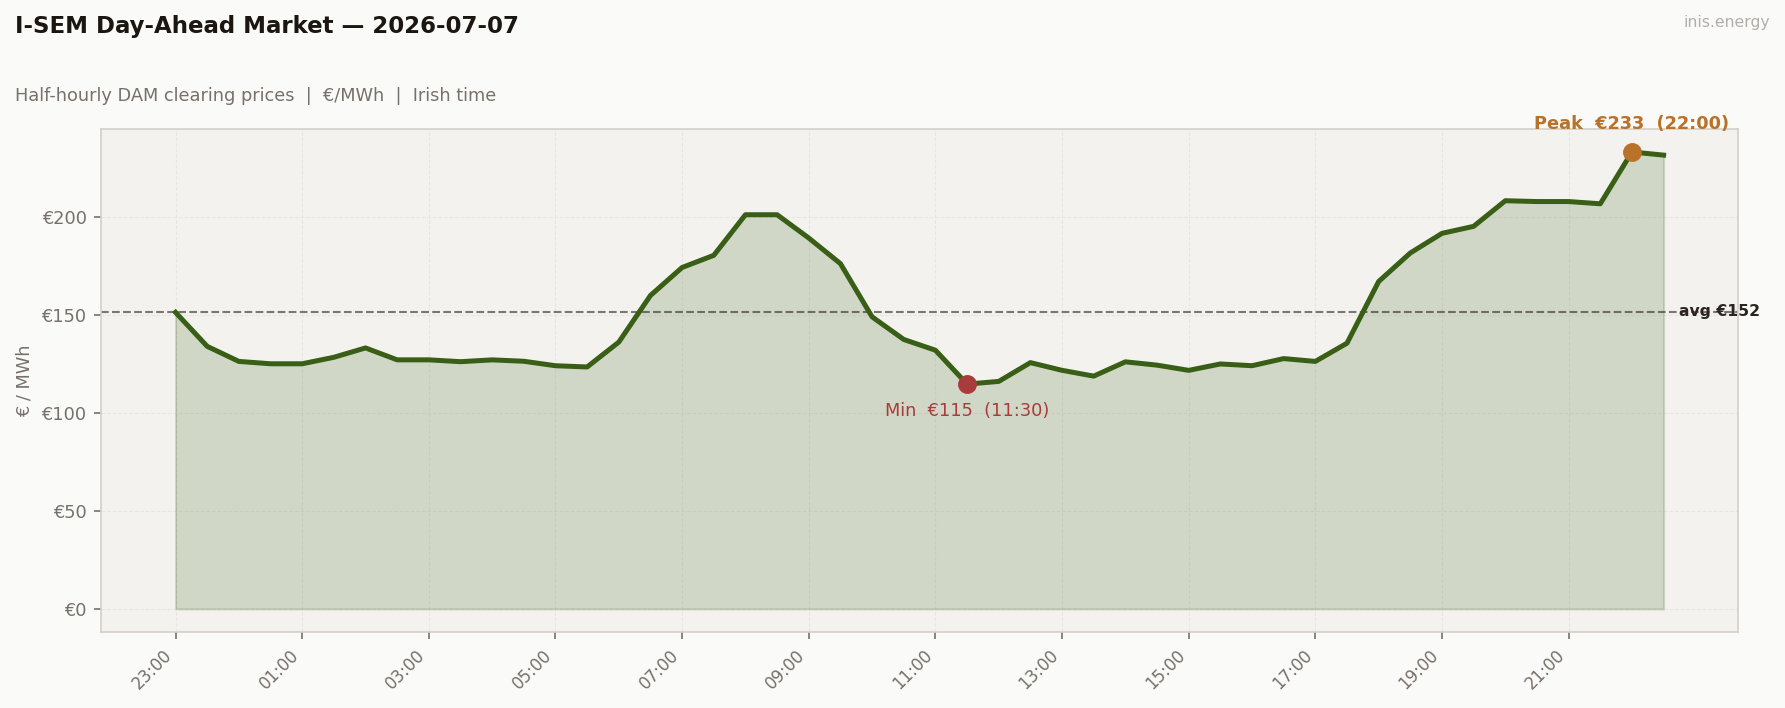
Std dev €35.04/MWh · Median €132.5/MWh · Periods above €150: 18 of 48 (38%)
This is a slow bleed, not a spike. Wind fell steadily from 30% overnight to single digits by evening, and price climbed in lockstep — a €114 floor at midday, then an unbroken ramp to €233 at 22:00, the second-highest peak of the week. One direction, all day, barely interrupted.
Price vs Wind #
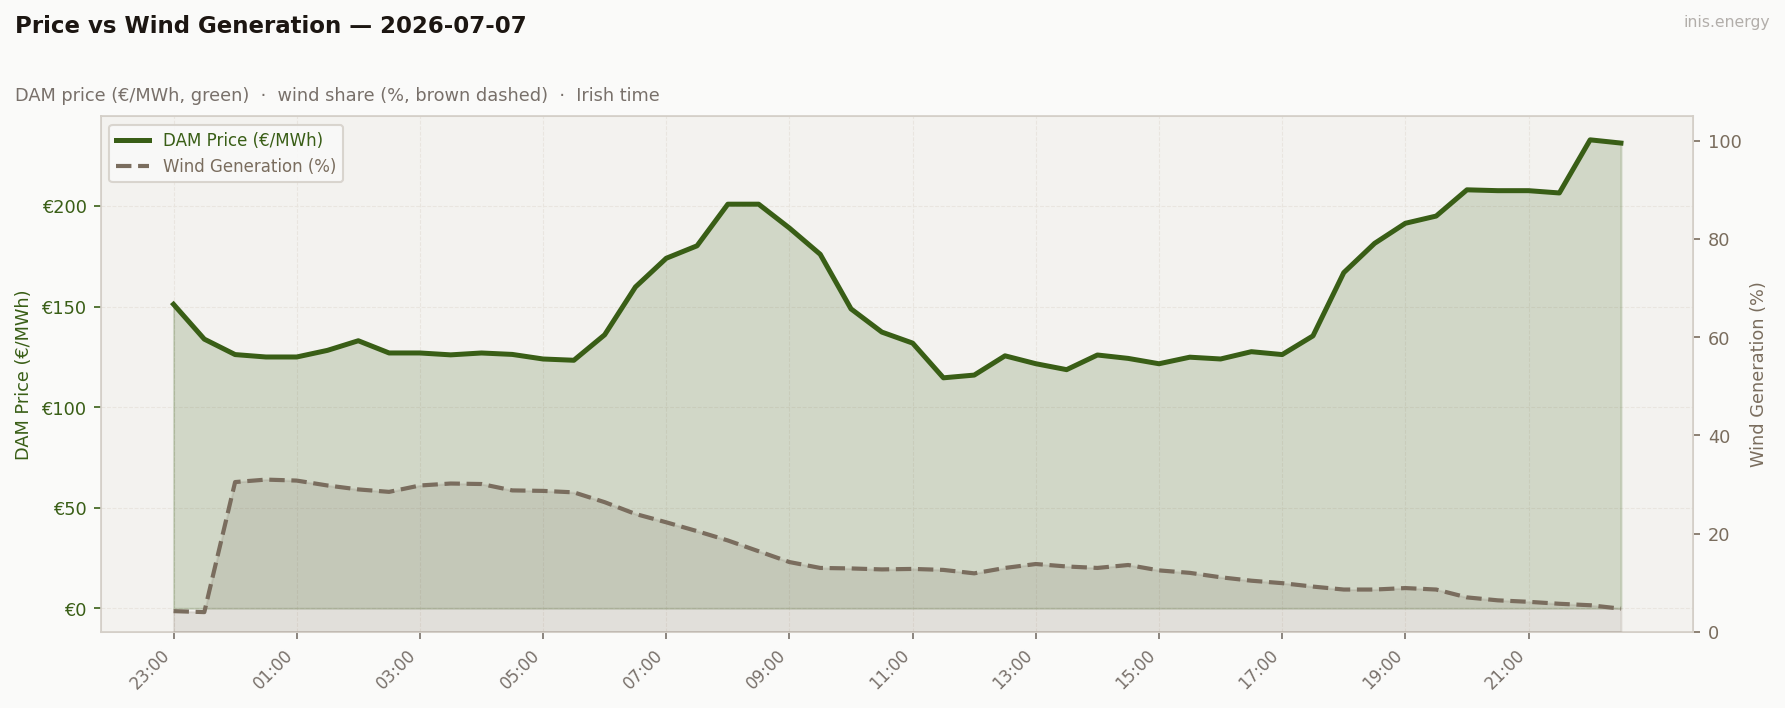
Mean wind: 16.3% · Range: 4.0%–31.0%
Wind’s steady bleed — 30% down to 4% inside a single day — draws the price arc almost one-for-one with it. No countervailing effect this time: wind just kept falling and price just kept climbing.
Week in Context #
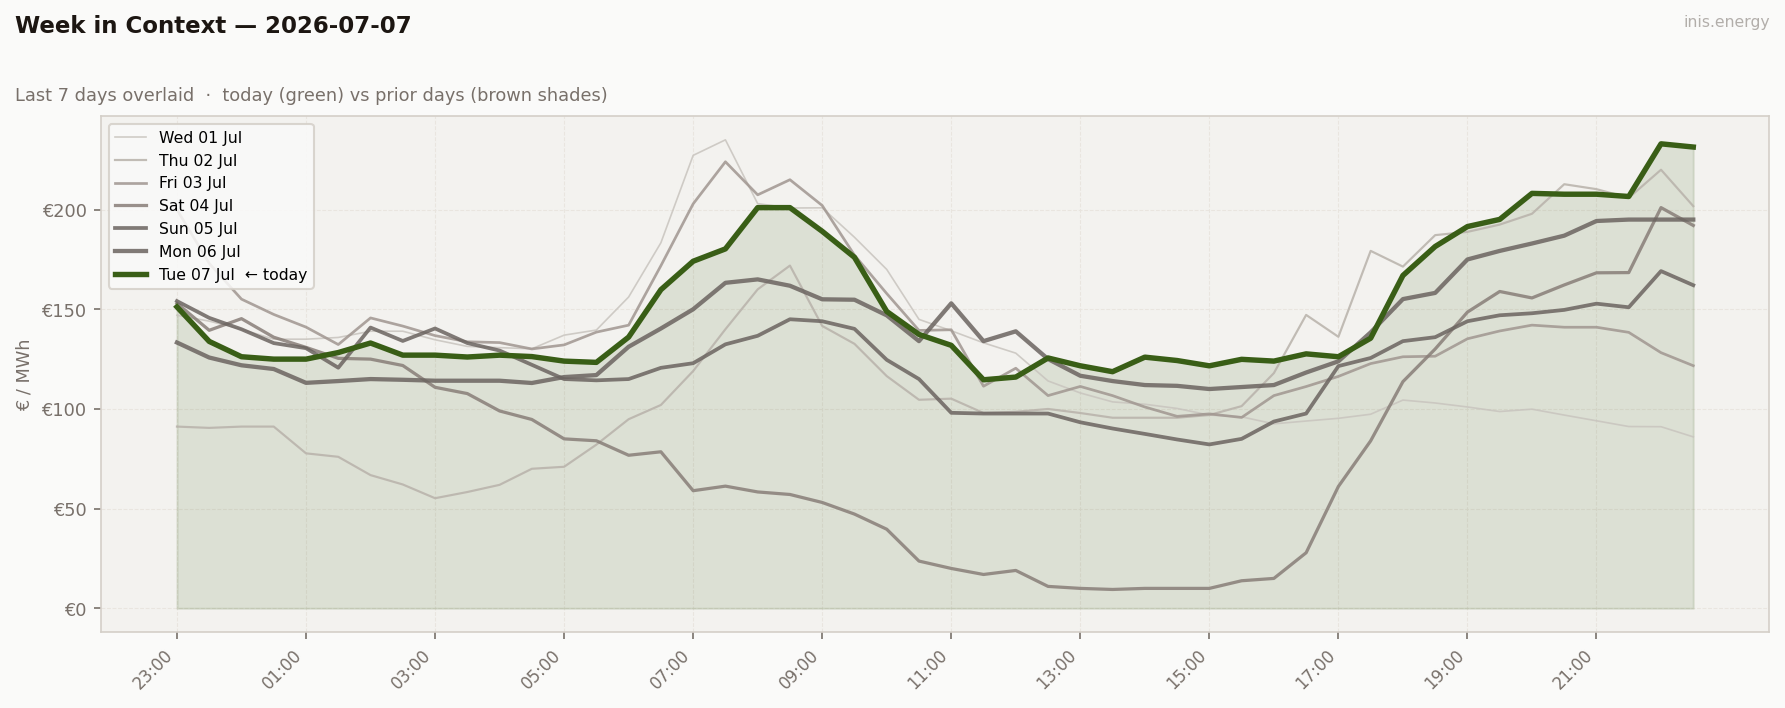
A sharper squeeze than Monday. Monday’s wind stayed in a moderate band and price topped out at €195; Tuesday’s wind fell straight through the floor and price broke €230. Same shape, more pressure.
Price Duration Curve #
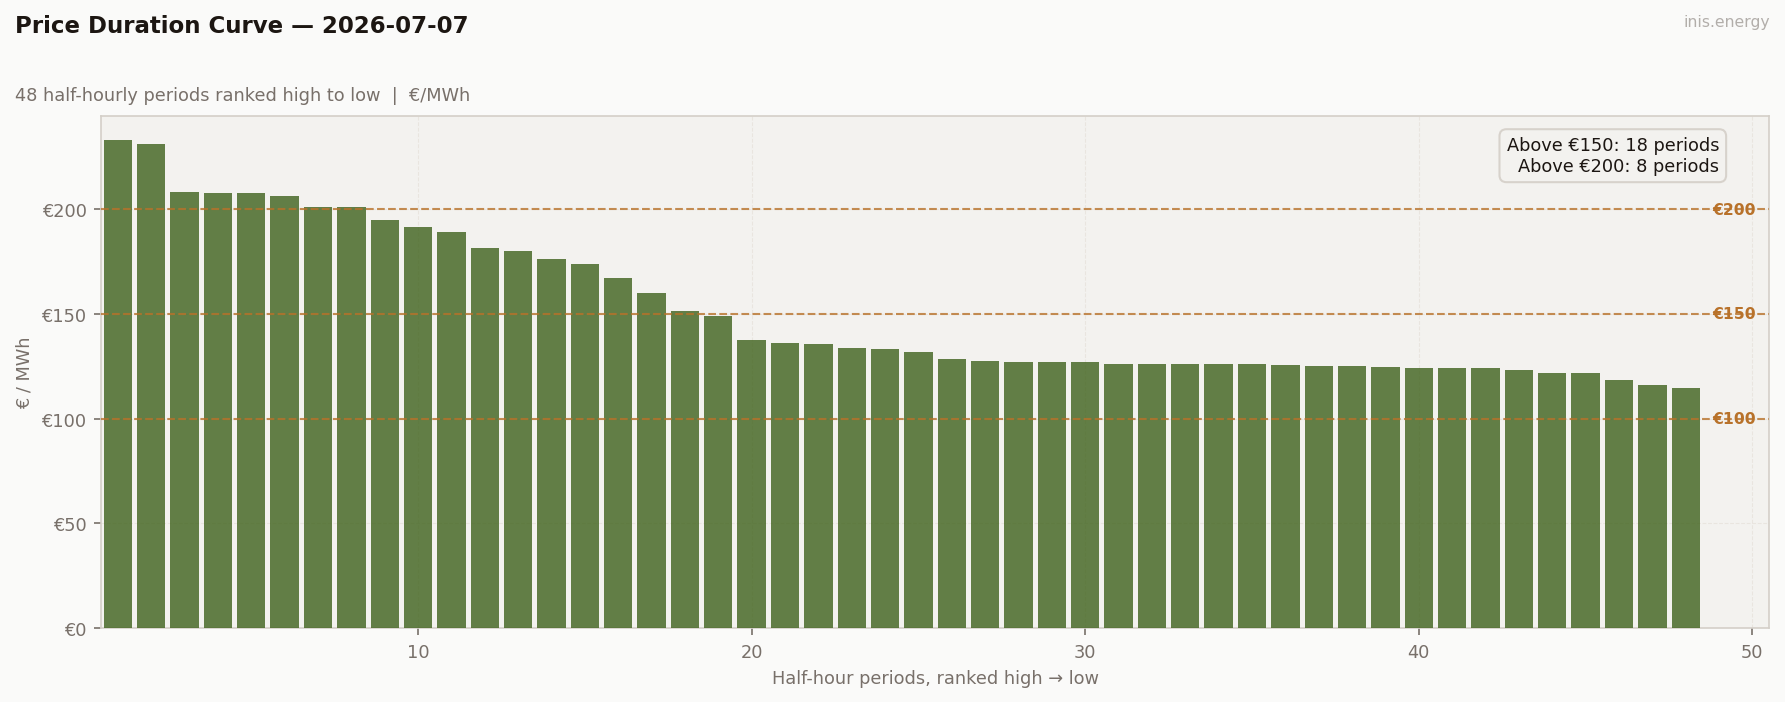
Periods above €150: 18 (38% of day) · Above €200: 8 (17% of day)
Peak / Off-Peak Spread #
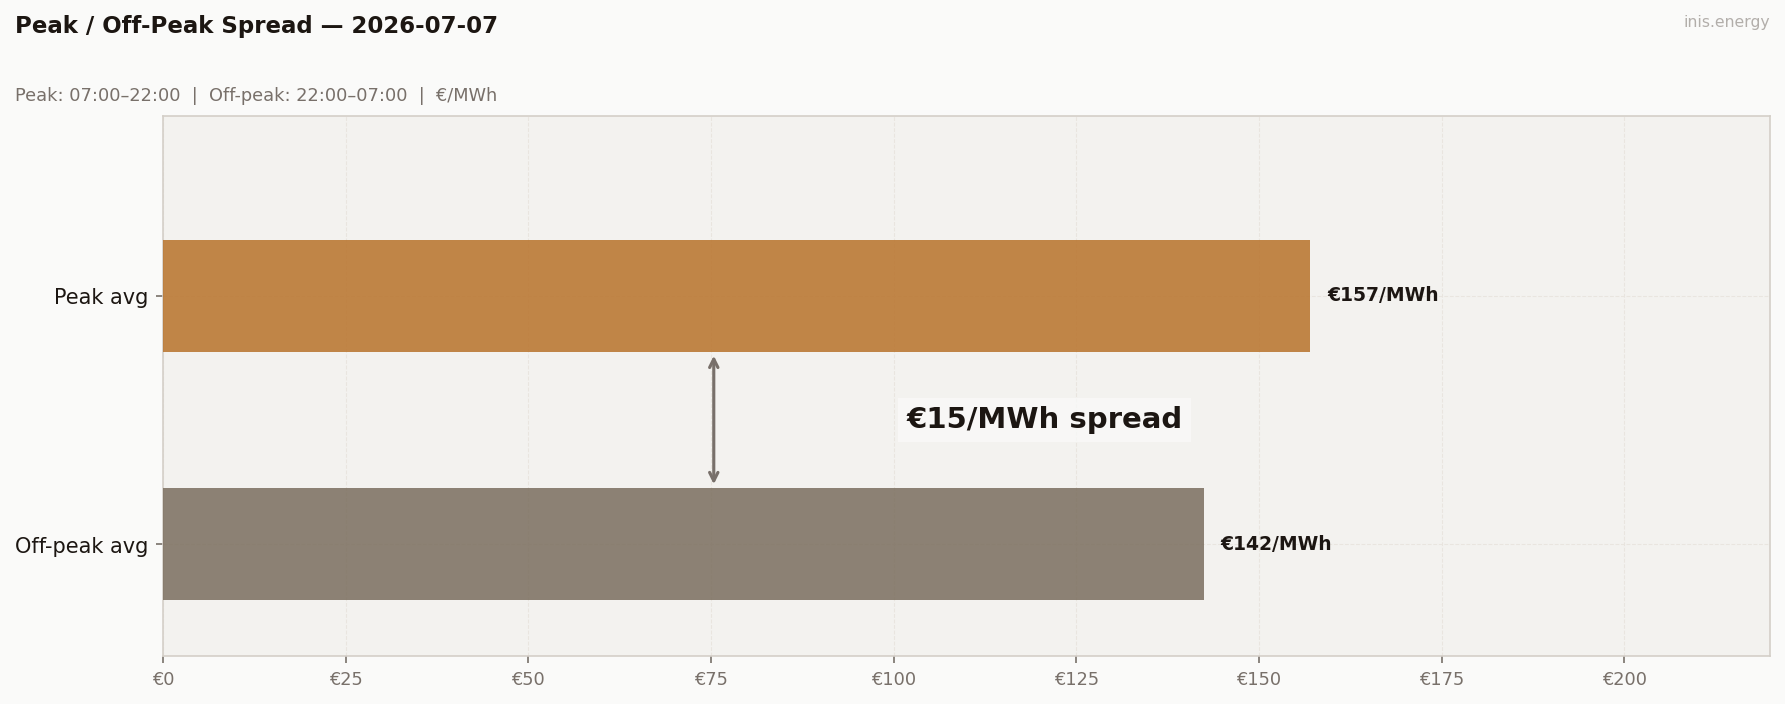
Peak avg (07:00–22:00): €157.06/MWh · Off-peak avg: €142.42/MWh · Spread: €14.64/MWh
Spread stays positive, similar magnitude to Monday, but for a different reason — the wind collapse landed inside the peak window itself rather than at the edges of the day.
BESS Dispatch Signal #
| Price | Time | Energy | Value | |
|---|---|---|---|---|
| Charge | €119/MWh | 11:30 | 2 MWh | −€239 |
| Discharge | €220/MWh | 21:00 | 1.7 MWh (85% RTE) | +€373 |
| Gross profit | €134 | |||
| Price spread | €100/MWh | ROI: 56.3% |
Simulated 1MW/2MWh battery, one optimal DAM cycle. Gross before network charges and capacity costs.
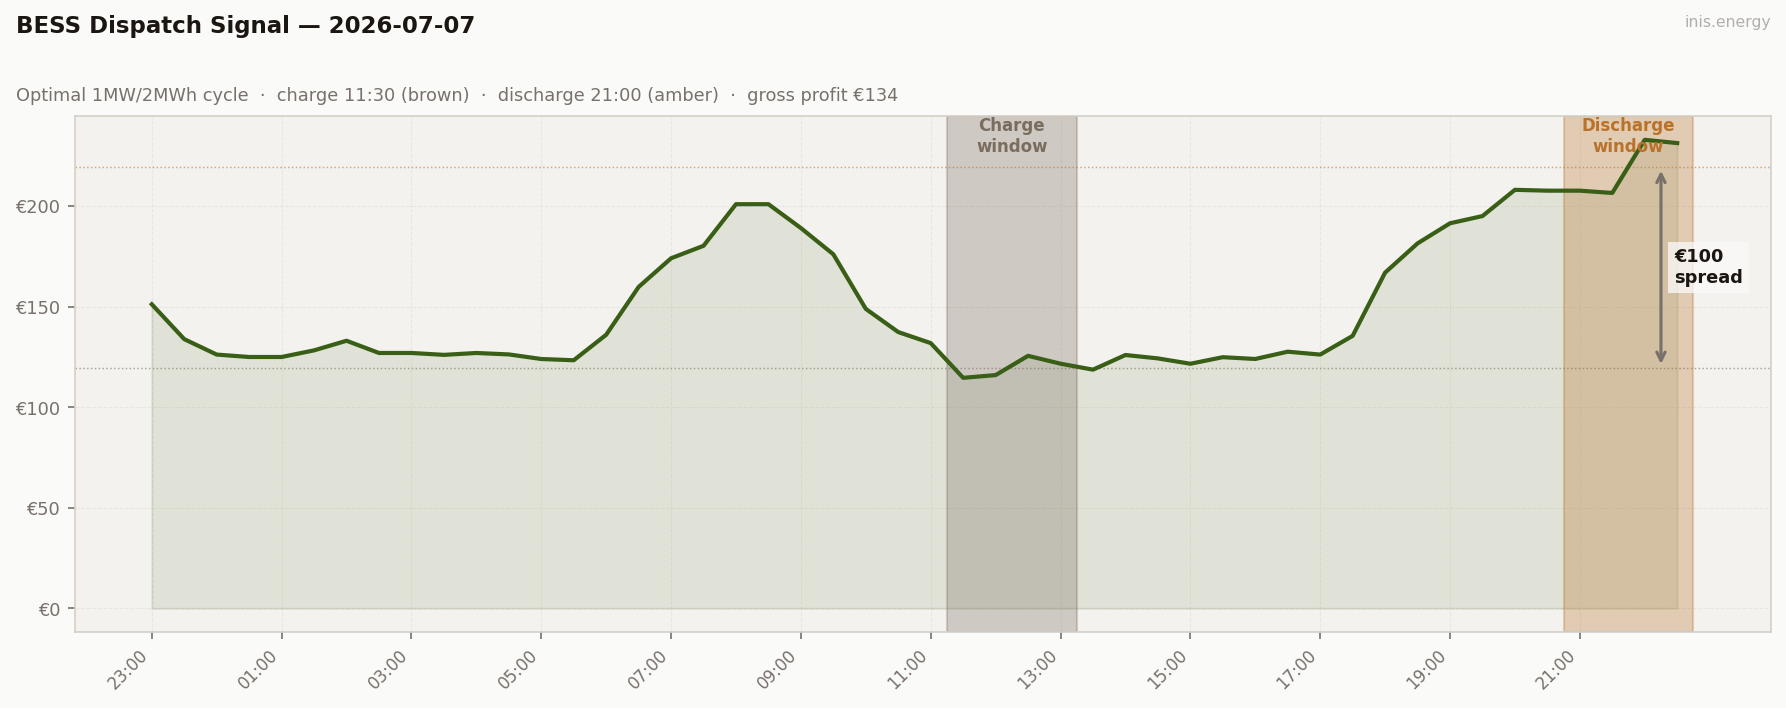
Charged at the €114 midday floor, discharged into the €233 evening peak — the widest spread of the week so far. ROI 56%, second-best trade of the week, driven entirely by the relentless wind fade.
Commentary #
Tuesday tightens the market a notch further. Wind’s average dropped from Monday’s 28.8% to 16.3%, and instead of one evening ramp, the whole day trends upward as wind bleeds away hour by hour — 30% at midnight, 4% by the close.
The trend across the week so far is unmistakable: less wind, higher prices, steeper ramps. Monday’s ceiling was €195; Tuesday’s is €233. Neither day had a dramatic collapse or flood — this is wind quietly running out over 24 hours, and price quietly climbing to match.
If wind keeps falling at this rate, Wednesday could be the tightest day yet. Worth watching the overnight numbers first thing.
Half-hourly data — 2026-07-07
| Period | Time | Price (€/MWh) | Wind % |
|---|---|---|---|
| 1 | 23:00 | 151.21 | 4.2% |
| 2 | 23:30 | 133.88 | 4.0% |
| 3 | 00:00 | 126.20 | 30.5% |
| 4 | 00:30 | 125.00 | 31.0% |
| 5 | 01:00 | 125.00 | 30.8% |
| 6 | 01:30 | 128.30 | 29.8% |
| 7 | 02:00 | 133.08 | 29.0% |
| 8 | 02:30 | 127.00 | 28.5% |
| 9 | 03:00 | 127.00 | 29.8% |
| 10 | 03:30 | 126.06 | 30.2% |
| 11 | 04:00 | 126.99 | 30.1% |
| 12 | 04:30 | 126.28 | 28.8% |
| 13 | 05:00 | 124.00 | 28.7% |
| 14 | 05:30 | 123.37 | 28.4% |
| 15 | 06:00 | 136.05 | 26.4% |
| 16 | 06:30 | 159.83 | 24.0% |
| 17 | 07:00 | 174.10 | 22.3% |
| 18 | 07:30 | 180.30 | 20.5% |
| 19 | 08:00 | 201.00 | 18.6% |
| 20 | 08:30 | 201.00 | 16.4% |
| 21 | 09:00 | 189.12 | 14.2% |
| 22 | 09:30 | 176.07 | 13.0% |
| 23 | 10:00 | 148.92 | 12.9% |
| 24 | 10:30 | 137.39 | 12.7% |
| 25 | 11:00 | 131.91 | 12.8% |
| 26 | 11:30 | 114.64 | 12.6% |
| 27 | 12:00 | 116.00 | 11.9% |
| 28 | 12:30 | 125.58 | 13.0% |
| 29 | 13:00 | 121.66 | 13.8% |
| 30 | 13:30 | 118.70 | 13.3% |
| 31 | 14:00 | 125.99 | 13.0% |
| 32 | 14:30 | 124.30 | 13.6% |
| 33 | 15:00 | 121.64 | 12.5% |
| 34 | 15:30 | 124.90 | 12.0% |
| 35 | 16:00 | 124.01 | 11.1% |
| 36 | 16:30 | 127.64 | 10.4% |
| 37 | 17:00 | 126.20 | 9.9% |
| 38 | 17:30 | 135.50 | 9.2% |
| 39 | 18:00 | 166.96 | 8.6% |
| 40 | 18:30 | 181.50 | 8.6% |
| 41 | 19:00 | 191.50 | 8.9% |
| 42 | 19:30 | 195.09 | 8.6% |
| 43 | 20:00 | 208.14 | 7.0% |
| 44 | 20:30 | 207.72 | 6.4% |
| 45 | 21:00 | 207.72 | 6.1% |
| 46 | 21:30 | 206.58 | 5.7% |
| 47 | 22:00 | 233.00 | 5.4% |
| 48 | 22:30 | 231.39 | 4.7% |
Compare your business electricity and gas rates in minutes with INIS Energy Brokers.
Compare rates