I-SEM Daily Briefing — 8 July 2026
Table of Contents
Market Snapshot
| Metric | Value |
|---|---|
| Mean DAM Price | €181.85/MWh |
| Median Price | €187.67/MWh |
| Std Dev | €31.91/MWh |
| Peak Price | €239.27/MWh (23:00) |
| Min Price | €131.63/MWh (13:30) |
| Price Range | €107.64/MWh |
| Periods above €150 | 37 of 48 (77%) |
| Periods above €200 | 17 of 48 (35%) |
| Peak Avg (07–22) | €176.96/MWh |
| Off-peak Avg (22–07) | €190.01/MWh |
| Peak/Off-Peak Spread | €-13.05/MWh |
| Wind % of Demand | 5.2% |
| Wind Range | 0.0%–14.4% |
| Mean Demand | 3844 MW |
Price Profile #
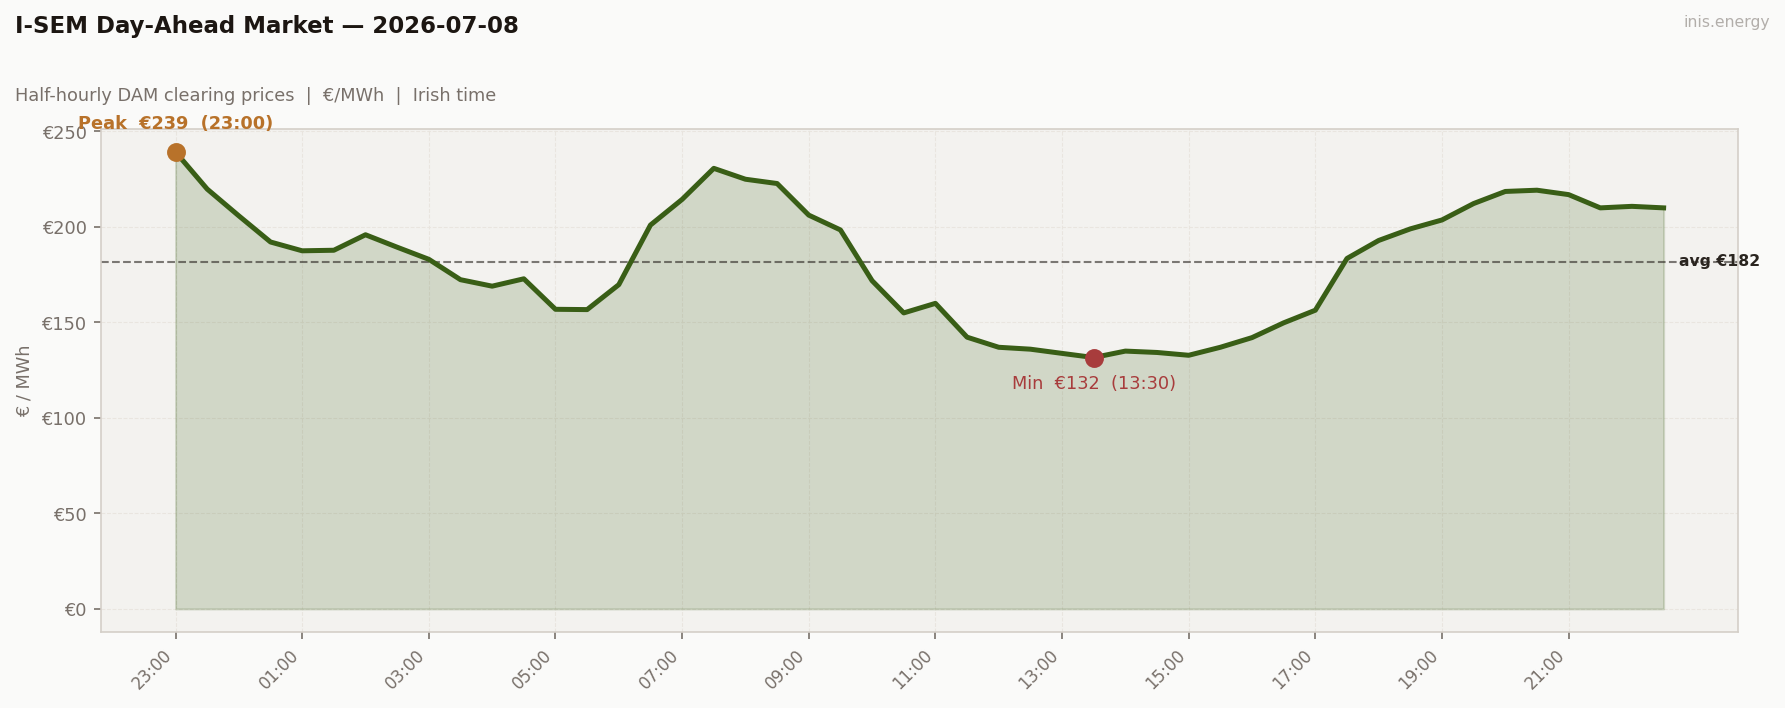
Std dev €31.91/MWh · Median €187.67/MWh · Periods above €150: 37 of 48 (77%)
Wind never really showed up. A full-day drought — flat at 0% for three straight hours mid-morning, never above 14% all day — so there was no overnight relief and no midday floor below €131. It closed at €239 at 23:00, the week’s highest print, with 77% of periods sat above €150.
Price vs Wind #
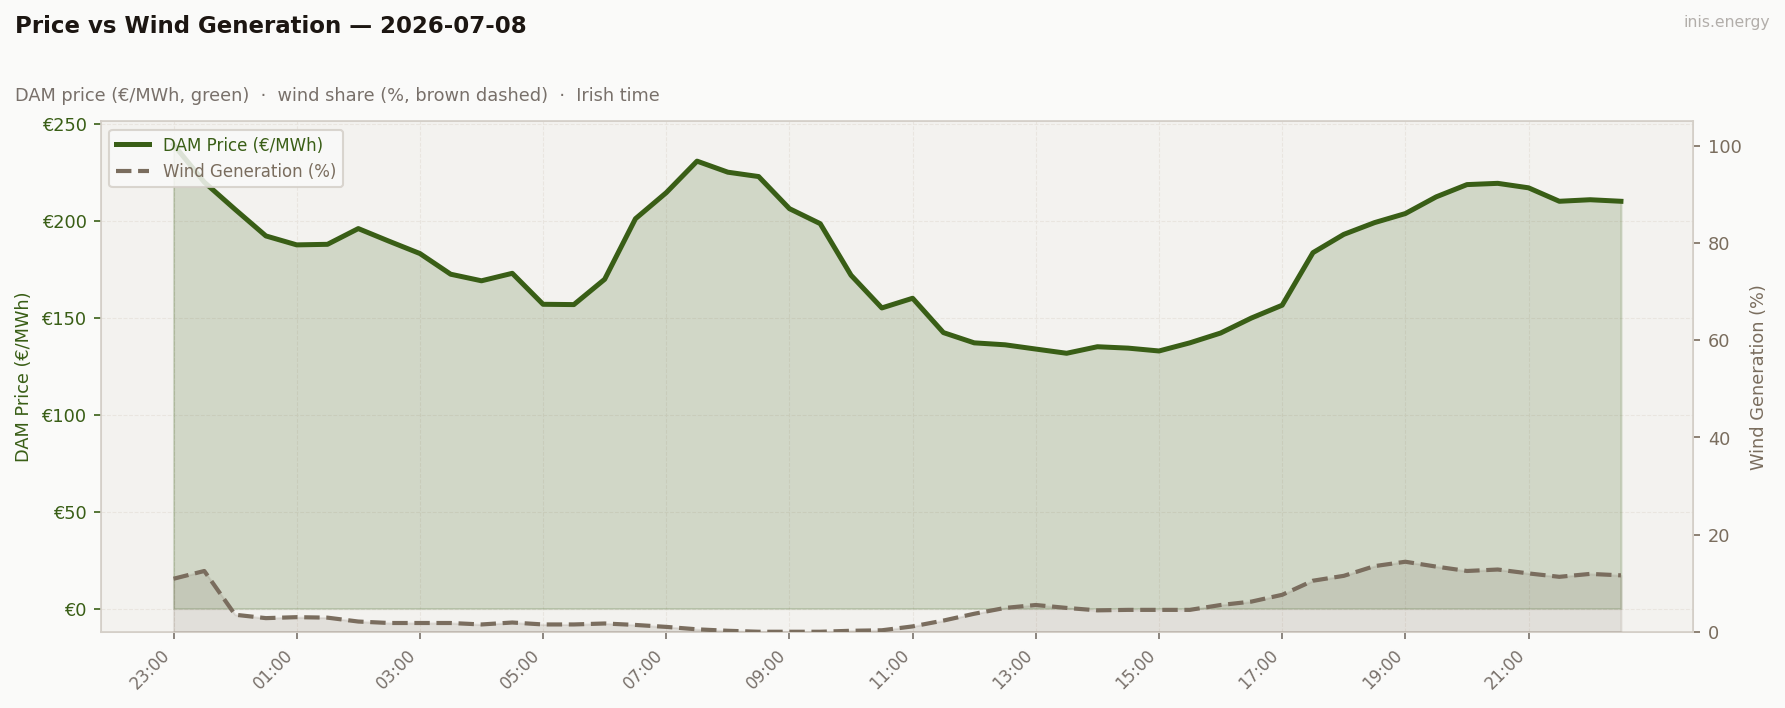
Mean wind: 5.2% · Range: 0.0%–14.4%
Wind essentially flatlined near zero and price sat near its ceiling the entire 24 hours — the closest thing to a pure scarcity day this week. No wind means no lever to pull; price just holds high.
Week in Context #
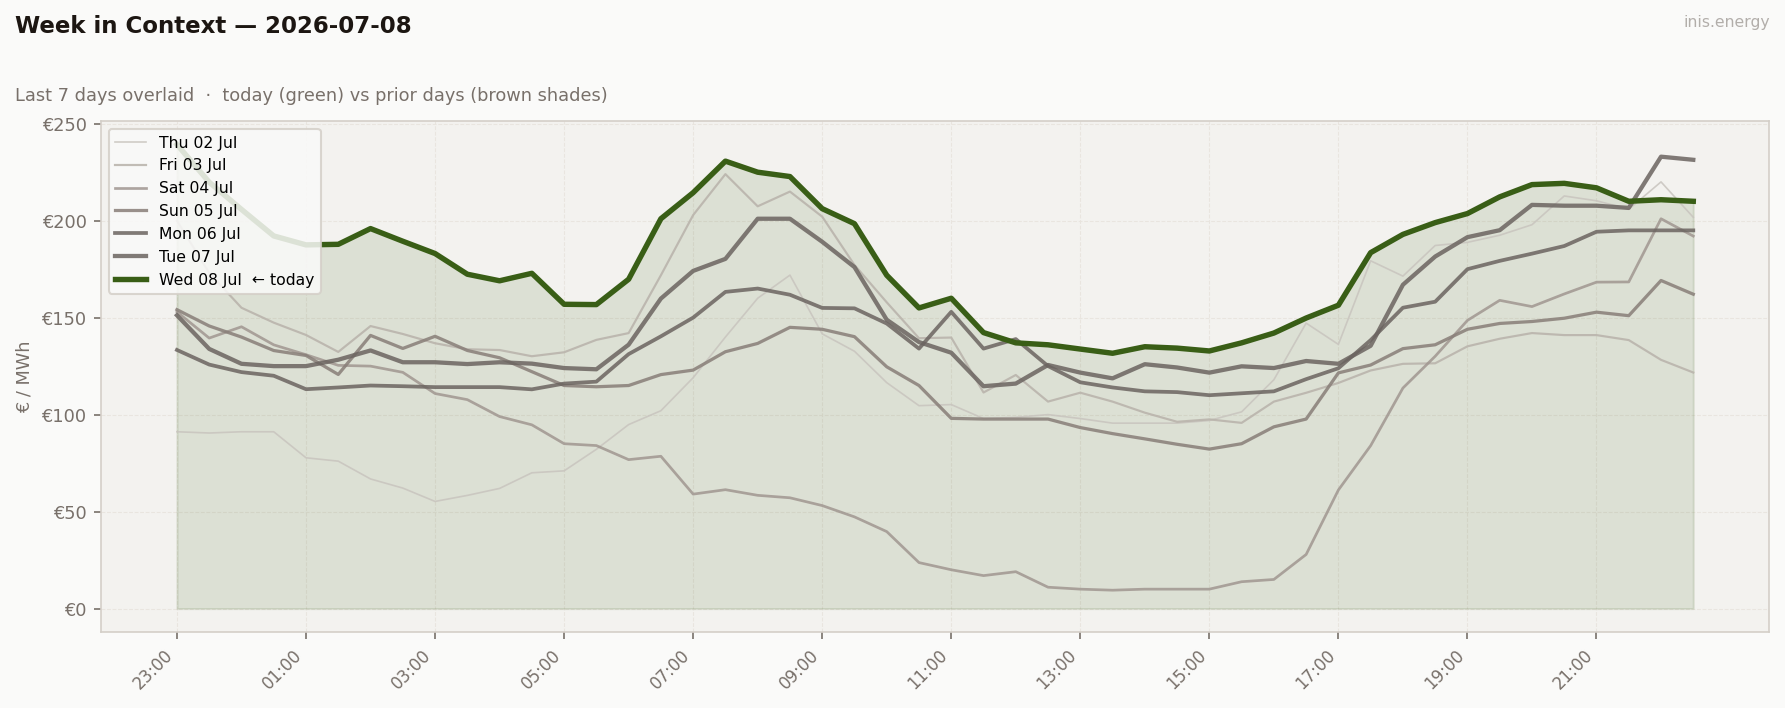
The wind story of the week in one line: Monday averaged 29%, Tuesday 16%, Wednesday 5%. Each day tighter than the last, and Wednesday’s near-total drought produces the week’s highest mean (€181.85), highest peak (€239.27), and its only true scarcity day.
Price Duration Curve #
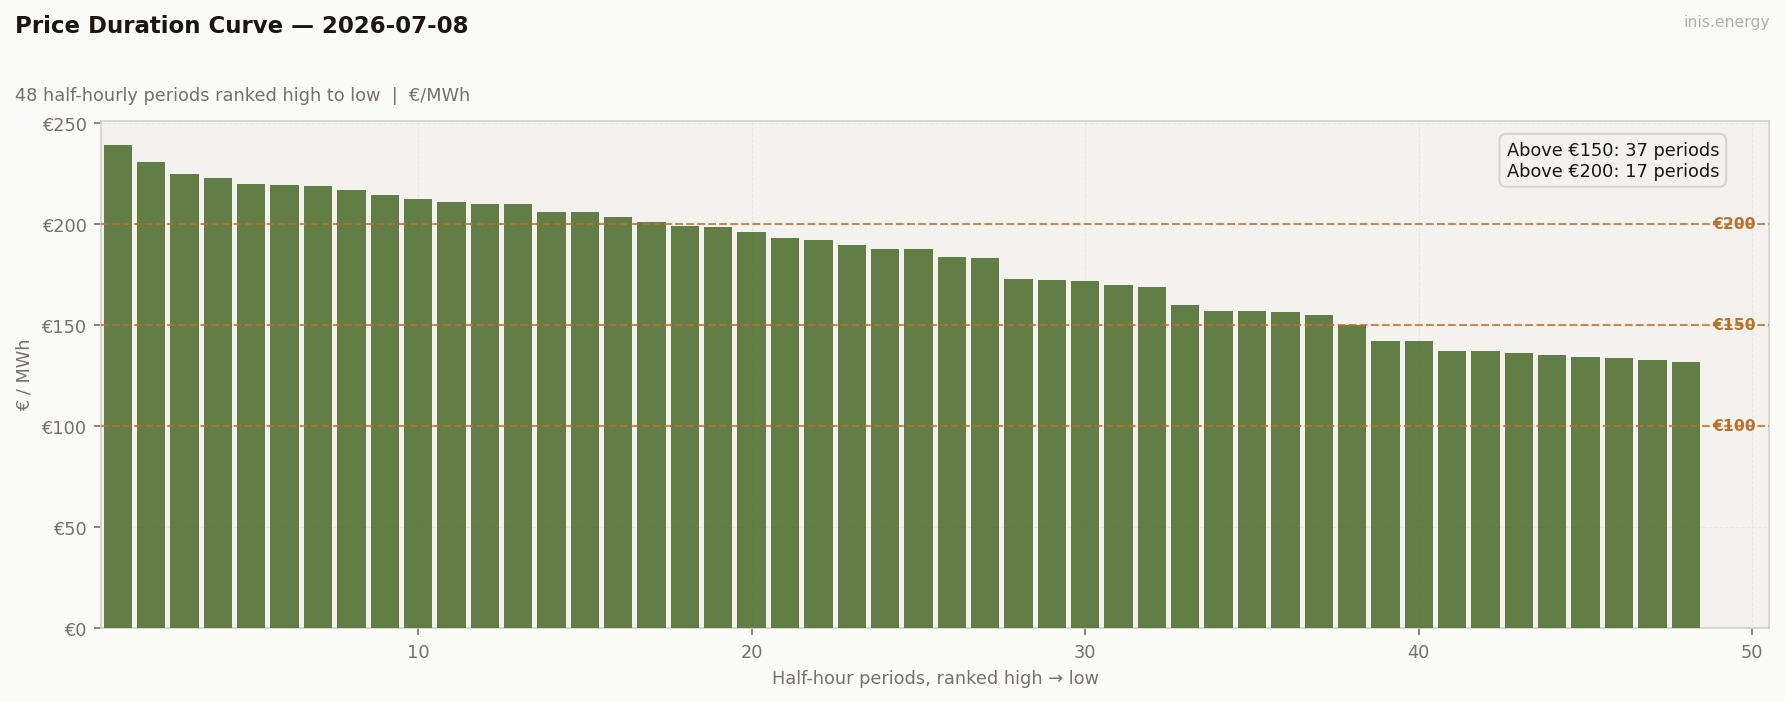
Periods above €150: 37 (77% of day) · Above €200: 17 (35% of day)
Peak / Off-Peak Spread #
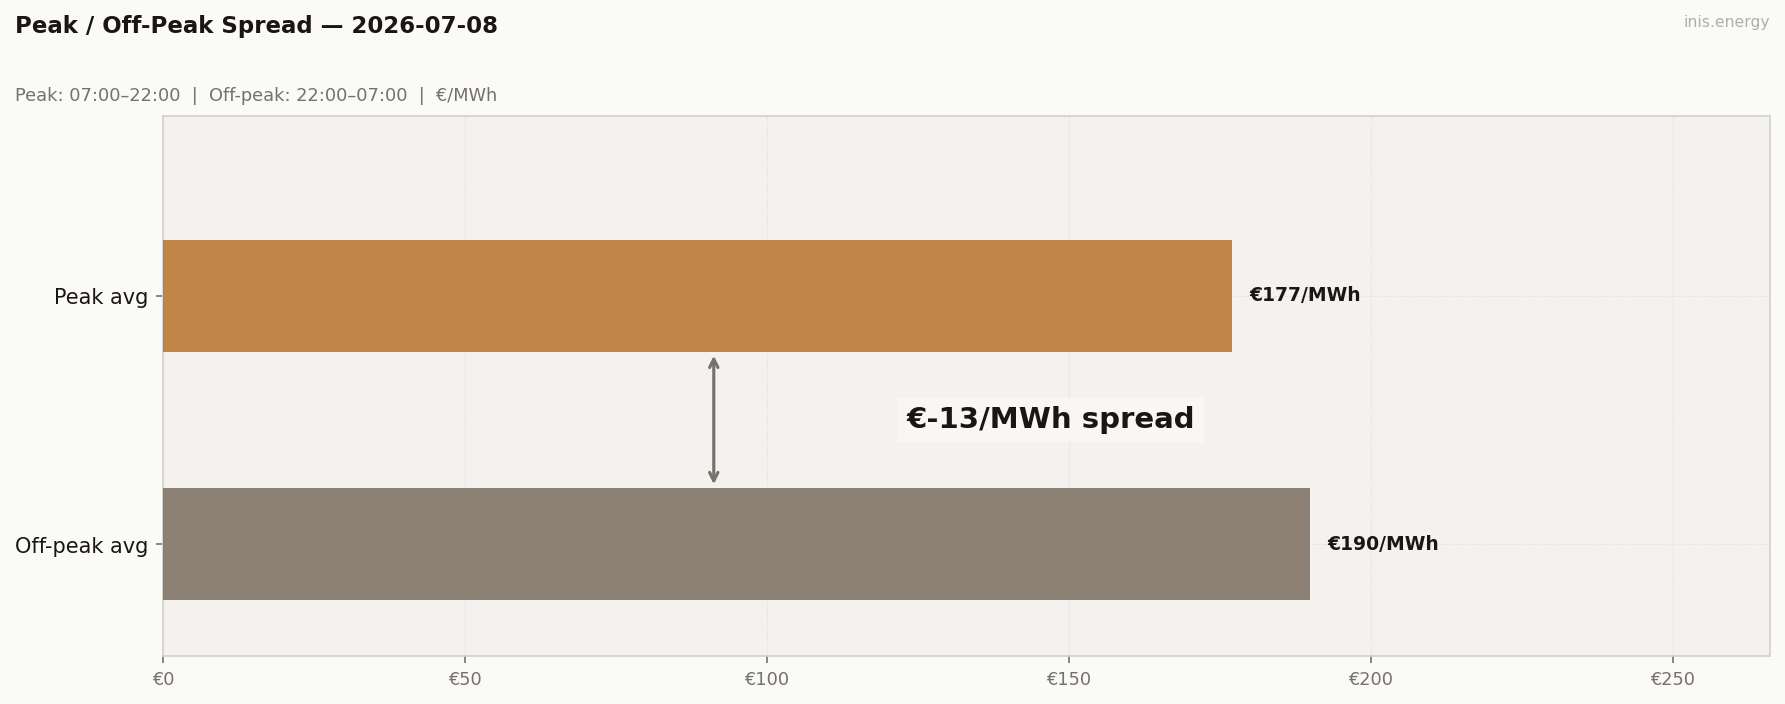
Peak avg (07:00–22:00): €176.96/MWh · Off-peak avg: €190.01/MWh · Spread: €-13.05/MWh
Spread flips negative again, but for a new reason. It’s not an overnight wind glut doing the flipping this time — it’s the absence of wind altogether. Overnight had nowhere to go but stay high, and it out-priced the daytime average.
BESS Dispatch Signal #
| Price | Time | Energy | Value | |
|---|---|---|---|---|
| Charge | €133/MWh | 13:30 | 2 MWh | −€267 |
| Discharge | €217/MWh | 19:30 | 1.7 MWh (85% RTE) | +€368 |
| Gross profit | €102 | |||
| Price spread | €83/MWh | ROI: 38.1% |
Simulated 1MW/2MWh battery, one optimal DAM cycle. Gross before network charges and capacity costs.
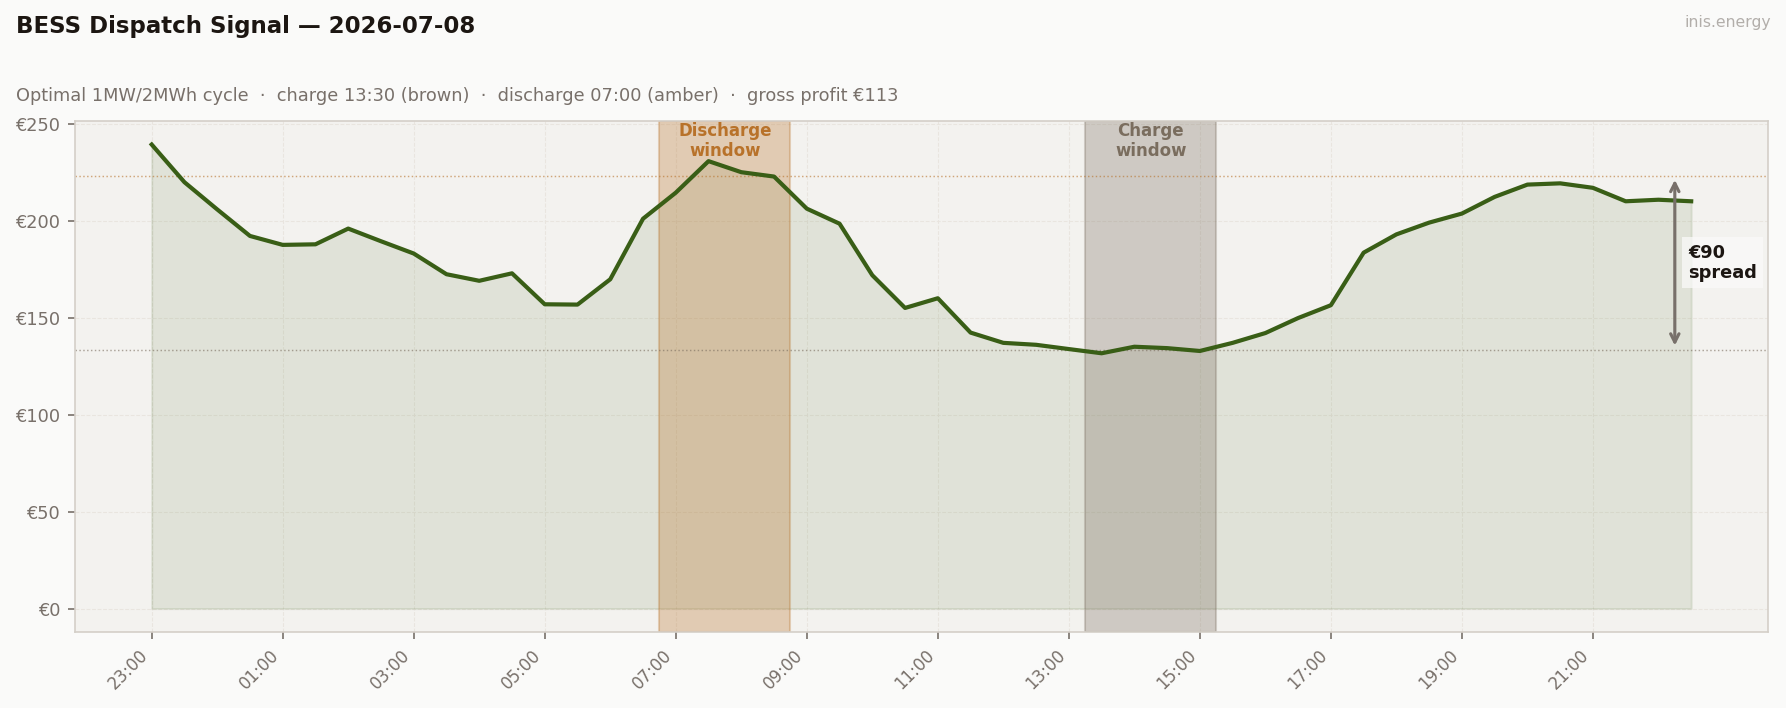
Charged at the day’s one soft spot, €131.63 at 13:30 — a brief wind uptick — and discharged into the €223 morning ramp. ROI 42%, the smallest gain of the three days: with price elevated almost everywhere, there was barely a floor to buy into.
Commentary #
Three days, one direction. Monday’s wind averaged 29% and price topped out at €195. Tuesday it fell to 16% and price broke €230. Wednesday it collapsed to 5% — barely a trace, dead flat for hours — and price spent three-quarters of the day above €150, closing at €239.
Wednesday is different in kind, not just degree. Monday and Tuesday still had shape — floors, ramps, a recognisable daily rhythm. Wednesday barely dips: no wind to bring price down anywhere, so the whole 24 hours just sits near the ceiling. That’s what flips the peak/off-peak spread negative — there’s no overnight wind lull left to create a floor.
Three straight days of falling wind is the story of the week so far. The real question now is whether Thursday brings any wind back at all, or whether this scarcity stretch keeps building.
Half-hourly data — 2026-07-08
| Period | Time | Price (€/MWh) | Wind % |
|---|---|---|---|
| 1 | 23:00 | 239.27 | 10.9% |
| 2 | 23:30 | 219.84 | 12.5% |
| 3 | 00:00 | 205.81 | 3.5% |
| 4 | 00:30 | 192.13 | 2.8% |
| 5 | 01:00 | 187.52 | 3.0% |
| 6 | 01:30 | 187.81 | 2.9% |
| 7 | 02:00 | 195.92 | 2.1% |
| 8 | 02:30 | 189.40 | 1.8% |
| 9 | 03:00 | 183.06 | 1.8% |
| 10 | 03:30 | 172.39 | 1.8% |
| 11 | 04:00 | 169.00 | 1.5% |
| 12 | 04:30 | 172.86 | 1.9% |
| 13 | 05:00 | 156.89 | 1.5% |
| 14 | 05:30 | 156.73 | 1.5% |
| 15 | 06:00 | 169.79 | 1.7% |
| 16 | 06:30 | 201.00 | 1.4% |
| 17 | 07:00 | 214.44 | 1.0% |
| 18 | 07:30 | 230.70 | 0.5% |
| 19 | 08:00 | 225.00 | 0.2% |
| 20 | 08:30 | 222.75 | 0.0% |
| 21 | 09:00 | 206.20 | 0.0% |
| 22 | 09:30 | 198.45 | 0.0% |
| 23 | 10:00 | 171.87 | 0.2% |
| 24 | 10:30 | 155.00 | 0.3% |
| 25 | 11:00 | 160.00 | 1.1% |
| 26 | 11:30 | 142.29 | 2.3% |
| 27 | 12:00 | 137.00 | 3.7% |
| 28 | 12:30 | 136.00 | 4.9% |
| 29 | 13:00 | 133.80 | 5.5% |
| 30 | 13:30 | 131.63 | 4.9% |
| 31 | 14:00 | 135.00 | 4.4% |
| 32 | 14:30 | 134.28 | 4.5% |
| 33 | 15:00 | 132.81 | 4.5% |
| 34 | 15:30 | 137.00 | 4.5% |
| 35 | 16:00 | 142.06 | 5.5% |
| 36 | 16:30 | 149.80 | 6.2% |
| 37 | 17:00 | 156.41 | 7.6% |
| 38 | 17:30 | 183.51 | 10.5% |
| 39 | 18:00 | 192.93 | 11.5% |
| 40 | 18:30 | 199.00 | 13.5% |
| 41 | 19:00 | 203.67 | 14.4% |
| 42 | 19:30 | 212.27 | 13.4% |
| 43 | 20:00 | 218.60 | 12.5% |
| 44 | 20:30 | 219.25 | 12.8% |
| 45 | 21:00 | 216.94 | 12.0% |
| 46 | 21:30 | 210.00 | 11.3% |
| 47 | 22:00 | 210.80 | 11.9% |
| 48 | 22:30 | 210.00 | 11.6% |
Compare your business electricity and gas rates in minutes with INIS Energy Brokers.
Compare rates