I-SEM Daily Briefing — 9 July 2026
Table of Contents
Market Snapshot
| Metric | Value |
|---|---|
| Mean DAM Price | €213.27/MWh |
| Median Price | €201.69/MWh |
| Std Dev | €42.83/MWh |
| Peak Price | €275.94/MWh (23:00) |
| Min Price | €151.86/MWh (14:30) |
| Price Range | €124.08/MWh |
| Periods above €150 | 48 of 48 (100%) |
| Periods above €200 | 26 of 48 (54%) |
| Peak Avg (07–22) | €213.56/MWh |
| Off-peak Avg (22–07) | €212.79/MWh |
| Peak/Off-Peak Spread | €0.77/MWh |
| Wind % of Demand | 4.5% |
| Wind Range | 1.3%–12.2% |
| Mean Demand | 3878 MW |
Price Profile #
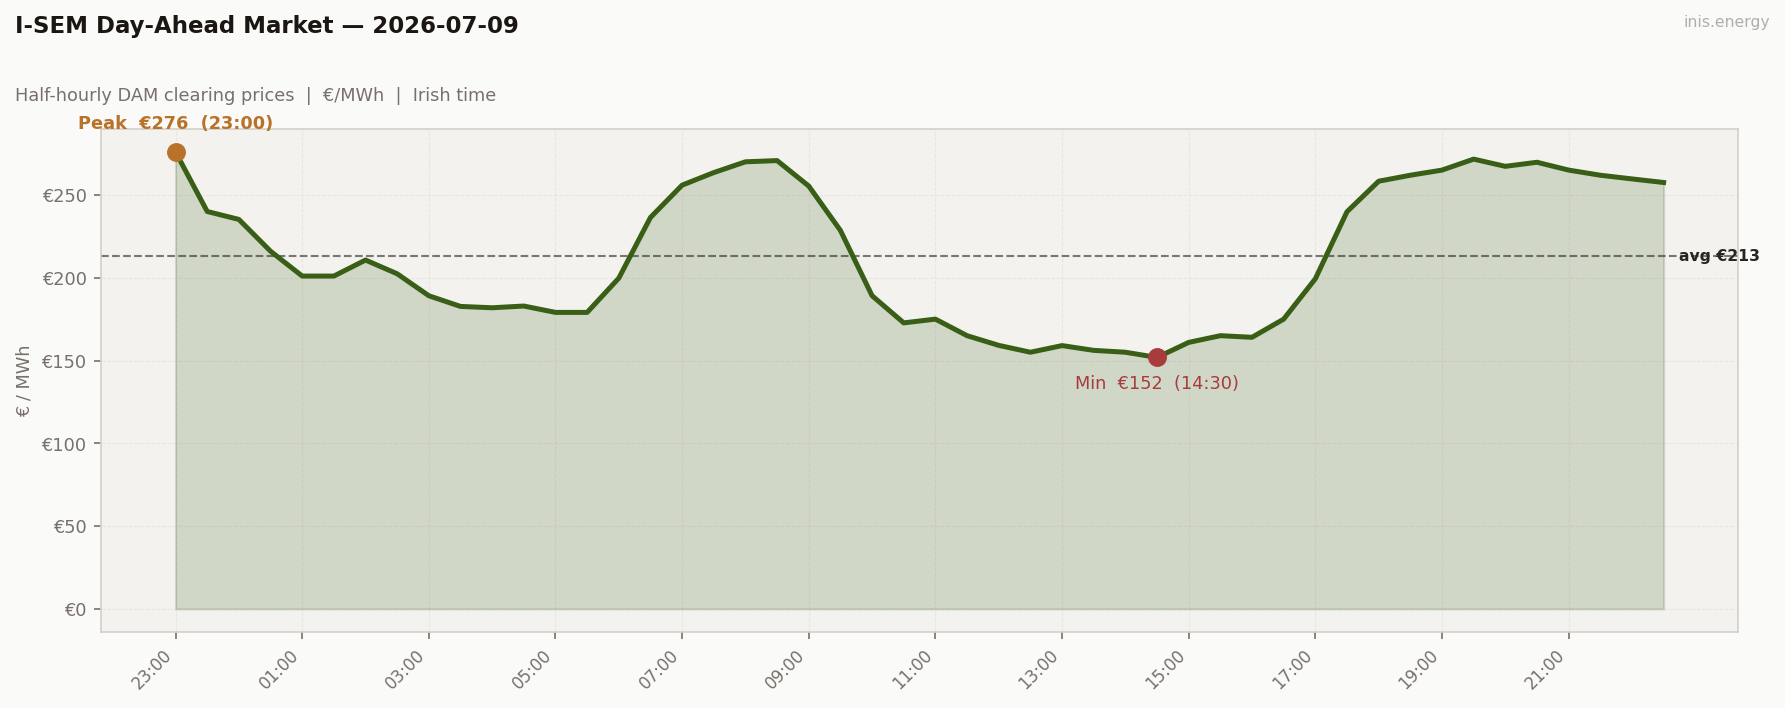
Std dev €42.83/MWh · Median €201.69/MWh · Periods above €150: 48 of 48 (100%)
Thursday deepens the drought rather than breaking it — wind fell even further from Wednesday’s already-thin 5.2% to 4.5%, and price responds with a double hump: a sharp morning ramp to €270 by 08:30, a brief midday floor near €152–165, then a second evening climb to a fresh week-high €275.94 at 23:00. Every single period closed above €150.
Price vs Wind #
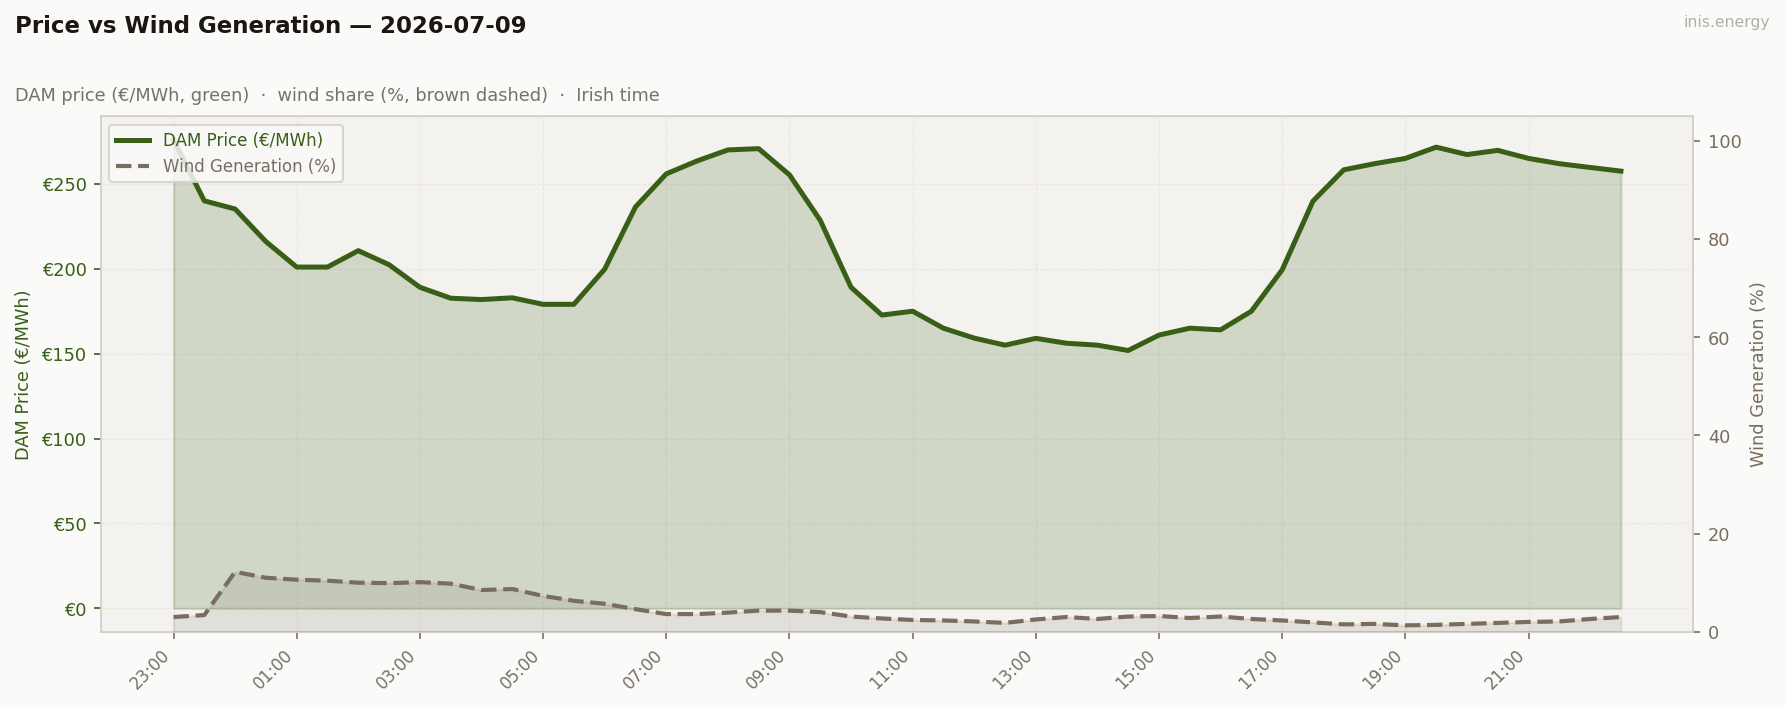
Mean wind: 4.5% · Range: 1.3%–12.2%
Wind spent the whole day pinned under 12%, mostly in single digits. With that little to lean on, price just tracks demand — two peaks, morning and evening, both pushed hard against the ceiling.
Week in Context #
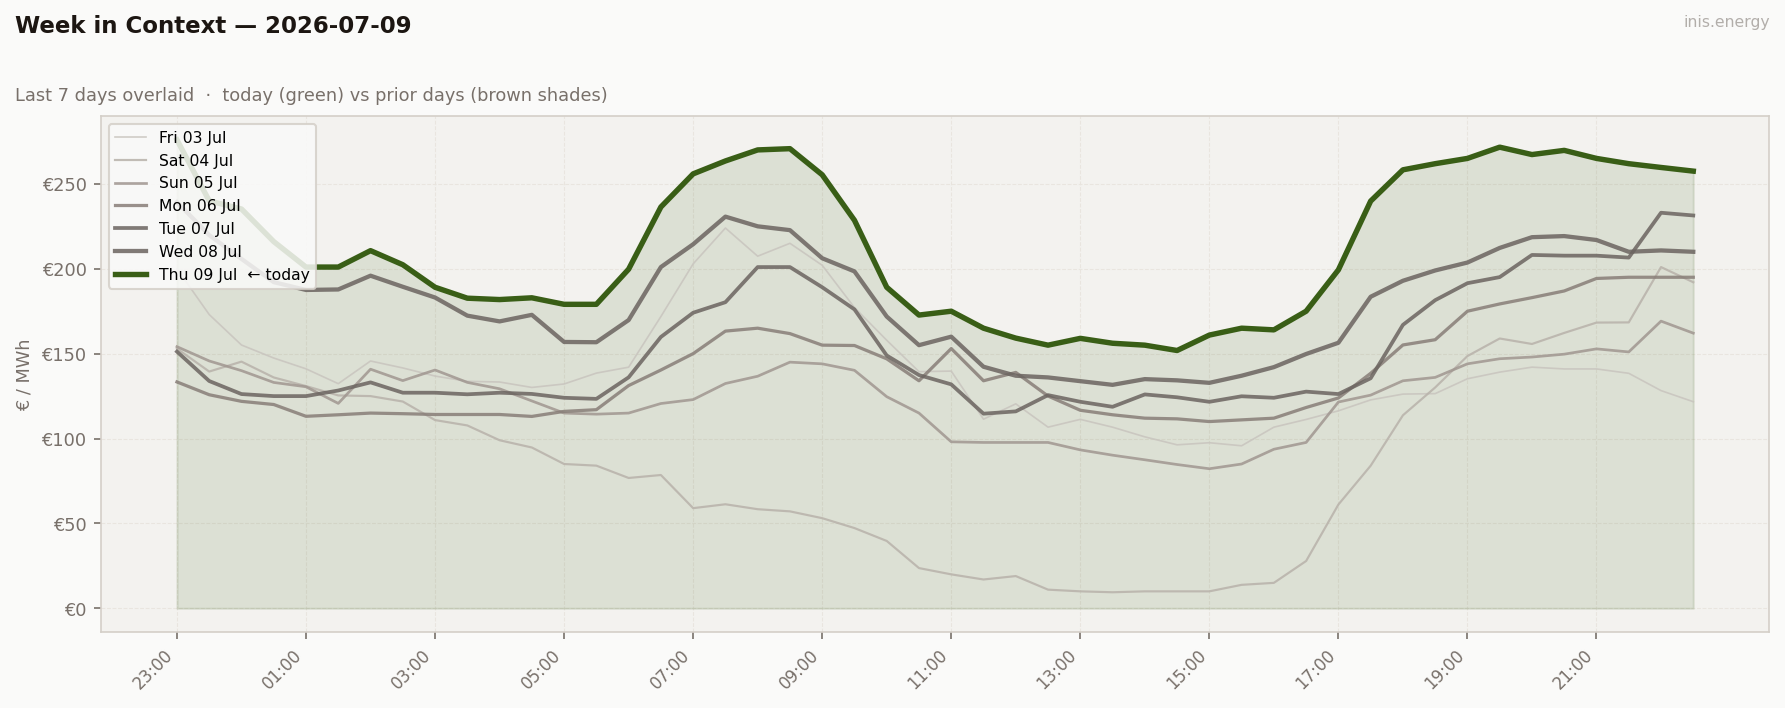
Four days in and the wind drought keeps getting worse, not better: 29% Monday, 16% Tuesday, 5.2% Wednesday, now 4.5% Thursday. Price has climbed in lockstep — Thursday’s €213 mean and €276 peak are both new highs for the week.
Price Duration Curve #
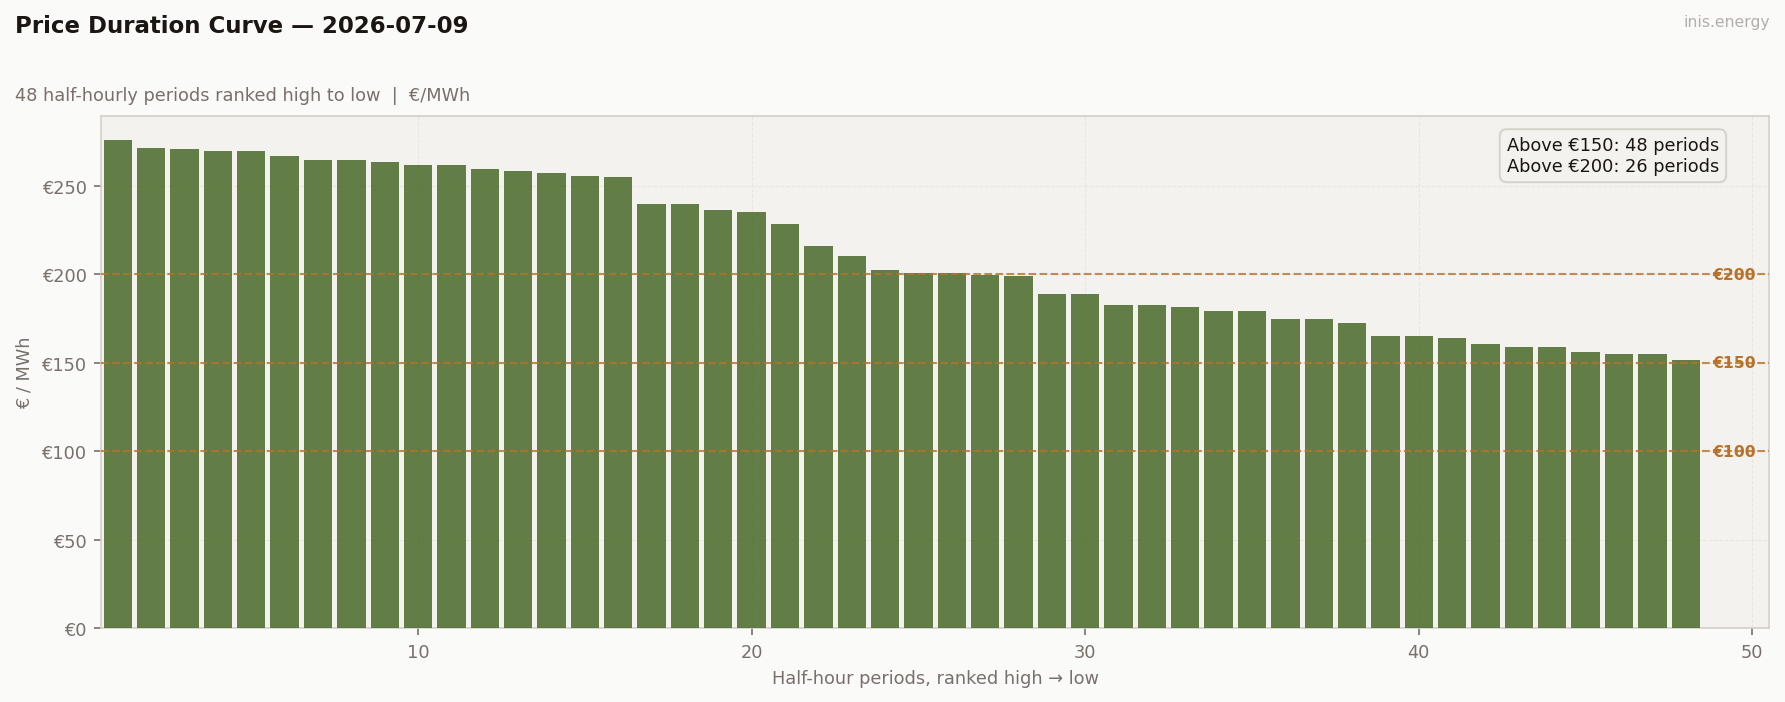
Periods above €150: 48 (100% of day) · Above €200: 26 (54% of day)
Peak / Off-Peak Spread #
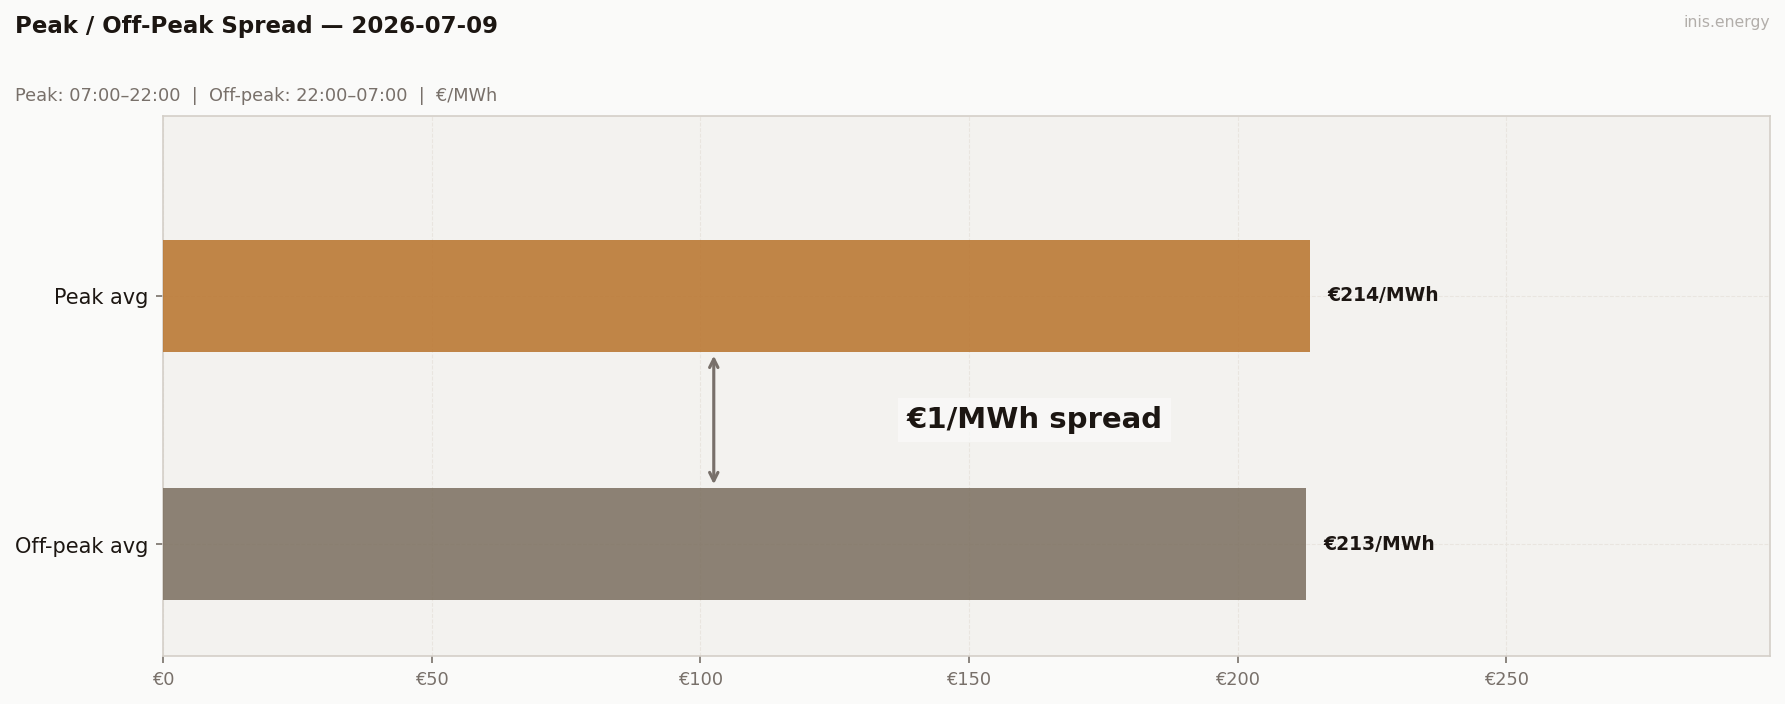
Peak avg (07:00–22:00): €213.56/MWh · Off-peak avg: €212.79/MWh · Spread: €0.77/MWh
Spread is essentially flat at €0.77 — not because things eased, but because there was nowhere to hide. Both windows sat equally high; the drought didn’t spare day or night.
BESS Dispatch Signal #
| Price | Time | Energy | Value | |
|---|---|---|---|---|
| Charge | €156/MWh | 13:00 | 2 MWh | −€311 |
| Discharge | €268/MWh | 19:00 | 1.7 MWh (85% RTE) | +€456 |
| Gross profit | €145 | |||
| Price spread | €113/MWh | ROI: 46.7% |
Simulated 1MW/2MWh battery, one optimal DAM cycle. Gross before network charges and capacity costs.
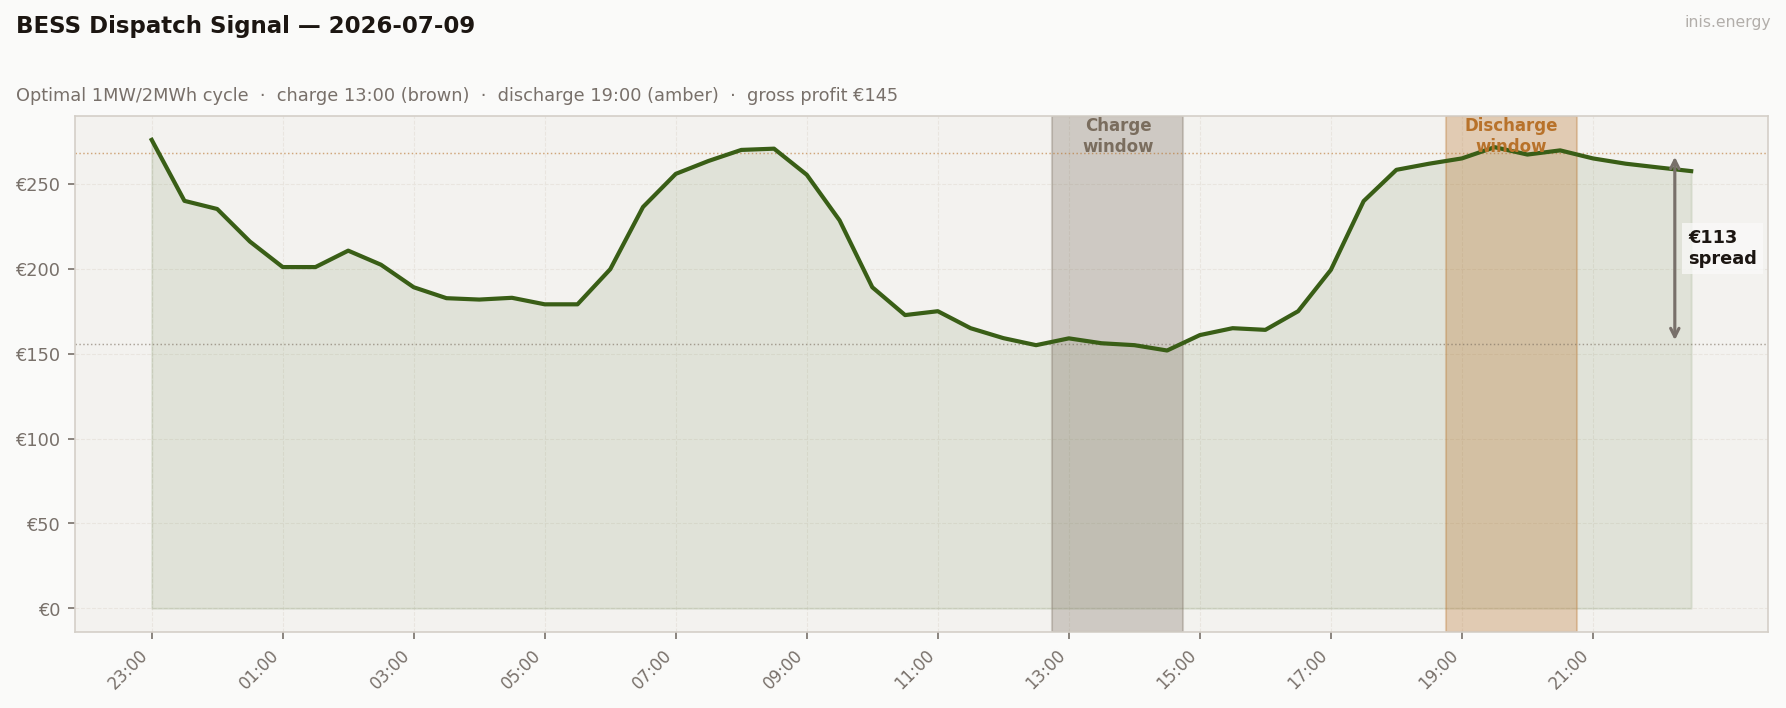
Grabbed the one soft patch of the day, €156 at 13:00 during the midday lull, and discharged into the evening ramp at €268. ROI 46.7%, the best trade so far this week — even a compressed, elevated day still throws up a workable spread if you catch the right 30 minutes.
Commentary #
Thursday is the low point of the wind drought that’s been building since Monday. 29% → 16% → 5.2% → 4.5% — four straight days of less and less wind, and price has climbed to match every step: €195, €233, €239, now €276.
Unlike Wednesday’s single flat scarcity plateau, Thursday has actual shape — a morning ramp, a midday lull, an evening ramp — but the lull barely counts as relief, bottoming at €151.86 while Wednesday managed €131.63. There’s simply no wind left to bring price down anywhere.
Friday is the question now: does the drought finally break, or does the market grind even tighter into the weekend?
Half-hourly data — 2026-07-09
| Period | Time | Price (€/MWh) | Wind % |
|---|---|---|---|
| 1 | 23:00 | 275.94 | 3.0% |
| 2 | 23:30 | 240.00 | 3.4% |
| 3 | 00:00 | 235.21 | 12.2% |
| 4 | 00:30 | 216.01 | 11.0% |
| 5 | 01:00 | 201.00 | 10.6% |
| 6 | 01:30 | 201.00 | 10.4% |
| 7 | 02:00 | 210.67 | 10.0% |
| 8 | 02:30 | 202.38 | 9.9% |
| 9 | 03:00 | 189.11 | 10.1% |
| 10 | 03:30 | 182.67 | 9.8% |
| 11 | 04:00 | 181.86 | 8.5% |
| 12 | 04:30 | 182.90 | 8.7% |
| 13 | 05:00 | 179.06 | 7.3% |
| 14 | 05:30 | 179.06 | 6.3% |
| 15 | 06:00 | 199.75 | 5.7% |
| 16 | 06:30 | 236.39 | 4.6% |
| 17 | 07:00 | 255.90 | 3.6% |
| 18 | 07:30 | 263.50 | 3.6% |
| 19 | 08:00 | 270.00 | 3.9% |
| 20 | 08:30 | 270.74 | 4.3% |
| 21 | 09:00 | 255.35 | 4.3% |
| 22 | 09:30 | 228.54 | 4.0% |
| 23 | 10:00 | 189.11 | 3.1% |
| 24 | 10:30 | 172.73 | 2.7% |
| 25 | 11:00 | 175.00 | 2.4% |
| 26 | 11:30 | 165.00 | 2.3% |
| 27 | 12:00 | 159.15 | 2.1% |
| 28 | 12:30 | 155.00 | 1.8% |
| 29 | 13:00 | 159.01 | 2.5% |
| 30 | 13:30 | 156.13 | 3.0% |
| 31 | 14:00 | 155.00 | 2.6% |
| 32 | 14:30 | 151.86 | 3.1% |
| 33 | 15:00 | 160.94 | 3.2% |
| 34 | 15:30 | 165.00 | 2.8% |
| 35 | 16:00 | 164.02 | 3.1% |
| 36 | 16:30 | 175.00 | 2.6% |
| 37 | 17:00 | 199.37 | 2.3% |
| 38 | 17:30 | 239.86 | 1.9% |
| 39 | 18:00 | 258.28 | 1.5% |
| 40 | 18:30 | 261.89 | 1.6% |
| 41 | 19:00 | 265.00 | 1.3% |
| 42 | 19:30 | 271.62 | 1.4% |
| 43 | 20:00 | 267.27 | 1.6% |
| 44 | 20:30 | 269.73 | 1.8% |
| 45 | 21:00 | 265.00 | 2.0% |
| 46 | 21:30 | 261.89 | 2.1% |
| 47 | 22:00 | 259.67 | 2.6% |
| 48 | 22:30 | 257.51 | 3.0% |
Compare your business electricity and gas rates in minutes with INIS Energy Brokers.
Compare rates