I-SEM Daily Briefing — 10 July 2026
Table of Contents
Market Snapshot
| Metric | Value |
|---|---|
| Mean DAM Price | €191.16/MWh |
| Median Price | €193.37/MWh |
| Std Dev | €32.89/MWh |
| Peak Price | €255.93/MWh (23:00) |
| Min Price | €142.75/MWh (13:00) |
| Price Range | €113.18/MWh |
| Periods above €150 | 38 of 48 (79%) |
| Periods above €200 | 18 of 48 (38%) |
| Peak Avg (07–22) | €183.85/MWh |
| Off-peak Avg (22–07) | €203.34/MWh |
| Peak/Off-Peak Spread | €-19.49/MWh |
| Wind % of Demand | 8.6% |
| Wind Range | 2.3%–29.3% |
| Mean Demand | 3824 MW |
Price Profile #
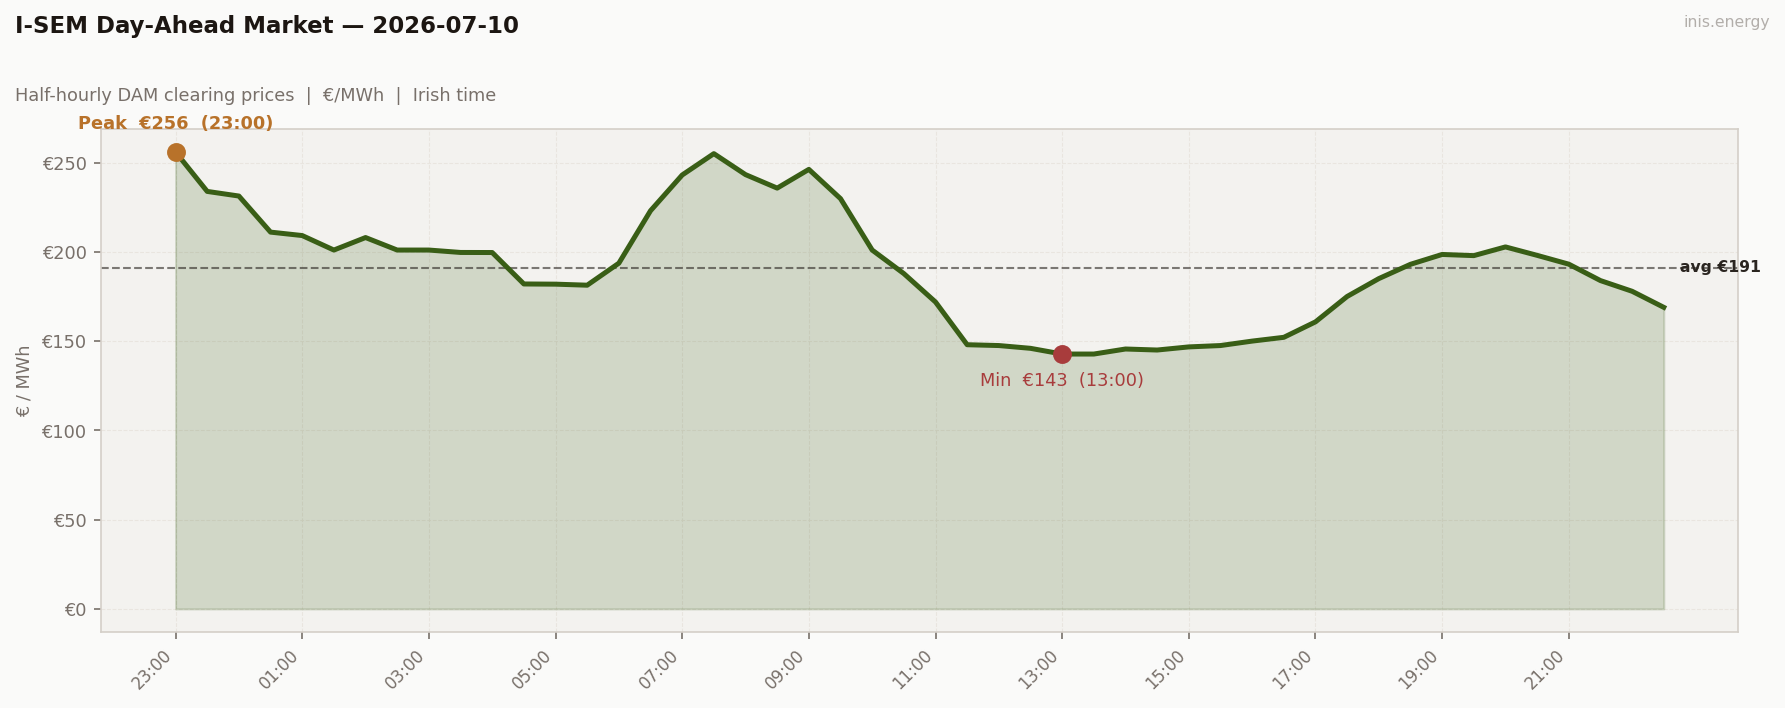
Std dev €32.89/MWh · Median €193.37/MWh · Periods above €150: 38 of 48 (79%)
Friday eases off Thursday’s extremes — mean down to €191.16 from €213.27, peak down to €255.93 from €275.94 — but the shape is familiar: a sharp early ramp to €255 by 07:30, a midday floor near €143–152, then a slower climb into the close. Almost four in five periods are still above €150.
Price vs Wind #
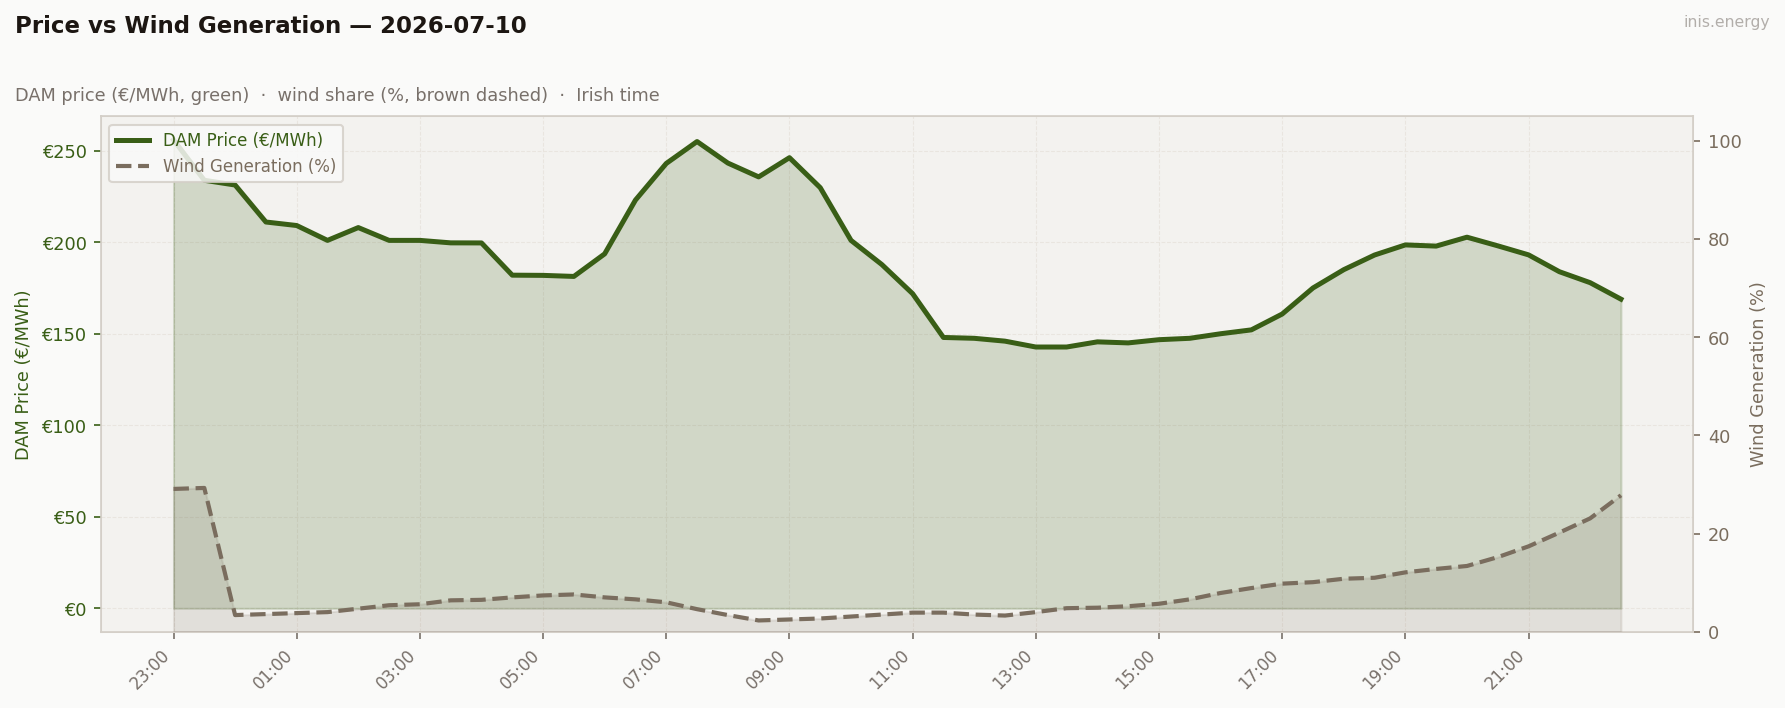
Mean wind: 8.6% · Range: 2.3%–29.3%
Wind ticks up to 8.6% on average, still thin, but the tail end of the day is different — it climbs past 20% through the evening and hits 29.3% by 23:00. That late build is the first real sign of wind returning this week.
Week in Context #
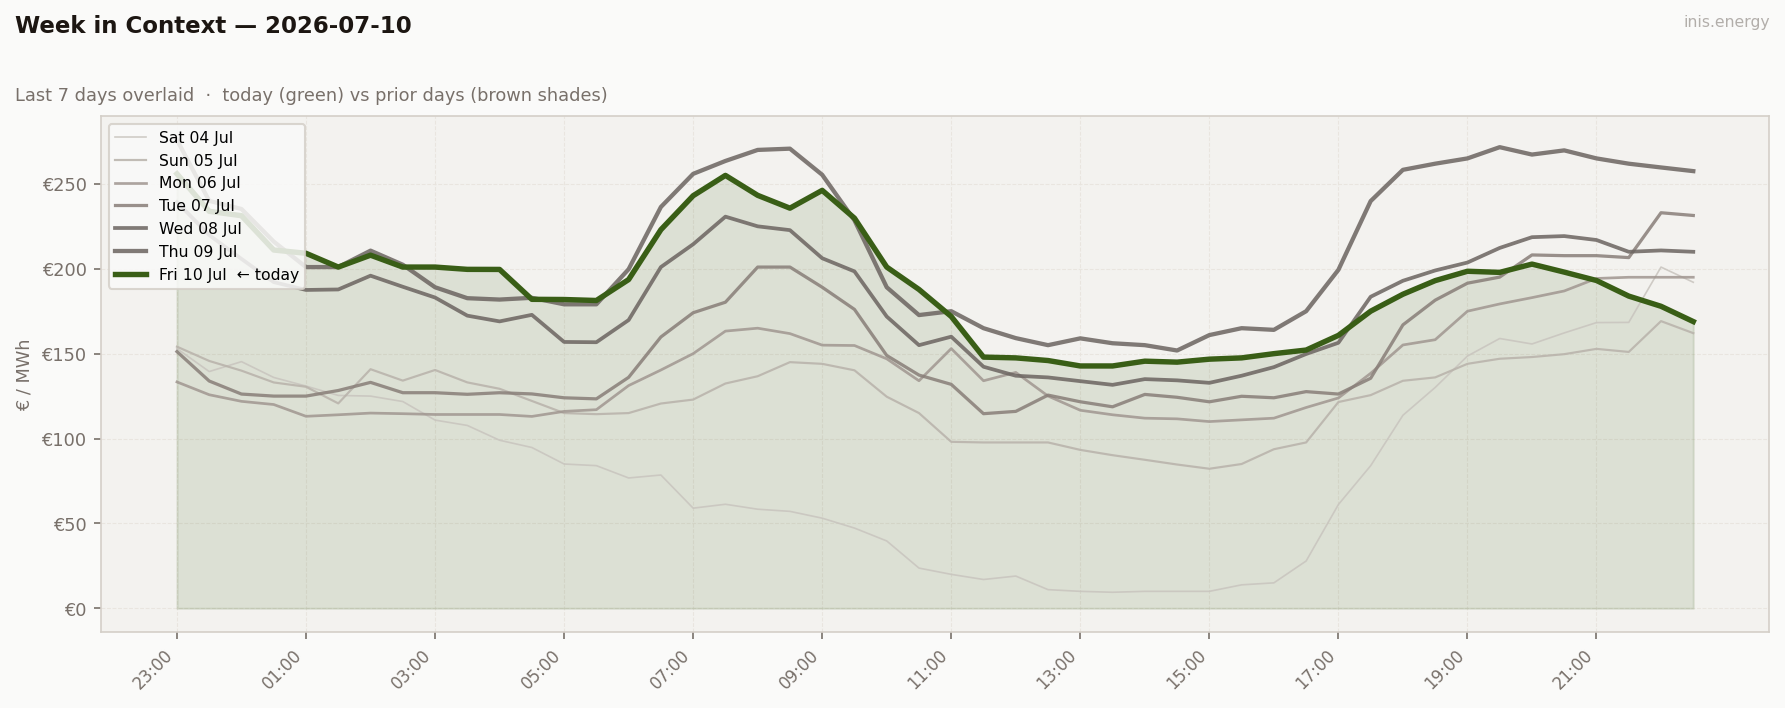
Wind bottomed on Thursday at 4.5%, and Friday’s 8.6% is the first uptick since Monday. Price follows, easing for the first time in four days — still tight, but the drought looks like it’s turning.
Price Duration Curve #
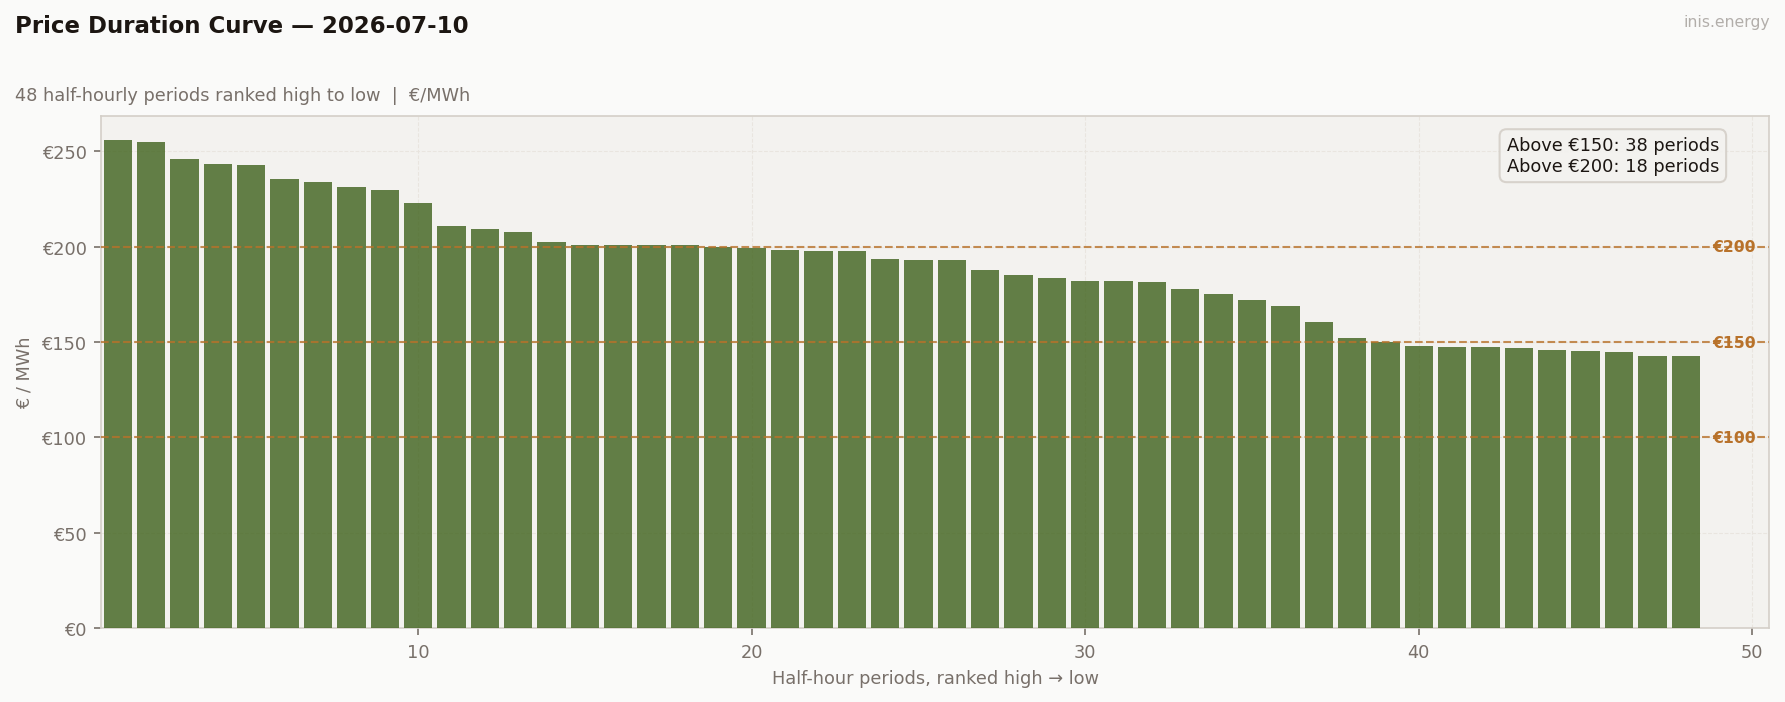
Periods above €150: 38 (79% of day) · Above €200: 18 (38% of day)
Peak / Off-Peak Spread #
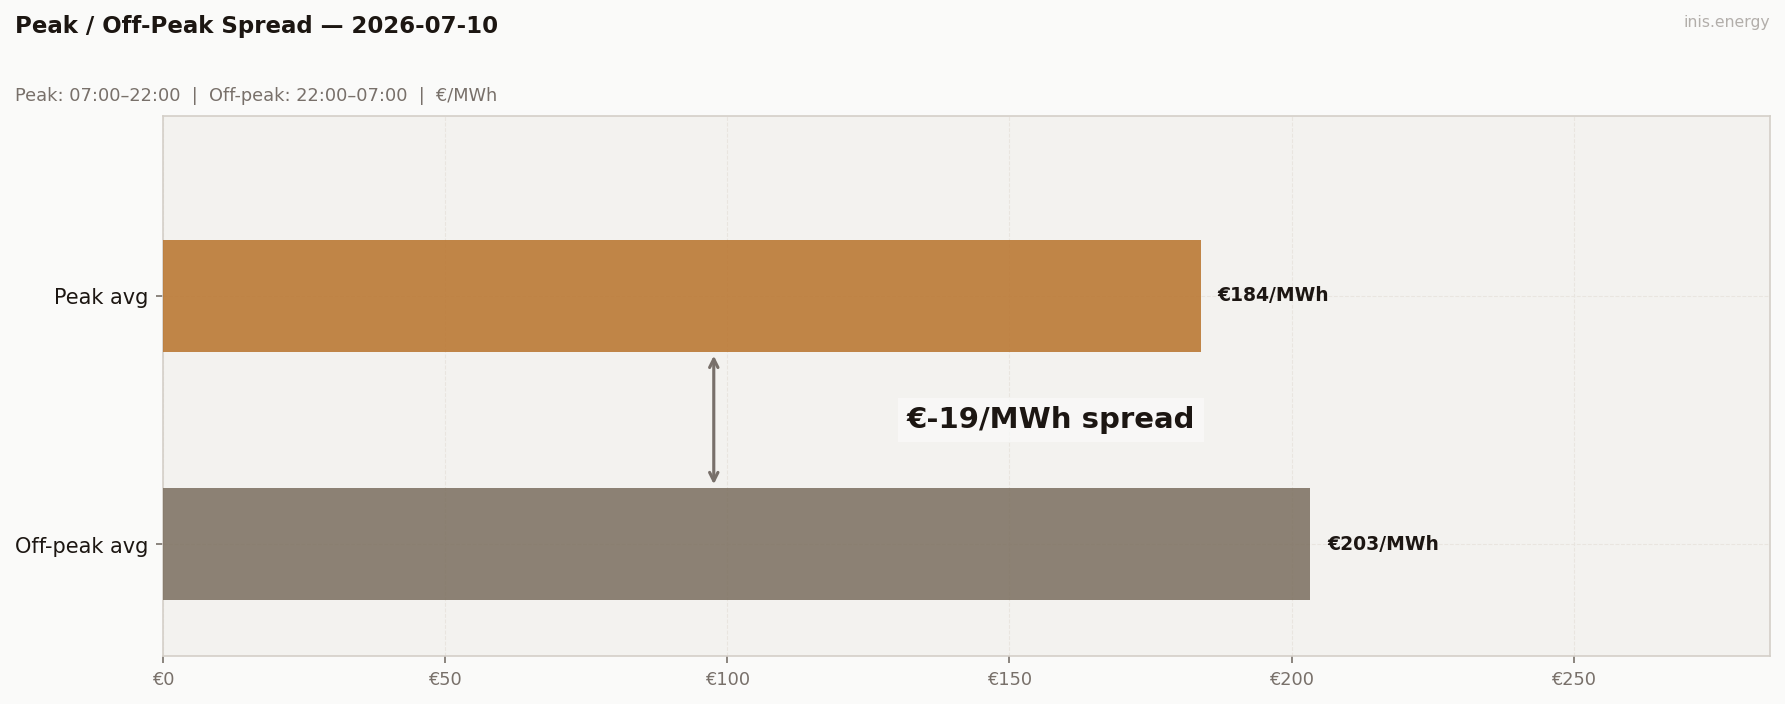
Peak avg (07:00–22:00): €183.85/MWh · Off-peak avg: €203.34/MWh · Spread: €-19.49/MWh
Spread flips negative again, €-19.49 — the overnight hours, still starved of wind through the small hours, stay elevated even as the daytime floor eases and the evening wind pickup starts pulling the close down.
BESS Dispatch Signal #
| Price | Time | Energy | Value | |
|---|---|---|---|---|
| Charge | €144/MWh | 13:00 | 2 MWh | −€288 |
| Discharge | €199/MWh | 19:00 | 1.7 MWh (85% RTE) | +€339 |
| Gross profit | €51 | |||
| Price spread | €55/MWh | ROI: 17.6% |
Simulated 1MW/2MWh battery, one optimal DAM cycle. Gross before network charges and capacity costs.
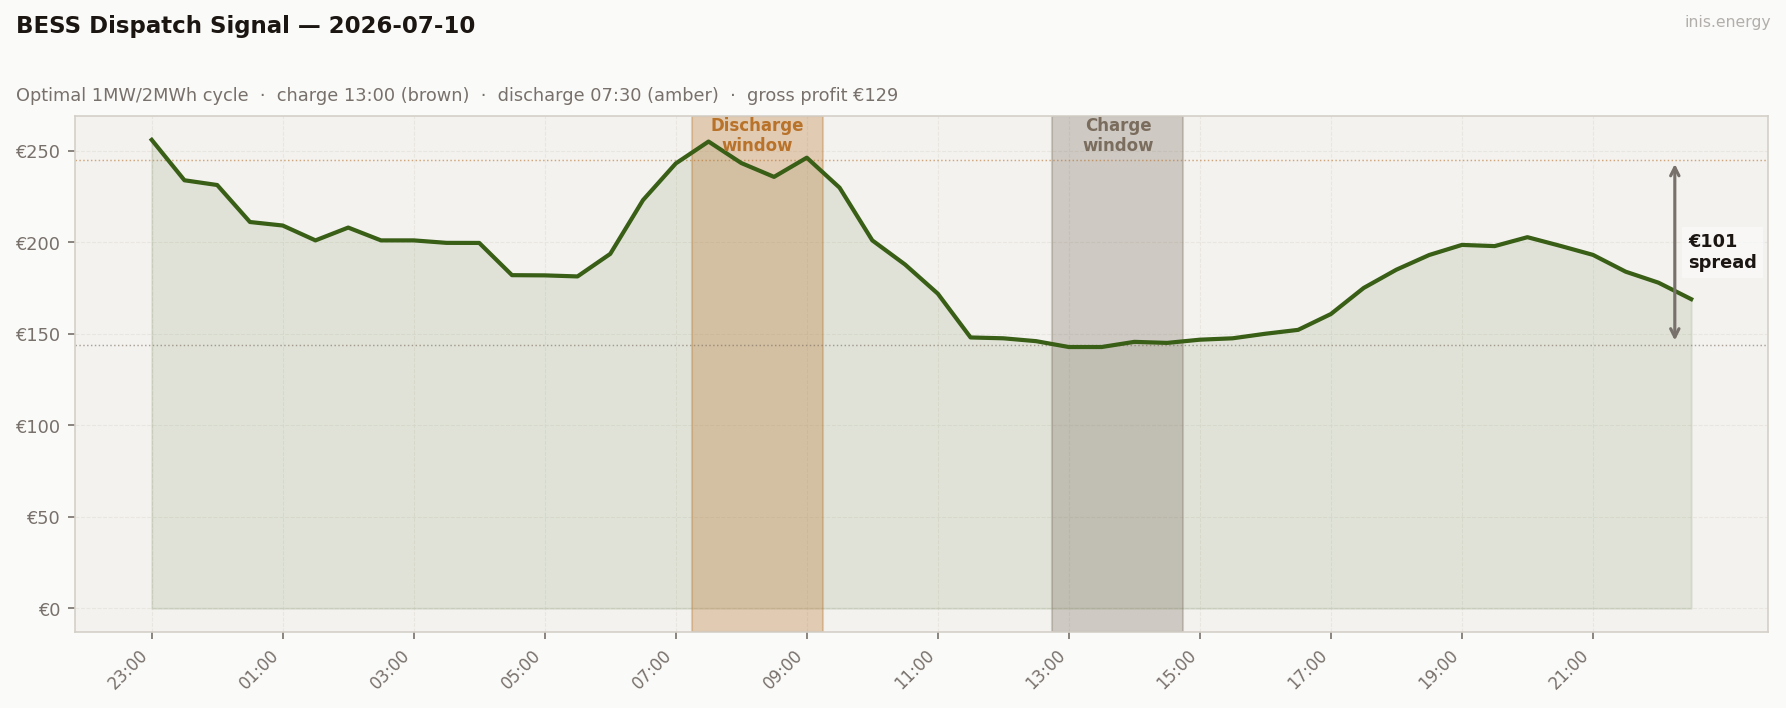
Updated 2026-08-27: prose previously described a discharge into the 07:30 morning ramp, which falls before the 13:00 charge and is physically unreachable by a same-day cycle. The table already reflected the corrected evening discharge; the prose didn’t.
Charged into the midday floor at €144 (13:00), discharged into the evening peak at €199 (19:00) — the morning ramp’s €245 print was higher, but it happened before the charge, so it’s out of reach for a same-day cycle. ROI 17.6% — a modest trade, the spread narrower than the week’s extremes because the reachable peak is a step down from the morning’s.
Commentary #
Friday is the pivot. After three days of falling wind and climbing prices, wind nudges up to 8.6% — still historically weak, but a change of direction — and price eases for the first time since Monday, mean down to €191 from Thursday’s €213.
Most of the day still trades like a scarcity day: thin wind, elevated floor, a sharp morning ramp. But the late-evening wind build, climbing past 20% and touching 29% by the close, is a genuine signal — the first sustained wind since the drought began.
If that build carries into the weekend, Saturday could be the real break. Worth watching the overnight numbers first thing.
Half-hourly data — 2026-07-10
| Period | Time | Price (€/MWh) | Wind % |
|---|---|---|---|
| 1 | 23:00 | 255.93 | 29.1% |
| 2 | 23:30 | 233.84 | 29.3% |
| 3 | 00:00 | 231.25 | 3.4% |
| 4 | 00:30 | 211.04 | 3.6% |
| 5 | 01:00 | 209.12 | 3.8% |
| 6 | 01:30 | 201.00 | 4.0% |
| 7 | 02:00 | 208.00 | 4.7% |
| 8 | 02:30 | 201.00 | 5.4% |
| 9 | 03:00 | 201.00 | 5.6% |
| 10 | 03:30 | 199.65 | 6.4% |
| 11 | 04:00 | 199.61 | 6.5% |
| 12 | 04:30 | 182.00 | 7.0% |
| 13 | 05:00 | 181.89 | 7.4% |
| 14 | 05:30 | 181.31 | 7.6% |
| 15 | 06:00 | 193.64 | 7.0% |
| 16 | 06:30 | 223.02 | 6.6% |
| 17 | 07:00 | 243.03 | 6.0% |
| 18 | 07:30 | 255.00 | 4.6% |
| 19 | 08:00 | 243.25 | 3.4% |
| 20 | 08:30 | 235.69 | 2.3% |
| 21 | 09:00 | 246.18 | 2.5% |
| 22 | 09:30 | 229.80 | 2.7% |
| 23 | 10:00 | 201.00 | 3.1% |
| 24 | 10:30 | 187.81 | 3.5% |
| 25 | 11:00 | 171.89 | 3.9% |
| 26 | 11:30 | 147.97 | 3.9% |
| 27 | 12:00 | 147.51 | 3.5% |
| 28 | 12:30 | 145.95 | 3.3% |
| 29 | 13:00 | 142.75 | 4.0% |
| 30 | 13:30 | 142.75 | 4.8% |
| 31 | 14:00 | 145.57 | 4.9% |
| 32 | 14:30 | 145.00 | 5.2% |
| 33 | 15:00 | 146.75 | 5.7% |
| 34 | 15:30 | 147.51 | 6.6% |
| 35 | 16:00 | 150.00 | 7.9% |
| 36 | 16:30 | 152.12 | 8.9% |
| 37 | 17:00 | 160.77 | 9.8% |
| 38 | 17:30 | 175.00 | 10.1% |
| 39 | 18:00 | 185.00 | 10.8% |
| 40 | 18:30 | 193.01 | 11.0% |
| 41 | 19:00 | 198.53 | 12.1% |
| 42 | 19:30 | 197.88 | 12.8% |
| 43 | 20:00 | 202.75 | 13.4% |
| 44 | 20:30 | 198.03 | 15.2% |
| 45 | 21:00 | 193.09 | 17.4% |
| 46 | 21:30 | 183.90 | 20.2% |
| 47 | 22:00 | 177.90 | 23.1% |
| 48 | 22:30 | 168.90 | 27.8% |
Compare your business electricity and gas rates in minutes with INIS Energy Brokers.
Compare rates