I-SEM Daily Briefing — 11 July 2026
Table of Contents
Market Snapshot
| Metric | Value |
|---|---|
| Mean DAM Price | €141.51/MWh |
| Median Price | €140.61/MWh |
| Std Dev | €23.12/MWh |
| Peak Price | €185.85/MWh (23:00) |
| Min Price | €104.9/MWh (15:00) |
| Price Range | €80.95/MWh |
| Periods above €150 | 19 of 48 (40%) |
| Periods above €200 | 0 of 48 (0%) |
| Peak Avg (07–22) | €136.54/MWh |
| Off-peak Avg (22–07) | €149.8/MWh |
| Peak/Off-Peak Spread | €-13.26/MWh |
| Wind % of Demand | 24.9% |
| Wind Range | 17.7%–32.9% |
| Mean Demand | 3510 MW |
Price Profile #
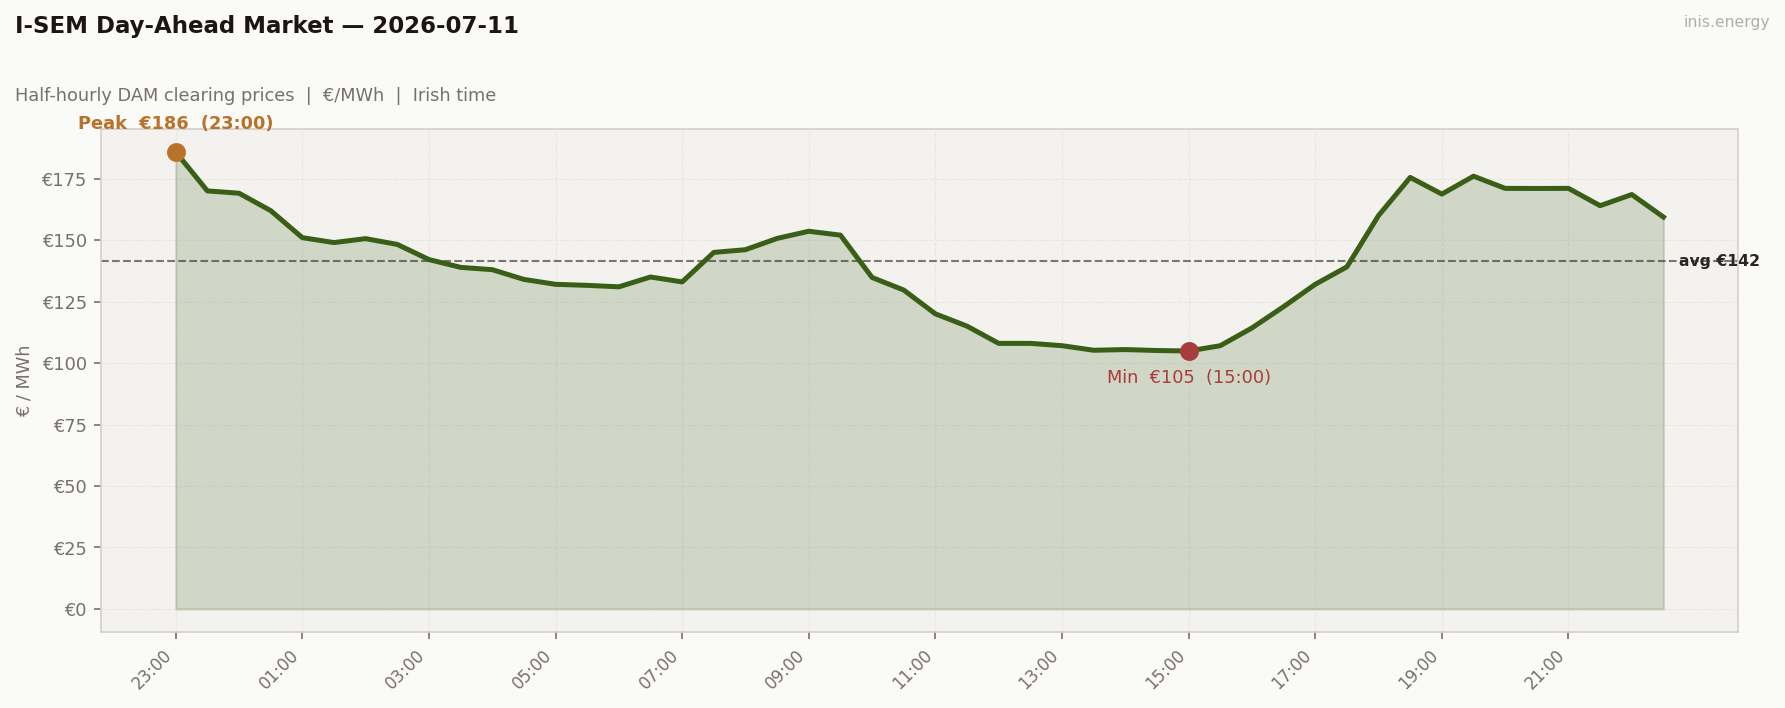
Std dev €23.12/MWh · Median €140.61/MWh · Periods above €150: 19 of 48 (40%)
Saturday is the calmest day of the week by a distance — std dev drops to €23.12 from Friday’s €32.89, and for the first time all week, not a single period closes above €200. Price holds a gentle range between €105 and €186, none of the sharp double-ramp shape of the drought days.
Price vs Wind #
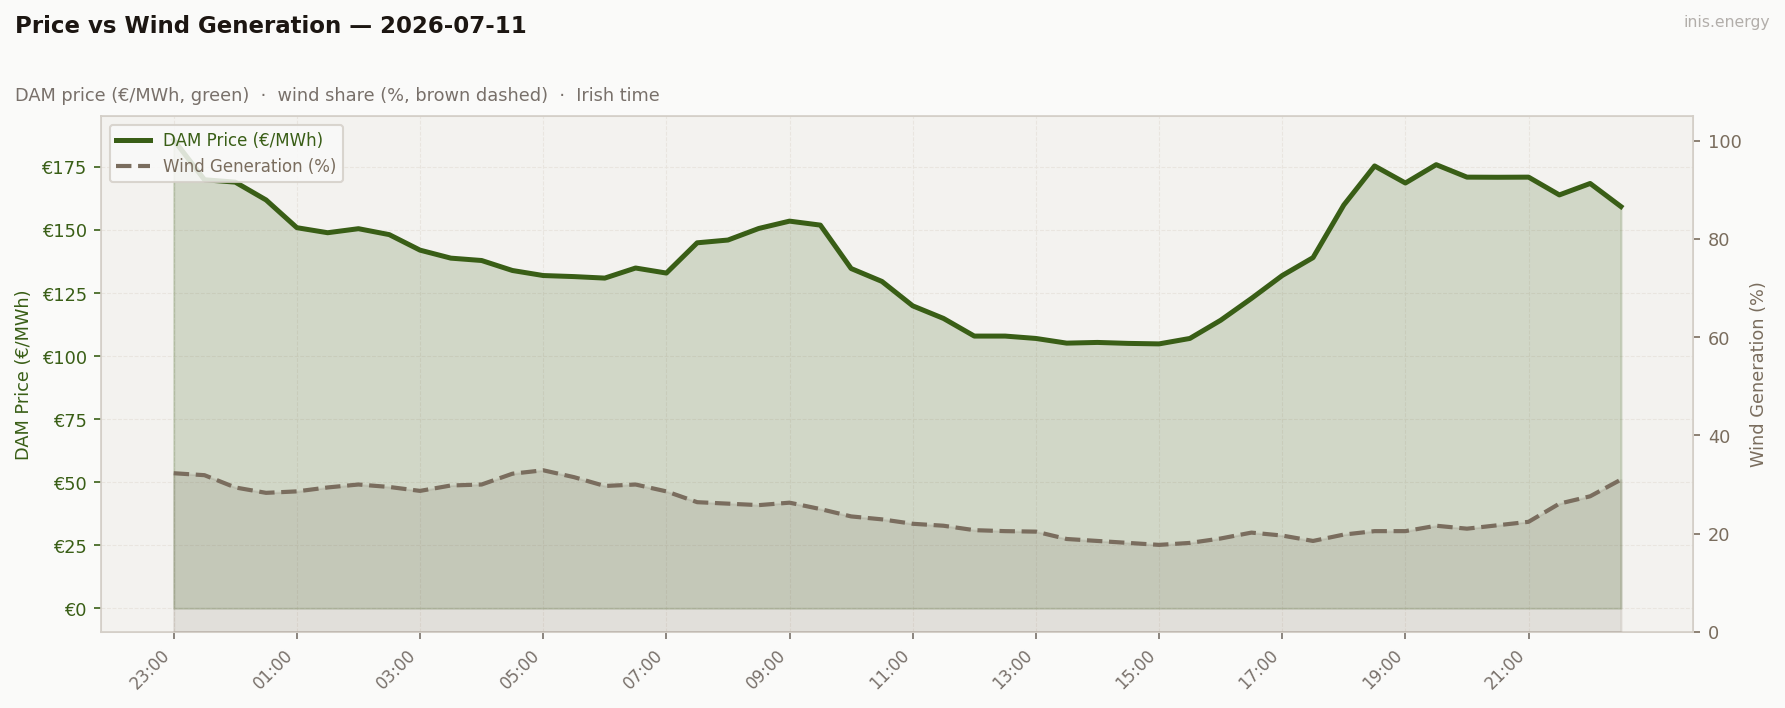
Mean wind: 24.9% · Range: 17.7%–32.9%
Wind nearly triples overnight, from Friday’s 8.6% average to 24.9%, and stays in a tight 18–33% band all day. With a real floor under generation, price never needs to spike to find supply.
Week in Context #
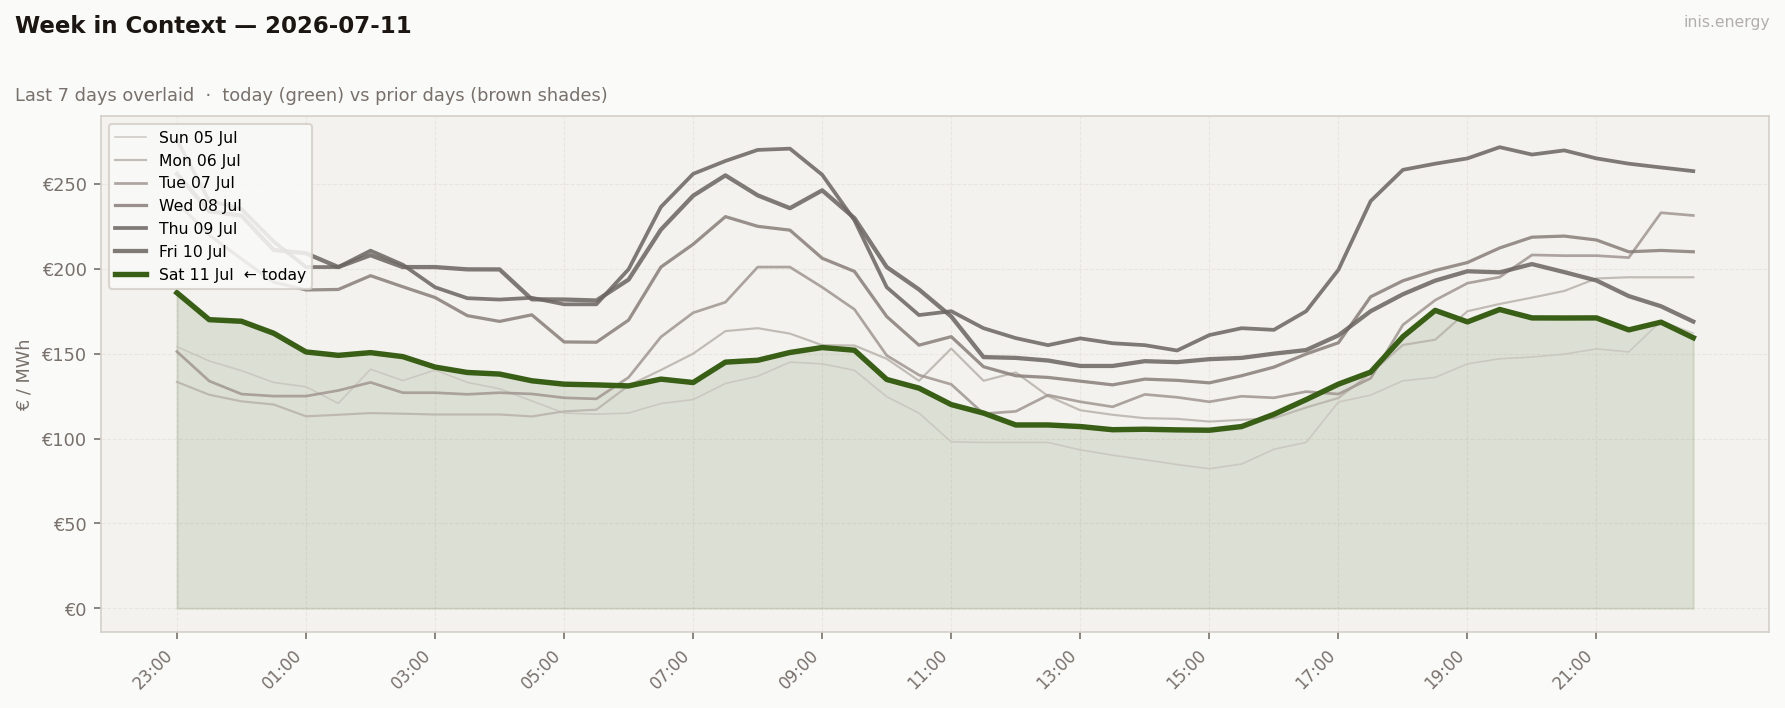
The turn that started building late Friday completes here: wind up from 8.6% to 24.9%, price down from €191 to €142 mean, and the week’s first zero-scarcity day. Weekend demand easing to 3510 MW — the lowest of the week so far — helps too.
Price Duration Curve #
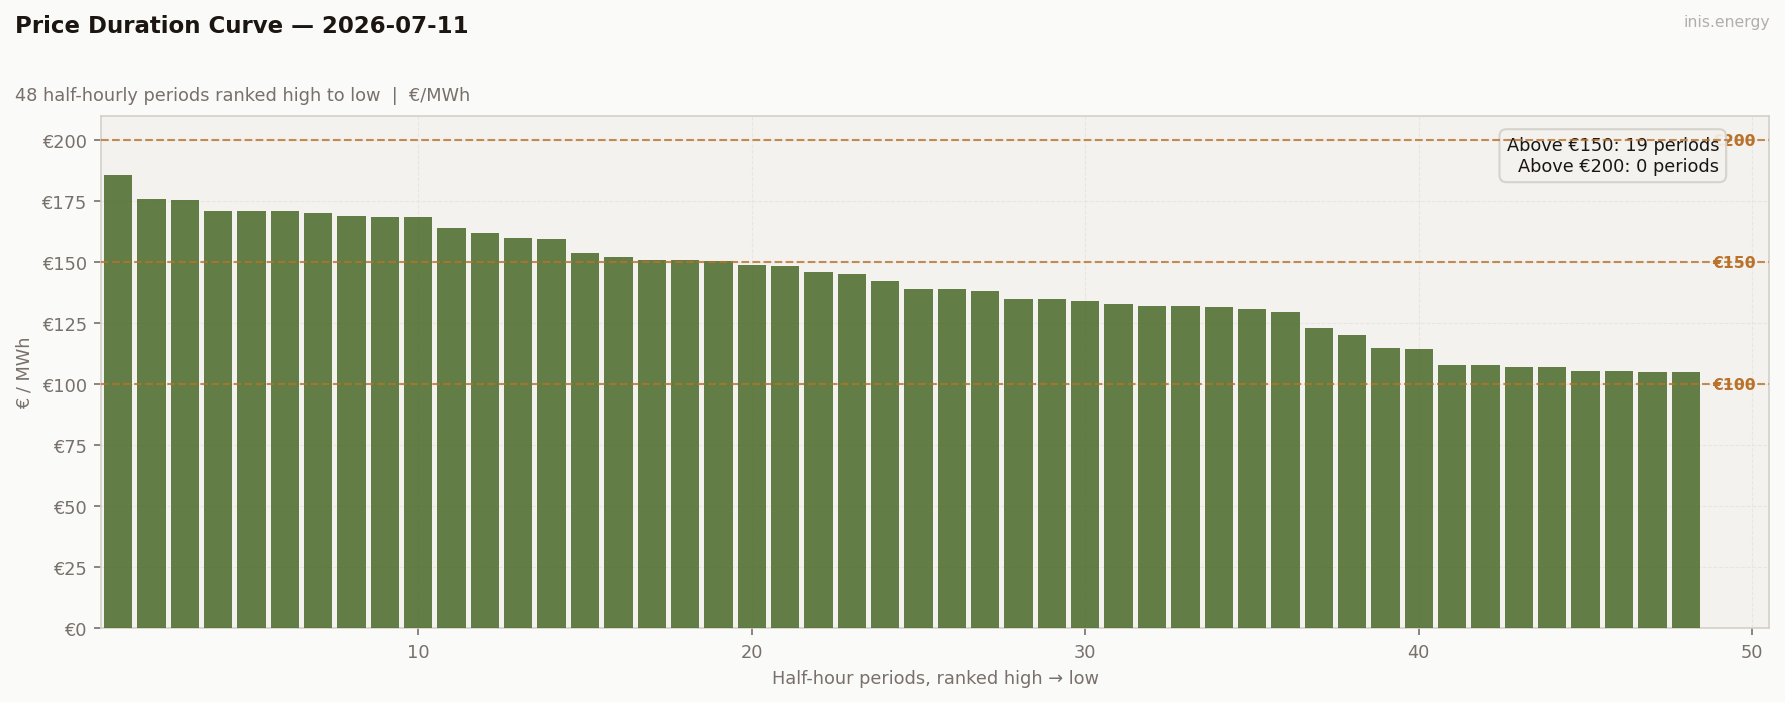
Periods above €150: 19 (40% of day) · Above €200: 0 (0% of day)
Peak / Off-Peak Spread #
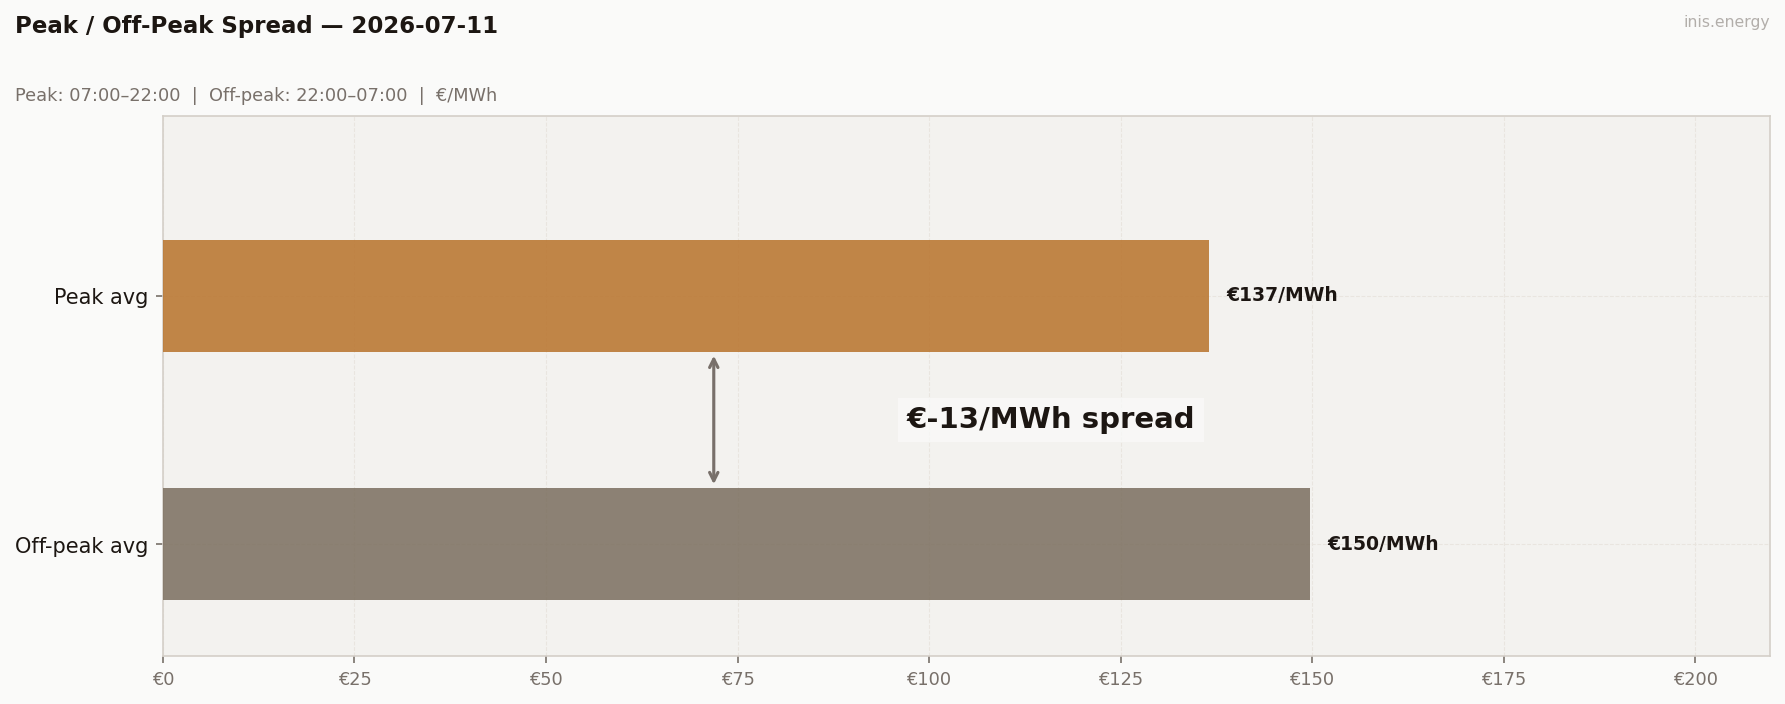
Peak avg (07:00–22:00): €136.54/MWh · Off-peak avg: €149.8/MWh · Spread: €-13.26/MWh
Spread stays negative at €-13.26, but for a calmer reason than earlier in the week — wind holds fairly steady all day, so it’s less a dramatic overnight collapse and more a mild, consistent premium on the off-peak hours.
BESS Dispatch Signal #
| Price | Time | Energy | Value | |
|---|---|---|---|---|
| Charge | €105/MWh | 13:30 | 2 MWh | −€210 |
| Discharge | €173/MWh | 18:30 | 1.7 MWh (85% RTE) | +€294 |
| Gross profit | €83 | |||
| Price spread | €68/MWh | ROI: 39.7% |
Simulated 1MW/2MWh battery, one optimal DAM cycle. Gross before network charges and capacity costs.
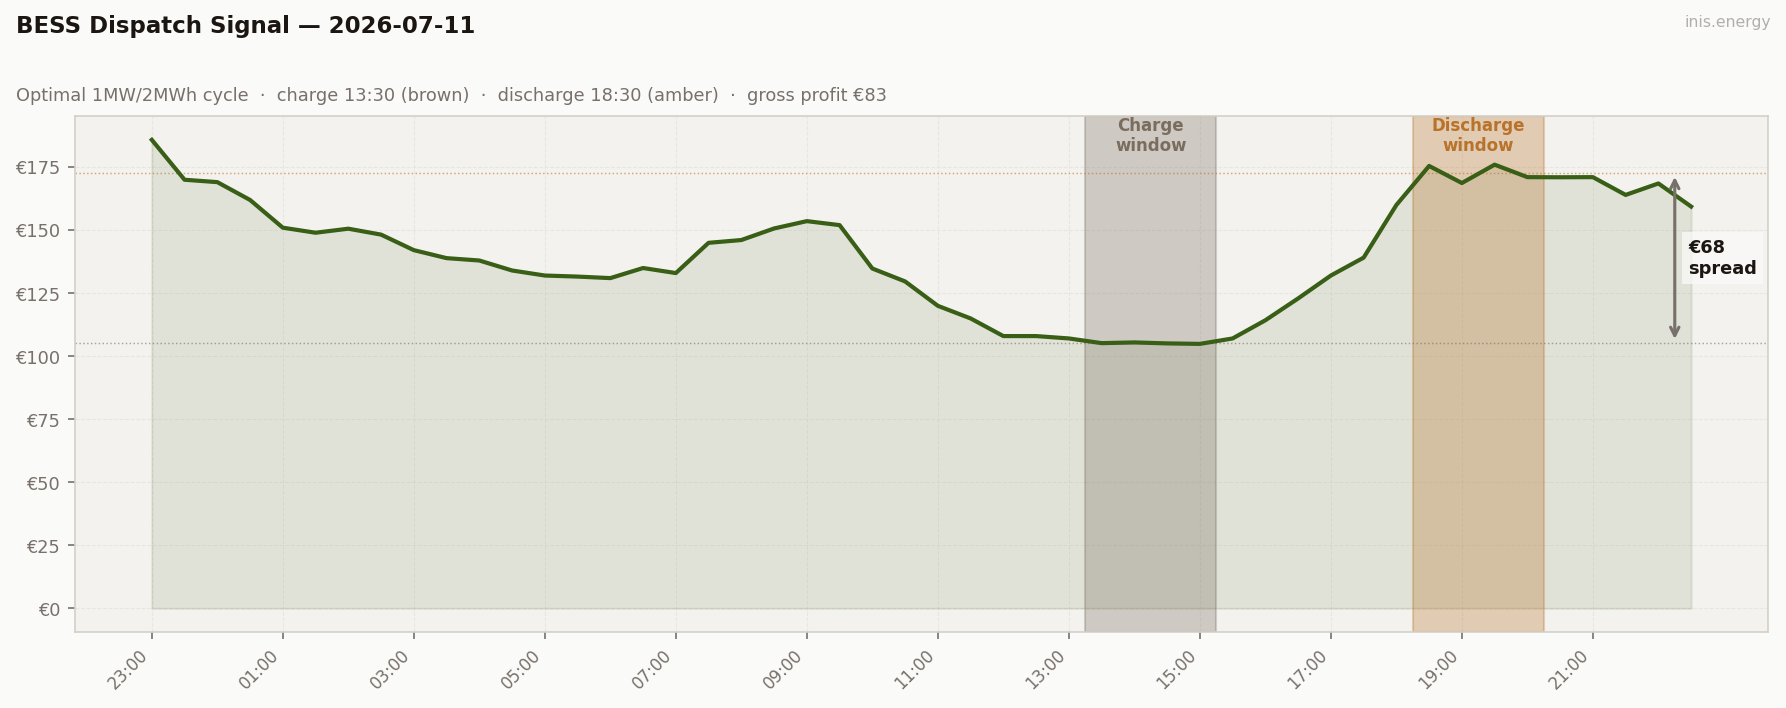
Charged at the €105 midday floor (13:30), discharged into the €173 evening ramp (18:30). ROI 39.7% — the smallest gross profit of the week, €83, but with everything sitting closer together there’s simply less spread on the table.
Commentary #
Saturday is the release valve. Four days of falling wind bottomed out Thursday at 4.5%; by Saturday it’s back to 24.9%, and the market shows it — zero periods above €200 for the first time this week, and the flattest, calmest profile of the seven days.
Lower weekend demand helps as much as the wind does. With generation adequate and demand easing off, there’s just no scarcity left to price in — a sharp contrast to Wednesday and Thursday’s near-permanent ceiling.
One day of calm doesn’t undo a week of tightening. Sunday’s wind numbers, and whether weekday demand returns Monday to test the recovery, will tell us if this sticks.
Half-hourly data — 2026-07-11
| Period | Time | Price (€/MWh) | Wind % |
|---|---|---|---|
| 1 | 23:00 | 185.85 | 32.3% |
| 2 | 23:30 | 170.02 | 31.9% |
| 3 | 00:00 | 169.07 | 29.4% |
| 4 | 00:30 | 162.00 | 28.3% |
| 5 | 01:00 | 151.00 | 28.6% |
| 6 | 01:30 | 149.00 | 29.4% |
| 7 | 02:00 | 150.60 | 30.0% |
| 8 | 02:30 | 148.25 | 29.5% |
| 9 | 03:00 | 142.09 | 28.7% |
| 10 | 03:30 | 138.92 | 29.8% |
| 11 | 04:00 | 137.98 | 30.0% |
| 12 | 04:30 | 134.02 | 32.2% |
| 13 | 05:00 | 132.02 | 32.9% |
| 14 | 05:30 | 131.60 | 31.5% |
| 15 | 06:00 | 131.00 | 29.7% |
| 16 | 06:30 | 135.00 | 30.0% |
| 17 | 07:00 | 133.00 | 28.6% |
| 18 | 07:30 | 145.00 | 26.4% |
| 19 | 08:00 | 146.10 | 26.1% |
| 20 | 08:30 | 150.69 | 25.8% |
| 21 | 09:00 | 153.60 | 26.3% |
| 22 | 09:30 | 152.02 | 25.0% |
| 23 | 10:00 | 134.80 | 23.5% |
| 24 | 10:30 | 129.68 | 22.9% |
| 25 | 11:00 | 120.00 | 22.0% |
| 26 | 11:30 | 115.00 | 21.6% |
| 27 | 12:00 | 108.00 | 20.7% |
| 28 | 12:30 | 108.00 | 20.5% |
| 29 | 13:00 | 107.06 | 20.4% |
| 30 | 13:30 | 105.20 | 18.9% |
| 31 | 14:00 | 105.48 | 18.5% |
| 32 | 14:30 | 105.10 | 18.1% |
| 33 | 15:00 | 104.90 | 17.7% |
| 34 | 15:30 | 107.06 | 18.1% |
| 35 | 16:00 | 114.27 | 19.0% |
| 36 | 16:30 | 122.93 | 20.2% |
| 37 | 17:00 | 132.02 | 19.6% |
| 38 | 17:30 | 139.12 | 18.5% |
| 39 | 18:00 | 160.00 | 19.8% |
| 40 | 18:30 | 175.49 | 20.5% |
| 41 | 19:00 | 168.72 | 20.5% |
| 42 | 19:30 | 176.00 | 21.6% |
| 43 | 20:00 | 171.05 | 21.0% |
| 44 | 20:30 | 171.00 | 21.7% |
| 45 | 21:00 | 171.05 | 22.4% |
| 46 | 21:30 | 164.00 | 26.1% |
| 47 | 22:00 | 168.54 | 27.6% |
| 48 | 22:30 | 159.38 | 31.0% |
Compare your business electricity and gas rates in minutes with INIS Energy Brokers.
Compare rates