I-SEM Daily Briefing — 12 July 2026
Table of Contents
Market Snapshot
| Metric | Value |
|---|---|
| Mean DAM Price | €130.7/MWh |
| Median Price | €147.89/MWh |
| Std Dev | €47.97/MWh |
| Peak Price | €208.32/MWh (03:00) |
| Min Price | €46.31/MWh (15:00) |
| Price Range | €162.01/MWh |
| Periods above €150 | 23 of 48 (48%) |
| Periods above €200 | 1 of 48 (2%) |
| Peak Avg (07–22) | €105.17/MWh |
| Off-peak Avg (22–07) | €173.25/MWh |
| Peak/Off-Peak Spread | €-68.08/MWh |
| Wind % of Demand | 30.9% |
| Wind Range | 19.8%–50.9% |
| Mean Demand | 3348 MW |
Price Profile #
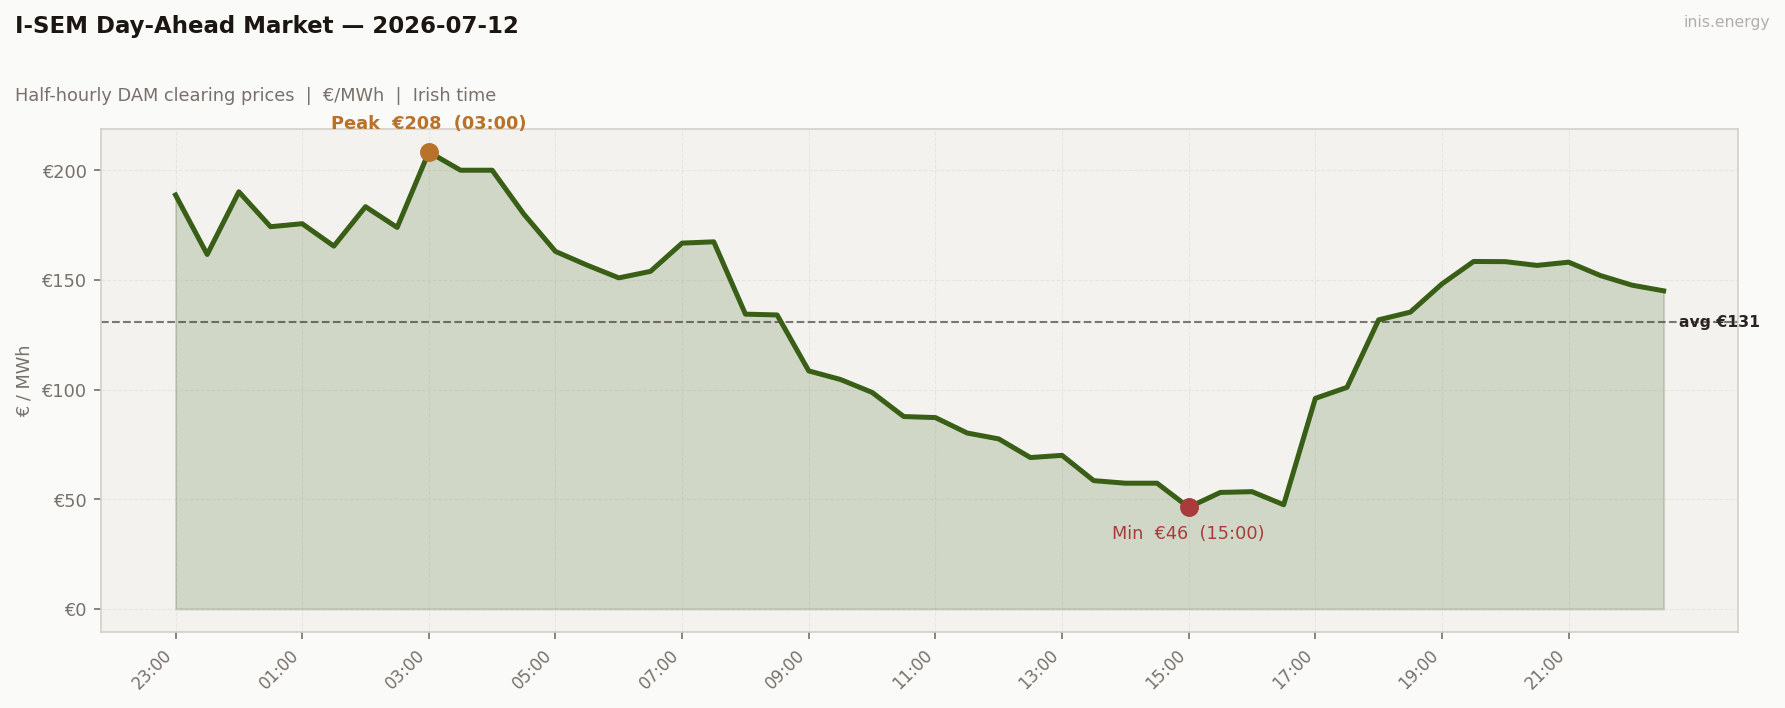
Std dev €47.97/MWh · Median €147.89/MWh · Periods above €150: 23 of 48 (48%)
Sunday is the most volatile day of the week — std dev jumps to €47.97, the widest range of any day (€162.01), and unusually the peak doesn’t land in the evening at all: €208.32 hits at 03:00. Price then craters through the afternoon to a week-low €46.31 at 15:00 before a modest evening recovery.
Price vs Wind #
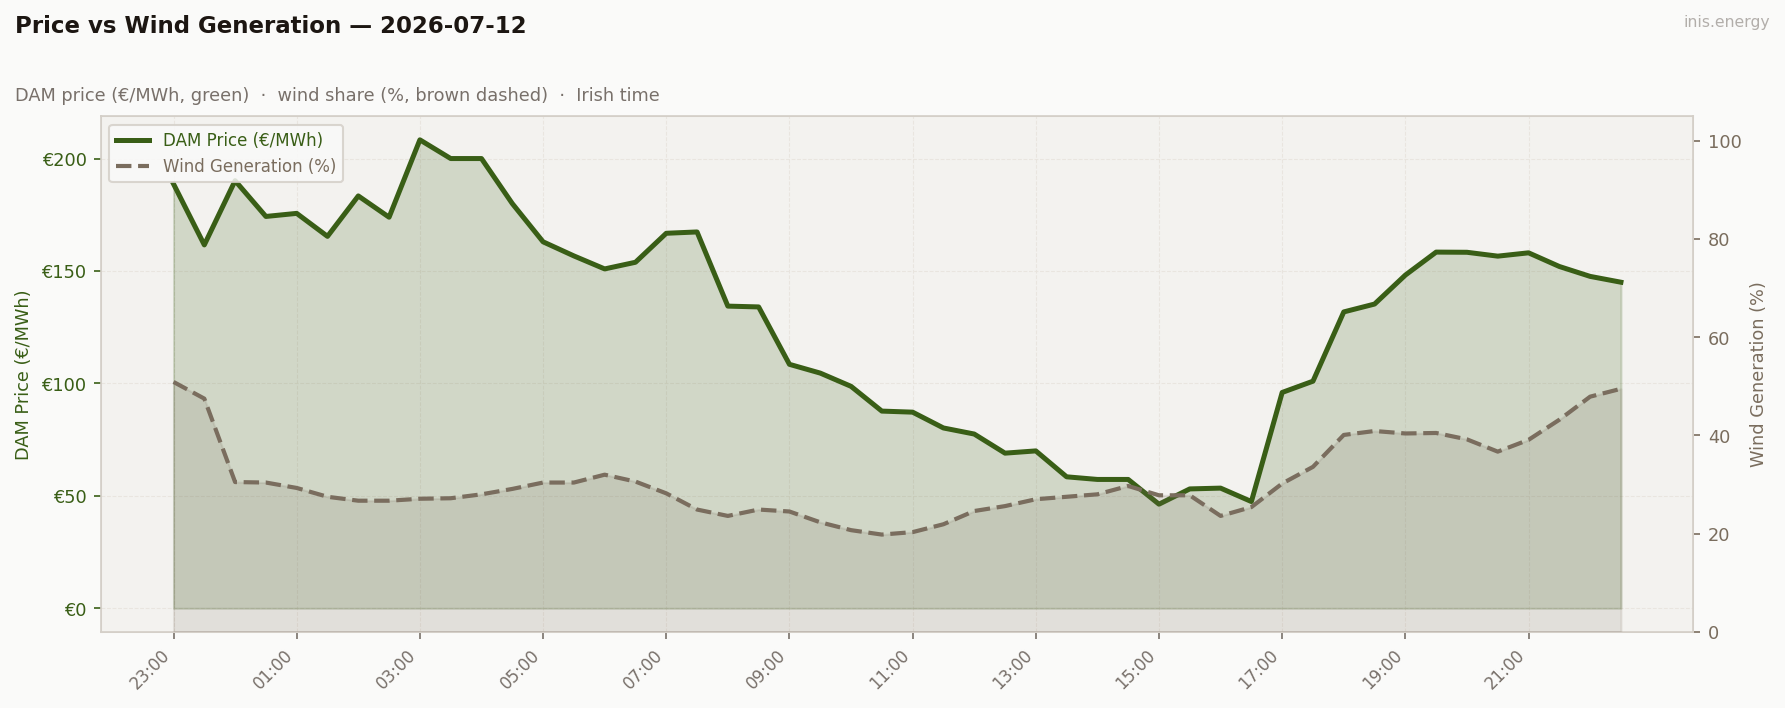
Mean wind: 30.9% · Range: 19.8%–50.9%
Wind is highest of the week at 30.9% on average, but it isn’t a clean story — the overnight peak actually coincides with a brief dip in wind around 02:00–03:00, while the deepest midday trough happens on ordinary wind, not exceptional wind. Weekend demand, at the week’s lowest (3348 MW), looks like the bigger driver of the afternoon collapse.
Week in Context #
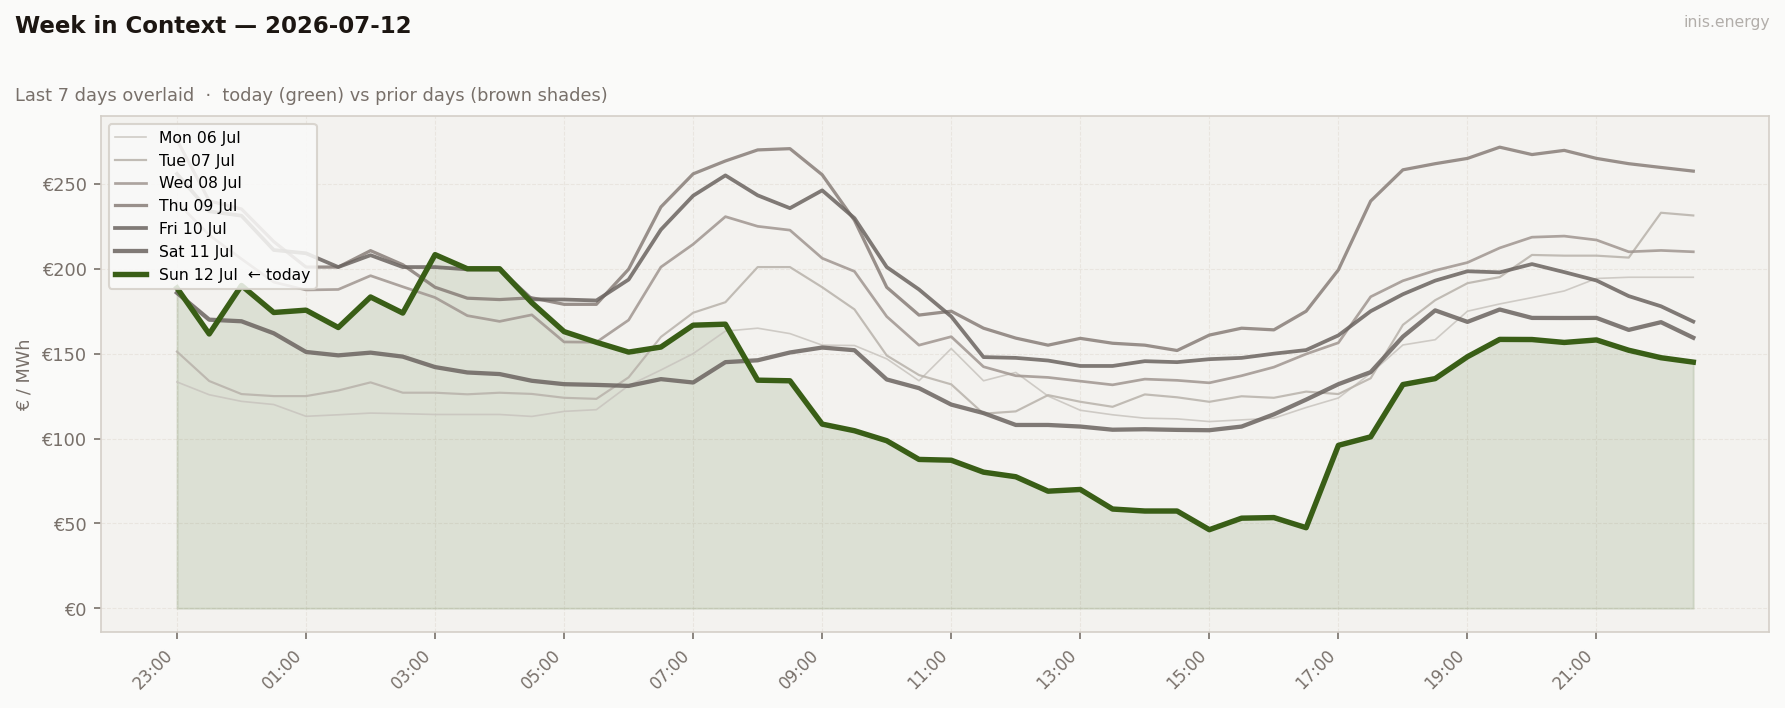
Sunday closes out the week with its highest wind (30.9%) and lowest mean price (€130.70) — the mirror image of Thursday’s drought low. Seven days, one full cycle: wind down from 29% to 4.5% and back up past 30%, price up from €182 to €276 and back down to €131.
Price Duration Curve #
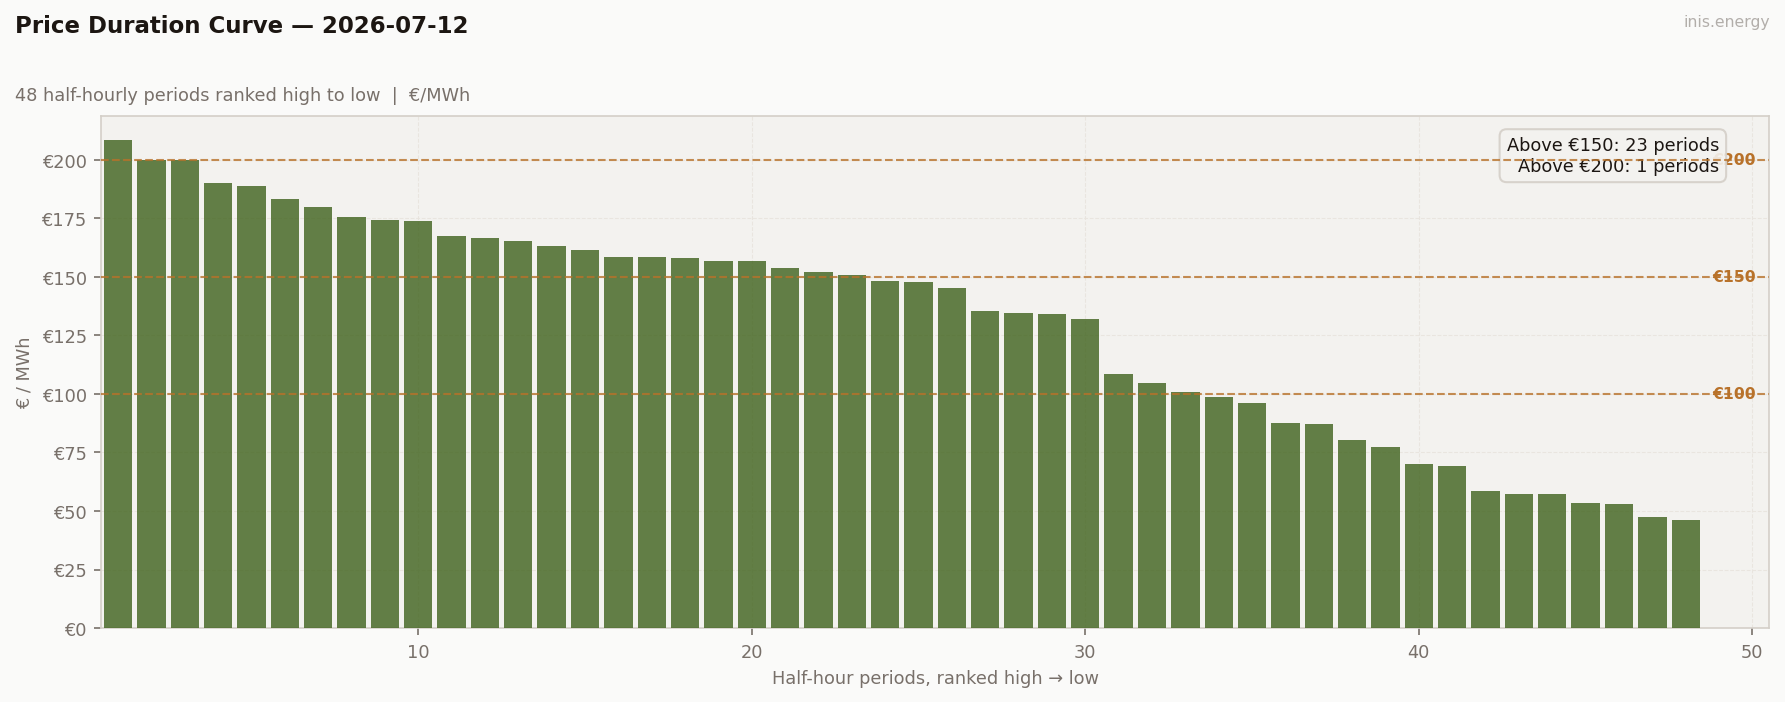
Periods above €150: 23 (48% of day) · Above €200: 1 (2% of day)
Peak / Off-Peak Spread #
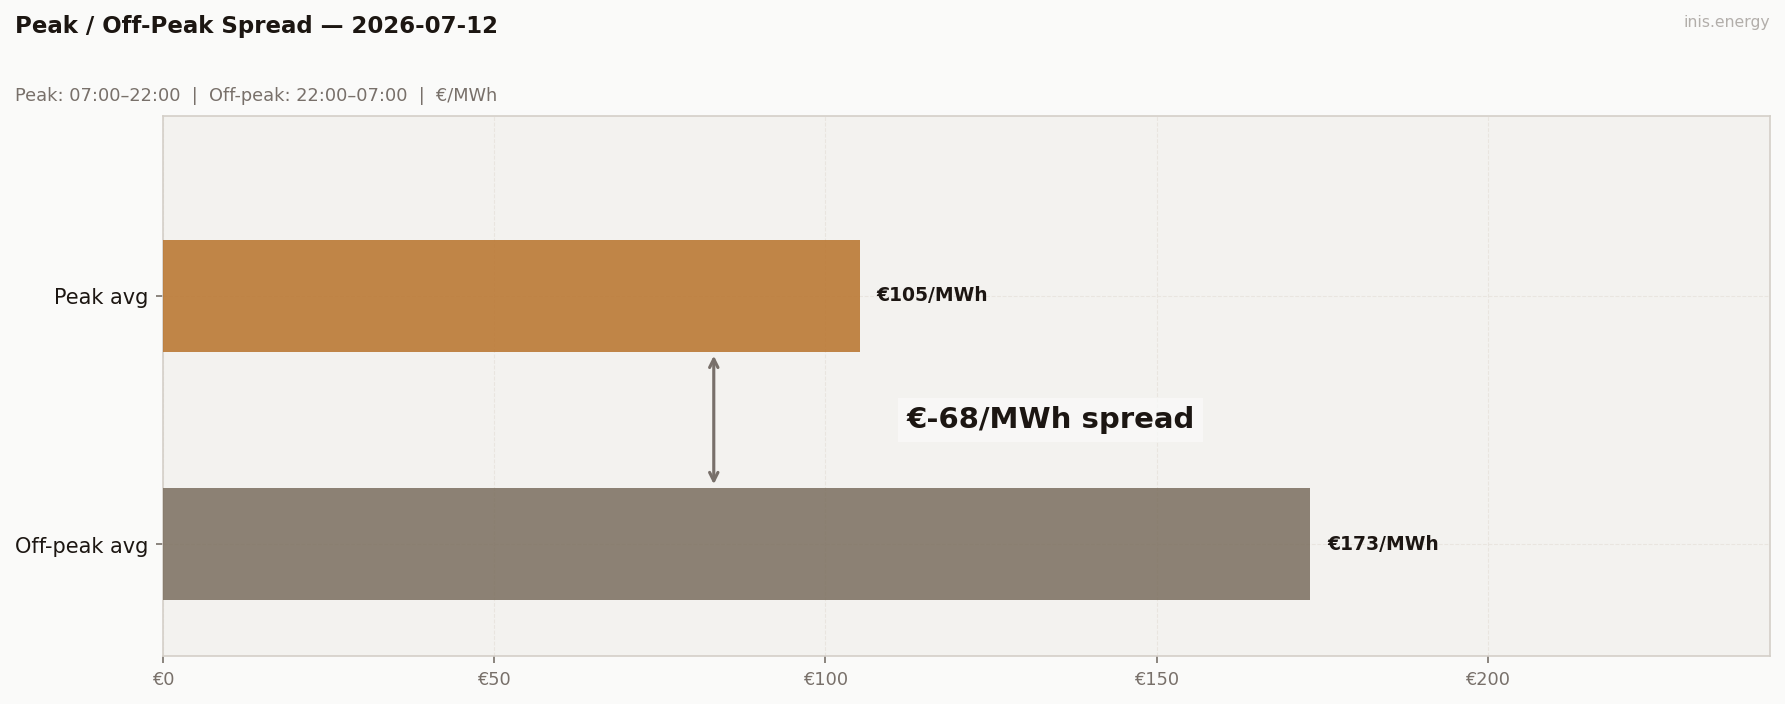
Peak avg (07:00–22:00): €105.17/MWh · Off-peak avg: €173.25/MWh · Spread: €-68.08/MWh
Spread inverts hardest here, €-68.08 — by far the week’s biggest — because the nominal “peak” window catches Sunday’s deep midday demand trough while the overnight hours catch the early scarcity spike. Labels like peak and off-peak stop meaning much on a low-demand, high-wind Sunday.
BESS Dispatch Signal #
| Price | Time | Energy | Value | |
|---|---|---|---|---|
| Charge | €50/MWh | 15:00 | 2 MWh | −€100 |
| Discharge | €158/MWh | 19:30 | 1.7 MWh (85% RTE) | +€268 |
| Gross profit | €168 | |||
| Price spread | €108/MWh | ROI: 167.9% |
Simulated 1MW/2MWh battery, one optimal DAM cycle. Gross before network charges and capacity costs.
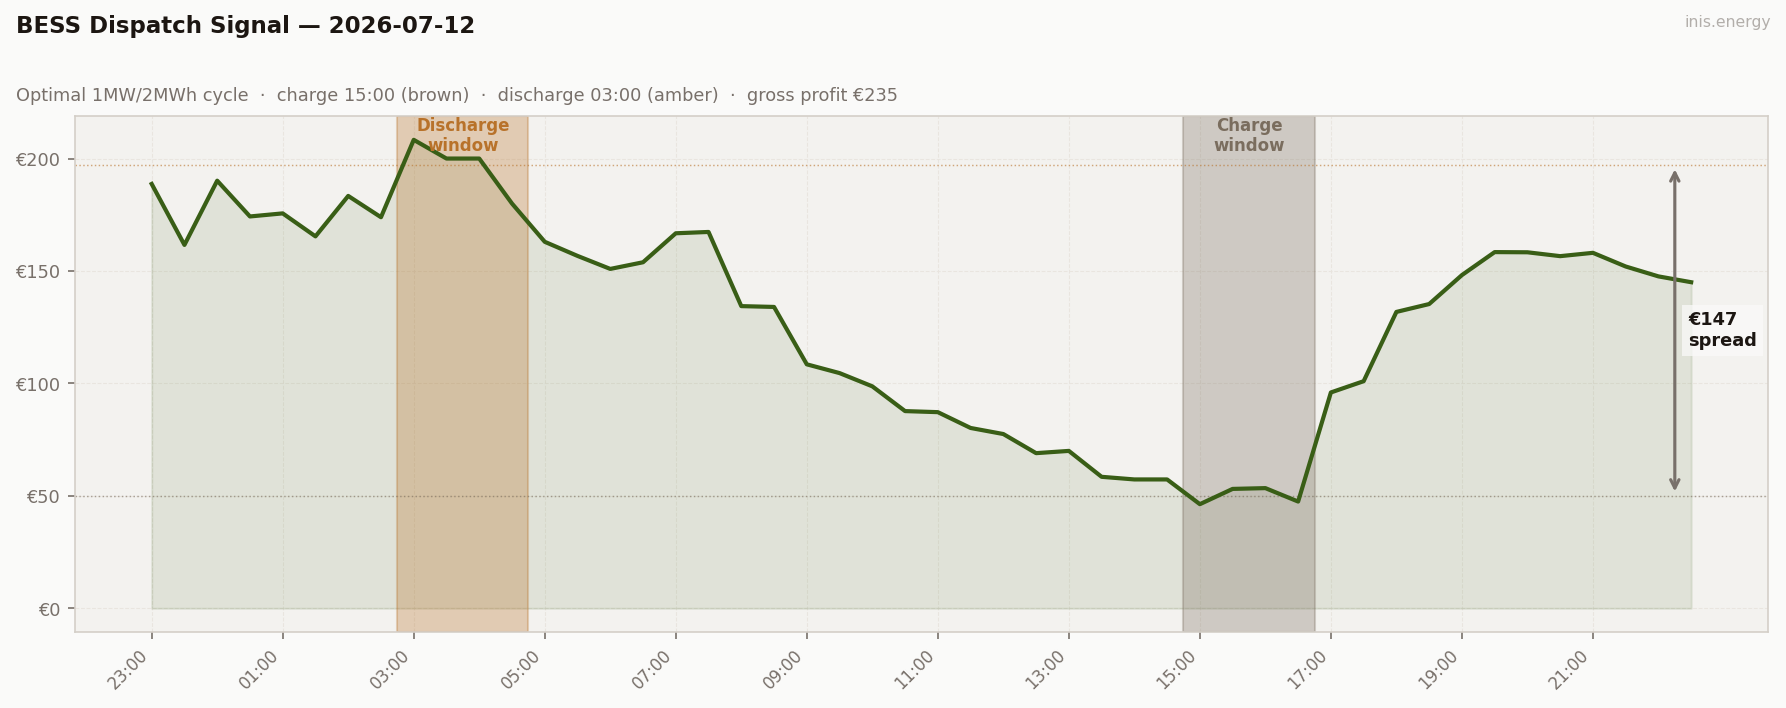
Updated 2026-08-27: the BESS simulation previously allowed the discharge window to occur before the charge window ended, which is physically impossible for a battery. This day’s figure was recalculated enforcing charge-before-discharge; gross profit corrected from €235 to €168.
Still the week’s best trade by a wide margin: charged at €50 (15:00), discharged into the evening peak (€158, 19:30) — the €208 overnight spike was higher, but it fell before the afternoon charge, so a same-day cycle couldn’t reach it. Gross profit €168, ROI 167.9% — still comfortably the week’s best return, proof that the widest reachable spread of the week showed up on the day with the most wind, not the least.
Commentary #
Sunday closes the loop. The week ran from Monday’s calm 29% wind through a four-day drought bottoming at 4.5% on Thursday, then back up to Sunday’s 30.9% — the highest of the seven days. Price traced the same arc in reverse: €195 peak Monday, up to €276 Thursday, back down to a €131 mean Sunday.
But Sunday isn’t just “more wind, lower price” — it’s the most chaotic day of the week, with the widest range and an overnight price spike that outranks anything the daytime saw. Low weekend demand exaggerates every move: the midday trough goes deeper, and the best battery trade of the week, a 234% ROI, comes from exactly that extra volatility.
A full week, a full cycle: drought to glut, scarcity to negative spreads. Monday brings weekday demand back — the real test of whether this wind recovery holds under load.
Half-hourly data — 2026-07-12
| Period | Time | Price (€/MWh) | Wind % |
|---|---|---|---|
| 1 | 23:00 | 188.71 | 50.9% |
| 2 | 23:30 | 161.60 | 47.5% |
| 3 | 00:00 | 190.16 | 30.5% |
| 4 | 00:30 | 174.25 | 30.4% |
| 5 | 01:00 | 175.62 | 29.3% |
| 6 | 01:30 | 165.40 | 27.5% |
| 7 | 02:00 | 183.38 | 26.7% |
| 8 | 02:30 | 173.91 | 26.7% |
| 9 | 03:00 | 208.32 | 27.1% |
| 10 | 03:30 | 200.00 | 27.2% |
| 11 | 04:00 | 200.00 | 28.0% |
| 12 | 04:30 | 180.00 | 29.1% |
| 13 | 05:00 | 162.98 | 30.4% |
| 14 | 05:30 | 156.71 | 30.4% |
| 15 | 06:00 | 150.92 | 32.0% |
| 16 | 06:30 | 153.88 | 30.6% |
| 17 | 07:00 | 166.77 | 28.2% |
| 18 | 07:30 | 167.36 | 24.9% |
| 19 | 08:00 | 134.38 | 23.6% |
| 20 | 08:30 | 134.02 | 24.9% |
| 21 | 09:00 | 108.50 | 24.5% |
| 22 | 09:30 | 104.60 | 22.3% |
| 23 | 10:00 | 98.71 | 20.7% |
| 24 | 10:30 | 87.70 | 19.8% |
| 25 | 11:00 | 87.23 | 20.3% |
| 26 | 11:30 | 80.20 | 21.9% |
| 27 | 12:00 | 77.50 | 24.6% |
| 28 | 12:30 | 69.00 | 25.6% |
| 29 | 13:00 | 70.00 | 27.0% |
| 30 | 13:30 | 58.48 | 27.5% |
| 31 | 14:00 | 57.31 | 28.0% |
| 32 | 14:30 | 57.31 | 29.7% |
| 33 | 15:00 | 46.31 | 27.8% |
| 34 | 15:30 | 53.10 | 27.8% |
| 35 | 16:00 | 53.45 | 23.6% |
| 36 | 16:30 | 47.48 | 25.4% |
| 37 | 17:00 | 95.99 | 30.2% |
| 38 | 17:30 | 101.00 | 33.6% |
| 39 | 18:00 | 131.80 | 40.1% |
| 40 | 18:30 | 135.30 | 40.9% |
| 41 | 19:00 | 148.18 | 40.4% |
| 42 | 19:30 | 158.40 | 40.5% |
| 43 | 20:00 | 158.32 | 39.2% |
| 44 | 20:30 | 156.60 | 36.7% |
| 45 | 21:00 | 158.08 | 39.1% |
| 46 | 21:30 | 152.00 | 43.2% |
| 47 | 22:00 | 147.60 | 47.9% |
| 48 | 22:30 | 145.01 | 49.5% |
Compare your business electricity and gas rates in minutes with INIS Energy Brokers.
Compare rates