I-SEM Daily Briefing — 26 July 2026
Table of Contents
Market Snapshot
| Metric | Value |
|---|---|
| Mean DAM Price | €100.23/MWh |
| Median Price | €111.09/MWh |
| Std Dev | €61.36/MWh |
| Peak Price | €186.0/MWh (21:30) |
| Min Price | €10.0/MWh (15:30) |
| Price Range | €176.0/MWh |
| Periods above €150 | 13 of 48 (27%) |
| Periods above €200 | 0 of 48 (0%) |
| Peak Avg (07–22) | €76.48/MWh |
| Off-peak Avg (22–07) | €139.82/MWh |
| Peak/Off-Peak Spread | €-63.34/MWh |
| Wind % of Demand | 52.8% |
| Wind Range | 30.5%–69.1% |
| Mean Demand | 3404 MW |
Price Profile #
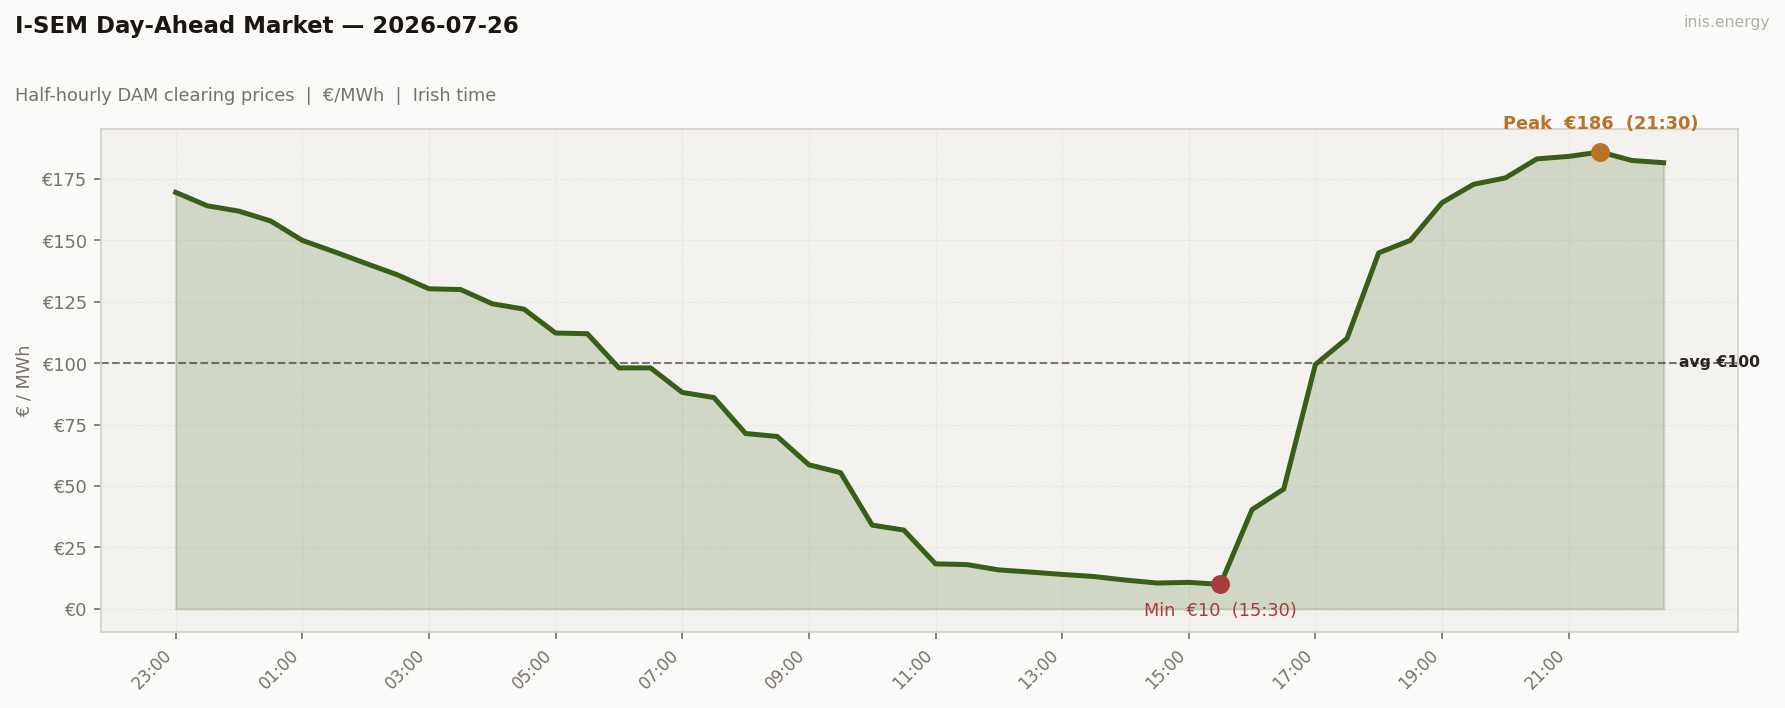
Std dev €61.36/MWh · Median €111.09/MWh · Periods above €150: 13 of 48 (27%)
Price vs Wind #
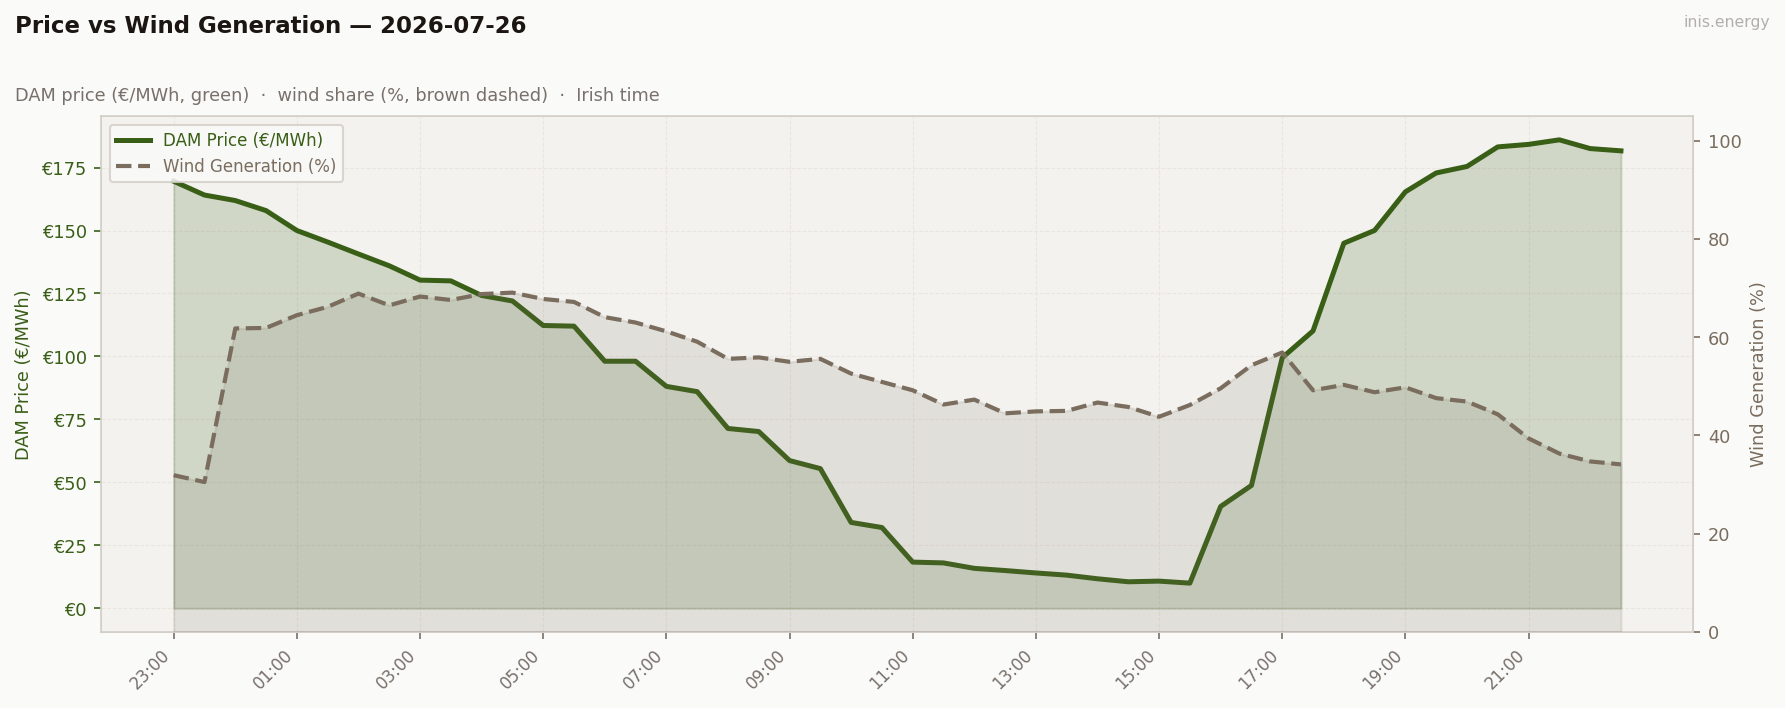
Mean wind: 52.8% · Range: 30.5%–69.1%
Week in Context #
Price Duration Curve #
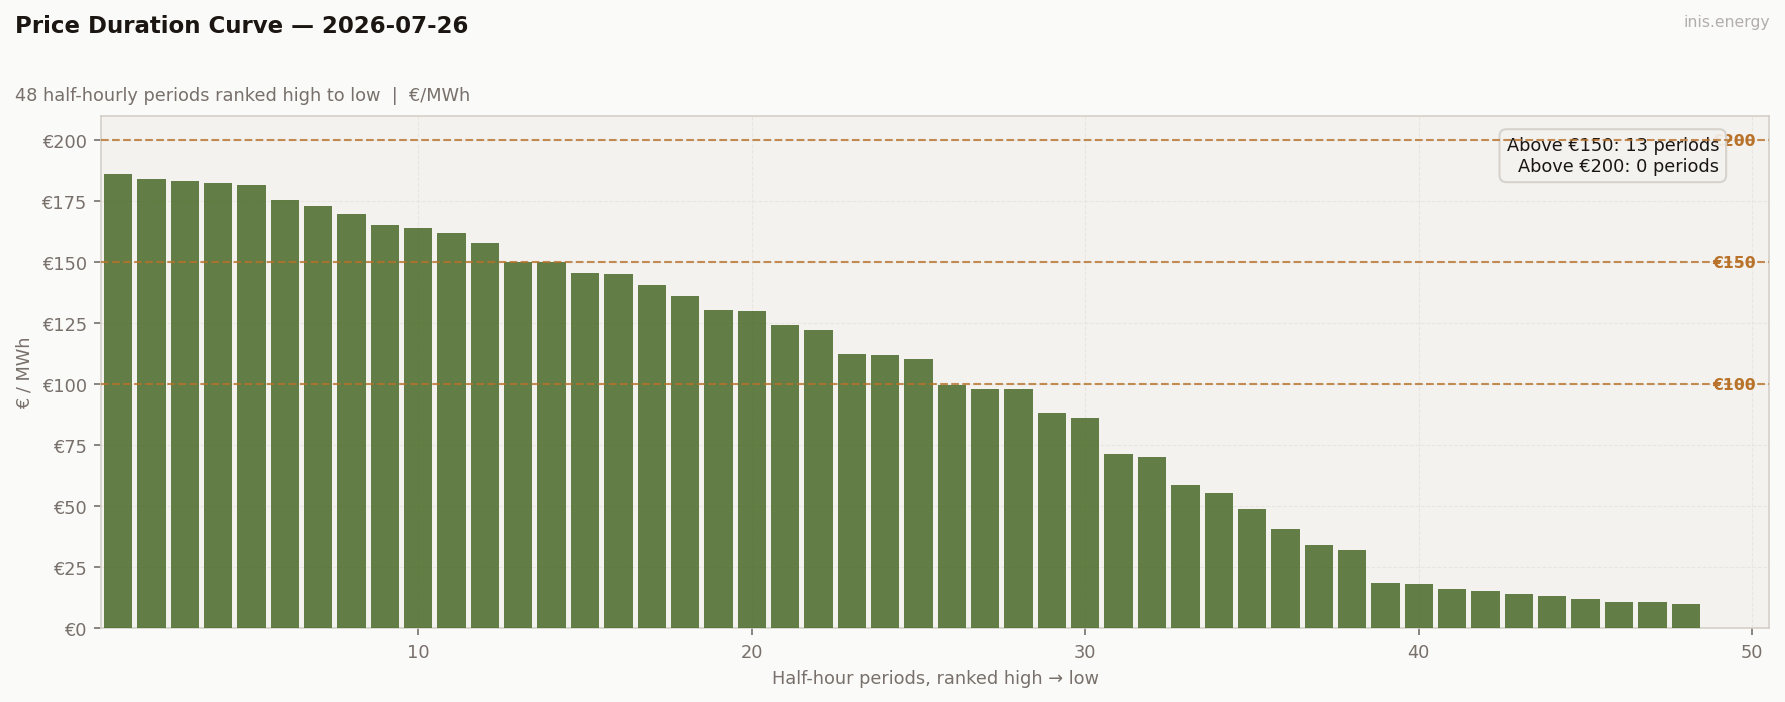
Periods above €150: 13 (27% of day) · Above €200: 0 (0% of day)
Peak / Off-Peak Spread #
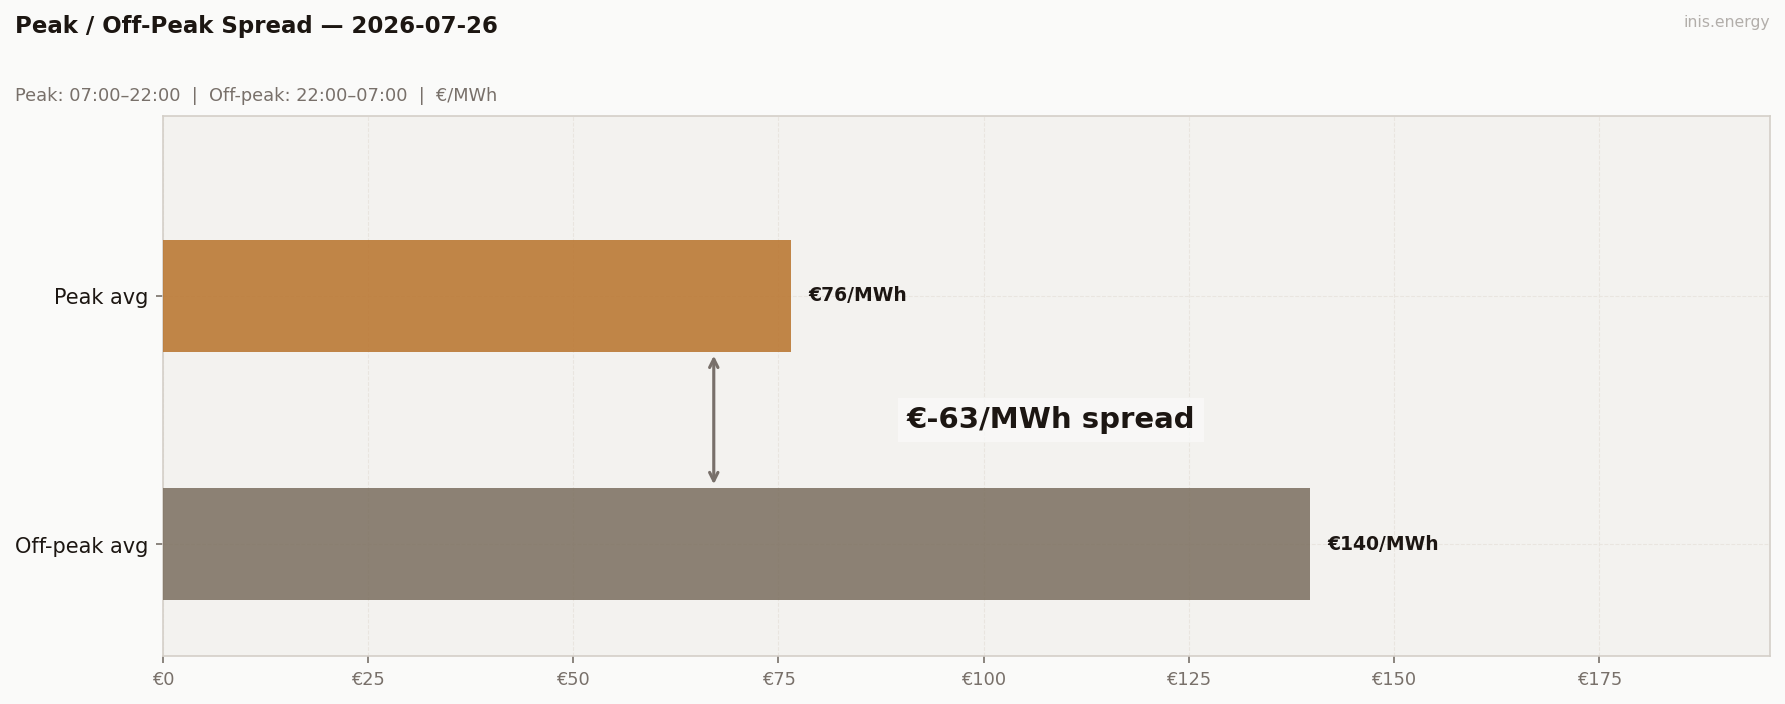
Peak avg (07:00–22:00): €76.48/MWh · Off-peak avg: €139.82/MWh · Spread: €-63.34/MWh
BESS Dispatch Signal #
| Price | Time | Energy | Value | |
|---|---|---|---|---|
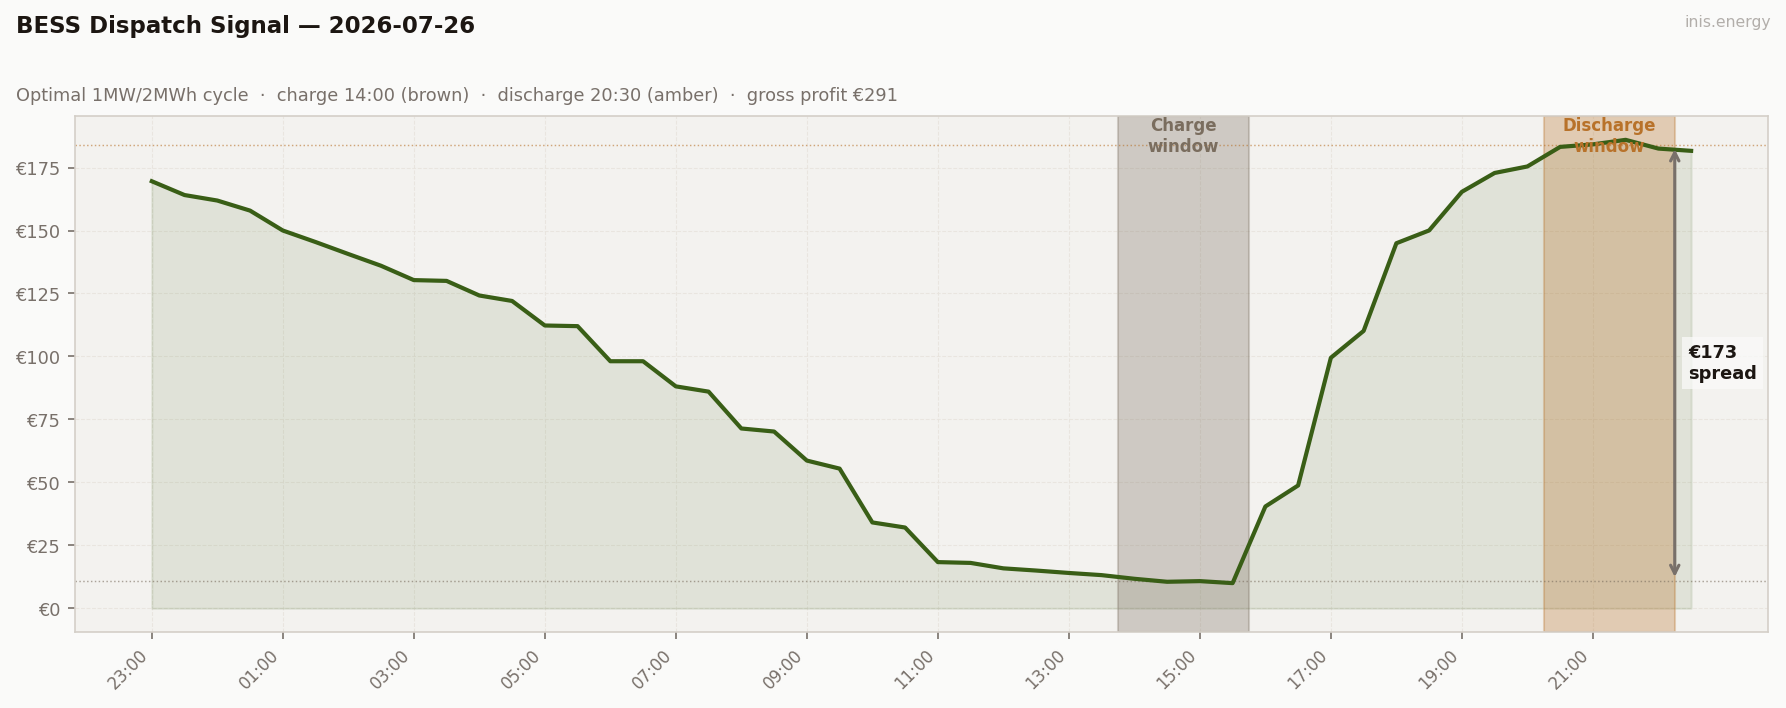
| Charge | €11/MWh | 14:00 | 2 MWh | −€22 |
| Discharge | €184/MWh | 20:30 | 1.7 MWh (85% RTE) | +€313 |
| Gross profit | €291 | |||
| Price spread | €173/MWh | ROI: 1352.0% |
Simulated 1MW/2MWh battery, one optimal DAM cycle. Gross before network charges and capacity costs.
Commentary #
The windiest day of the week by far — 52.8% average, up to 69.1% — and the price curve tells you everything about what high wind does to this market. From 11:00 to 15:30, wind sat above 43% and price cratered to single digits, bottoming at €10.0/MWh at 15:30. That’s five straight hours under €20. The system was, for long stretches of the early afternoon, essentially giving power away.
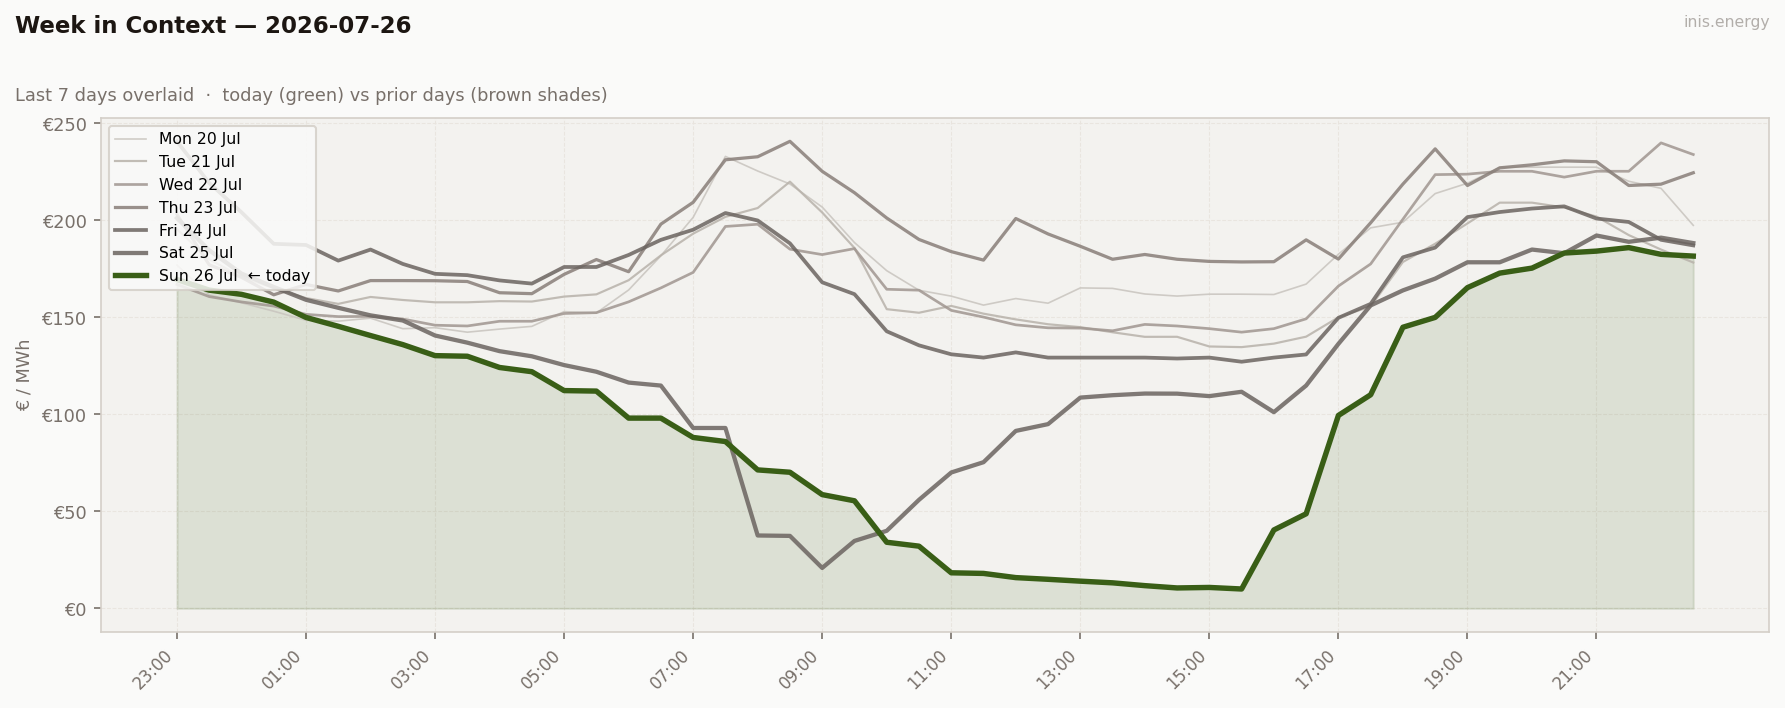
Peak/off-peak spread hit -€63.34, the most inverted reading of the week, because the traditional “peak” window absorbed almost all of the cheap wind. The only real premium in the day came at the very end, 19:00–21:30, as wind eased from the mid-50s toward 36% and price rebuilt to a €186.0 close — still nowhere near the €200+ ceilings low-wind days produce. Even the day’s peak came in below Thursday’s trough.
This was storage’s best day of the month: €291 gross, a 1352% ROI, off an €11/MWh charge and a €184/MWh discharge. A spread that wide only exists because wind pushed price to near-zero in the middle of the day while demand still needed covering in the evening. Two low-wind days, two poor battery days; two high-wind days, two exceptional ones. The pattern this week could not be cleaner.
Half-hourly data — 2026-07-26
| Period | Time | Price (€/MWh) | Wind % |
|---|---|---|---|
| 1 | 23:00 | 169.56 | 31.9% |
| 2 | 23:30 | 164.08 | 30.5% |
| 3 | 00:00 | 161.90 | 61.8% |
| 4 | 00:30 | 157.90 | 61.9% |
| 5 | 01:00 | 150.00 | 64.5% |
| 6 | 01:30 | 145.43 | 66.2% |
| 7 | 02:00 | 140.67 | 68.9% |
| 8 | 02:30 | 136.00 | 66.5% |
| 9 | 03:00 | 130.31 | 68.3% |
| 10 | 03:30 | 130.00 | 67.6% |
| 11 | 04:00 | 124.20 | 68.8% |
| 12 | 04:30 | 122.03 | 69.1% |
| 13 | 05:00 | 112.29 | 67.8% |
| 14 | 05:30 | 112.03 | 67.2% |
| 15 | 06:00 | 98.10 | 64.1% |
| 16 | 06:30 | 98.10 | 63.0% |
| 17 | 07:00 | 88.12 | 61.2% |
| 18 | 07:30 | 86.03 | 59.1% |
| 19 | 08:00 | 71.40 | 55.6% |
| 20 | 08:30 | 70.19 | 55.9% |
| 21 | 09:00 | 58.66 | 55.0% |
| 22 | 09:30 | 55.47 | 55.6% |
| 23 | 10:00 | 34.10 | 52.6% |
| 24 | 10:30 | 32.08 | 50.9% |
| 25 | 11:00 | 18.35 | 49.2% |
| 26 | 11:30 | 18.03 | 46.3% |
| 27 | 12:00 | 15.87 | 47.3% |
| 28 | 12:30 | 15.00 | 44.5% |
| 29 | 13:00 | 14.04 | 44.9% |
| 30 | 13:30 | 13.18 | 45.0% |
| 31 | 14:00 | 11.73 | 46.7% |
| 32 | 14:30 | 10.54 | 45.8% |
| 33 | 15:00 | 10.80 | 43.8% |
| 34 | 15:30 | 10.00 | 46.2% |
| 35 | 16:00 | 40.43 | 49.6% |
| 36 | 16:30 | 48.78 | 54.3% |
| 37 | 17:00 | 99.48 | 56.9% |
| 38 | 17:30 | 110.14 | 49.2% |
| 39 | 18:00 | 144.95 | 50.3% |
| 40 | 18:30 | 150.03 | 48.8% |
| 41 | 19:00 | 165.36 | 49.8% |
| 42 | 19:30 | 172.85 | 47.6% |
| 43 | 20:00 | 175.43 | 46.9% |
| 44 | 20:30 | 183.20 | 44.3% |
| 45 | 21:00 | 184.20 | 39.4% |
| 46 | 21:30 | 186.00 | 36.3% |
| 47 | 22:00 | 182.53 | 34.7% |
| 48 | 22:30 | 181.63 | 34.1% |
Compare your business electricity and gas rates in minutes with INIS Energy Brokers.
Compare rates