I-SEM Daily Briefing — 1 August 2026
Table of Contents
Market Snapshot
| Metric | Value |
|---|---|
| Mean DAM Price | €161.72/MWh |
| Median Price | €157.82/MWh |
| Std Dev | €37.65/MWh |
| Peak Price | €247.6/MWh (22:00) |
| Min Price | €120.71/MWh (15:00) |
| Price Range | €126.89/MWh |
| Periods above €150 | 29 of 48 (60%) |
| Periods above €200 | 9 of 48 (19%) |
| Peak Avg (07–22) | €152.75/MWh |
| Off-peak Avg (22–07) | €176.68/MWh |
| Peak/Off-Peak Spread | €-23.93/MWh |
| Wind % of Demand | 9.7% |
| Wind Range | 2.1%–17.8% |
| Mean Demand | 3481 MW |
Price Profile #
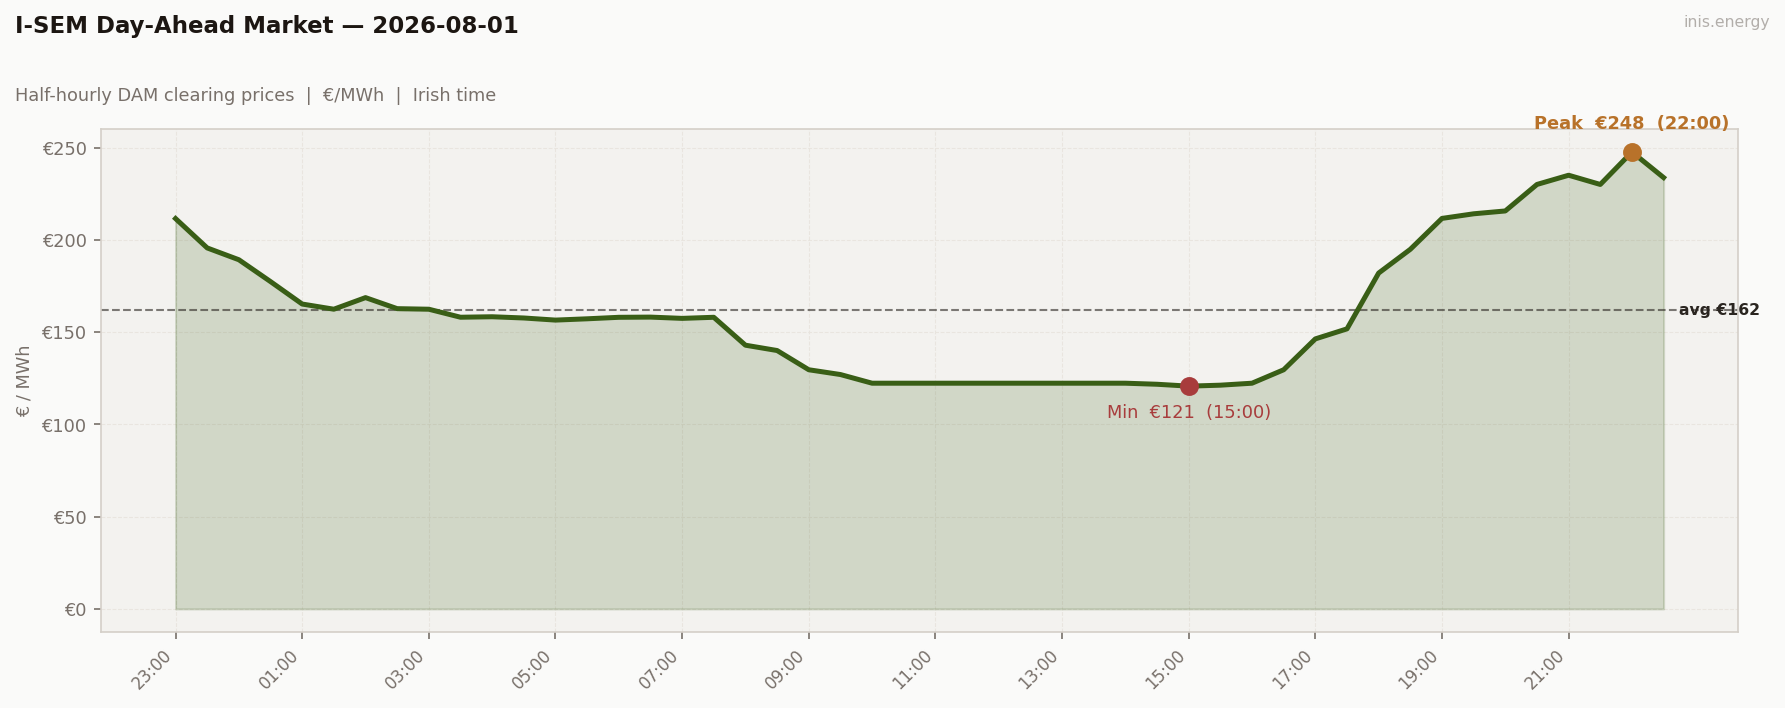
Std dev €37.65/MWh · Median €157.82/MWh · Periods above €150: 29 of 48 (60%)
Price vs Wind #
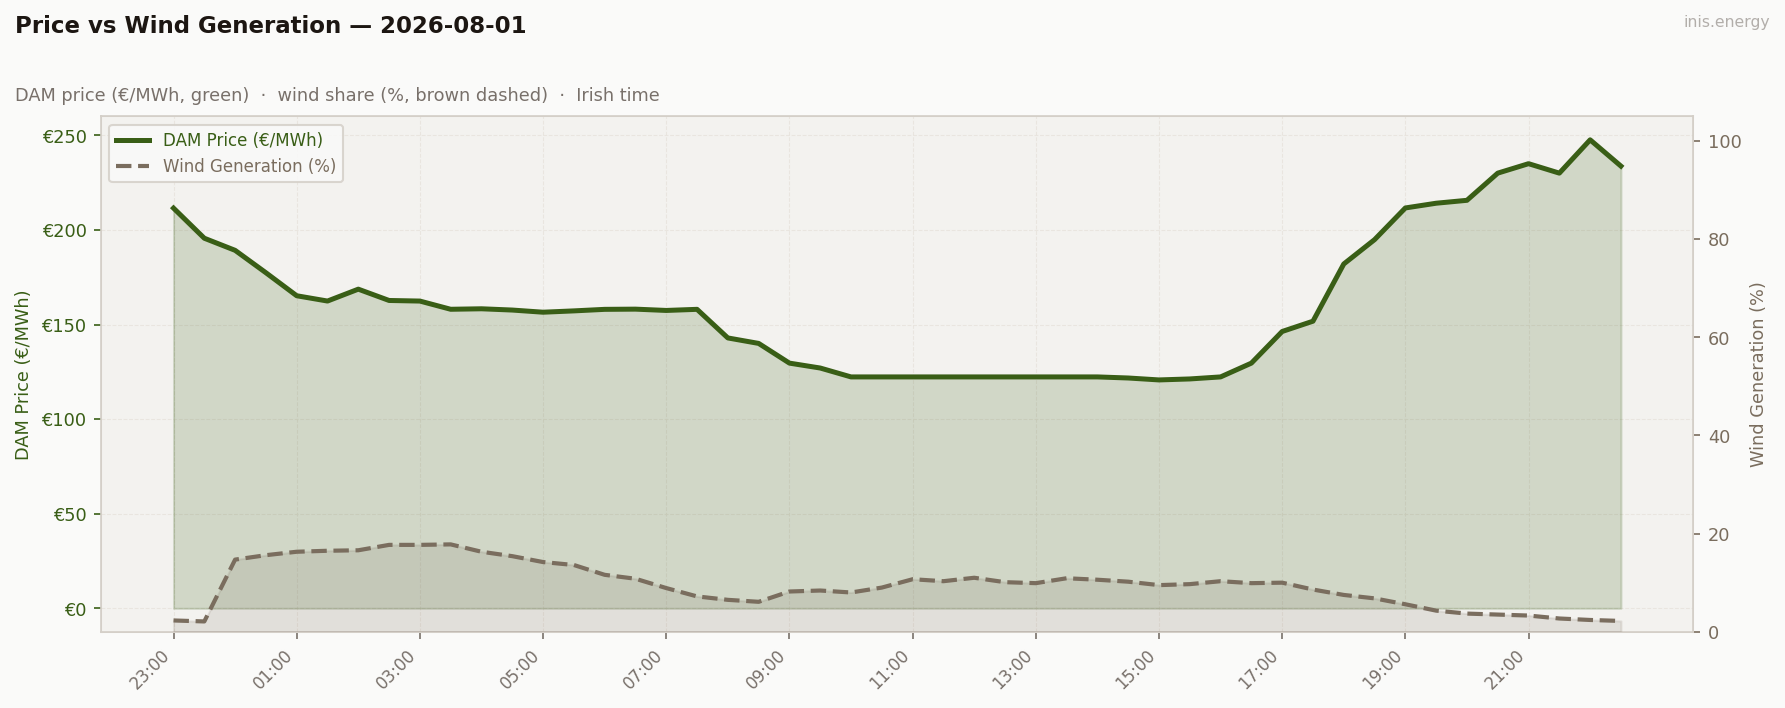
Mean wind: 9.7% · Range: 2.1%–17.8%
Week in Context #
Price Duration Curve #
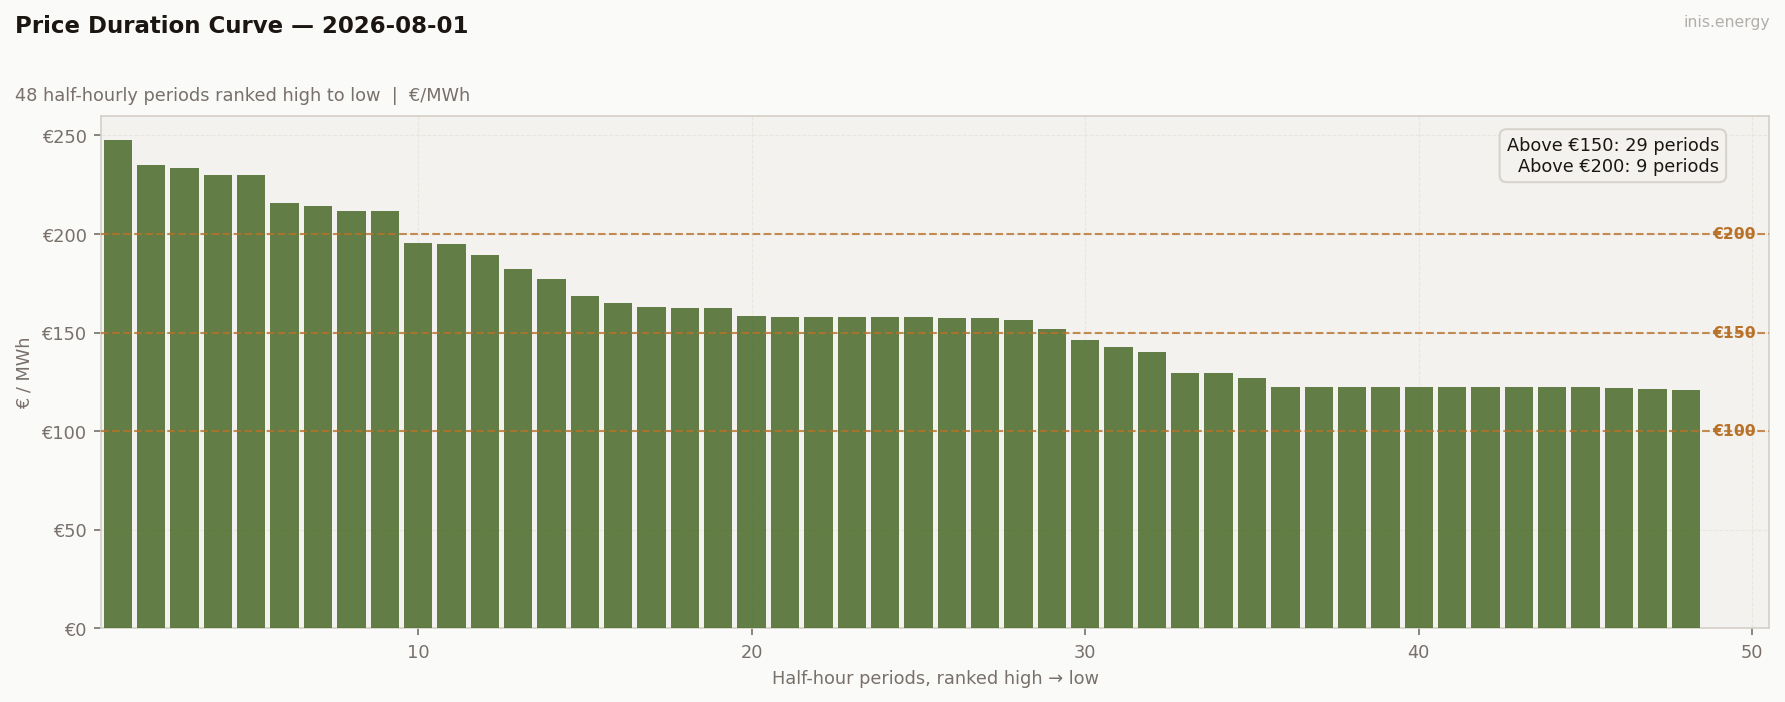
Periods above €150: 29 (60% of day) · Above €200: 9 (19% of day)
Peak / Off-Peak Spread #
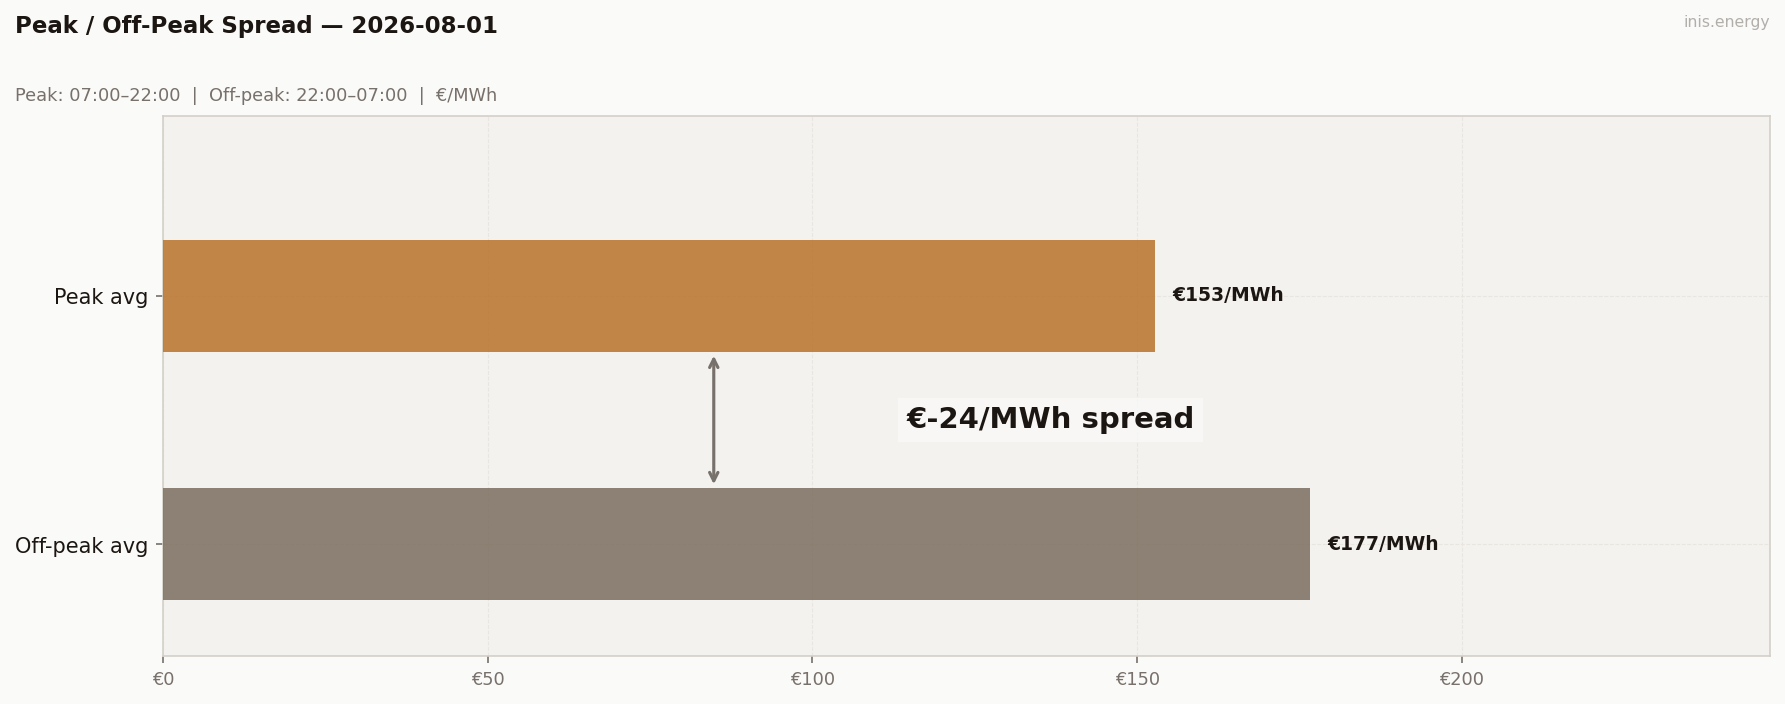
Peak avg (07:00–22:00): €152.75/MWh · Off-peak avg: €176.68/MWh · Spread: €-23.93/MWh
BESS Dispatch Signal #
| Price | Time | Energy | Value | |
|---|---|---|---|---|
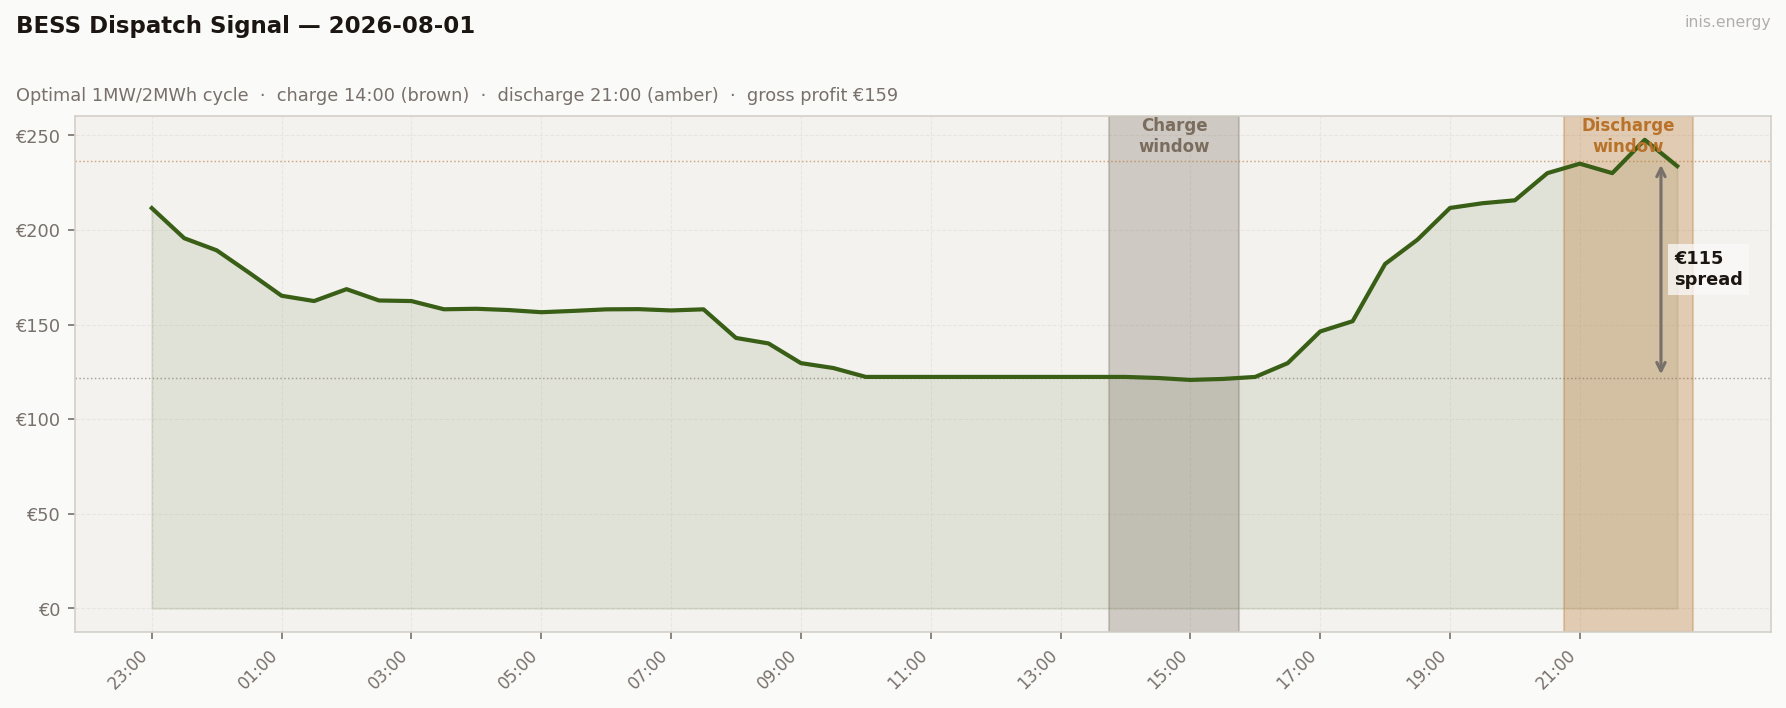
| Charge | €121/MWh | 14:00 | 2 MWh | −€243 |
| Discharge | €237/MWh | 21:00 | 1.7 MWh (85% RTE) | +€402 |
| Gross profit | €159 | |||
| Price spread | €115/MWh | ROI: 65.5% |
Simulated 1MW/2MWh battery, one optimal DAM cycle. Gross before network charges and capacity costs.
Commentary #
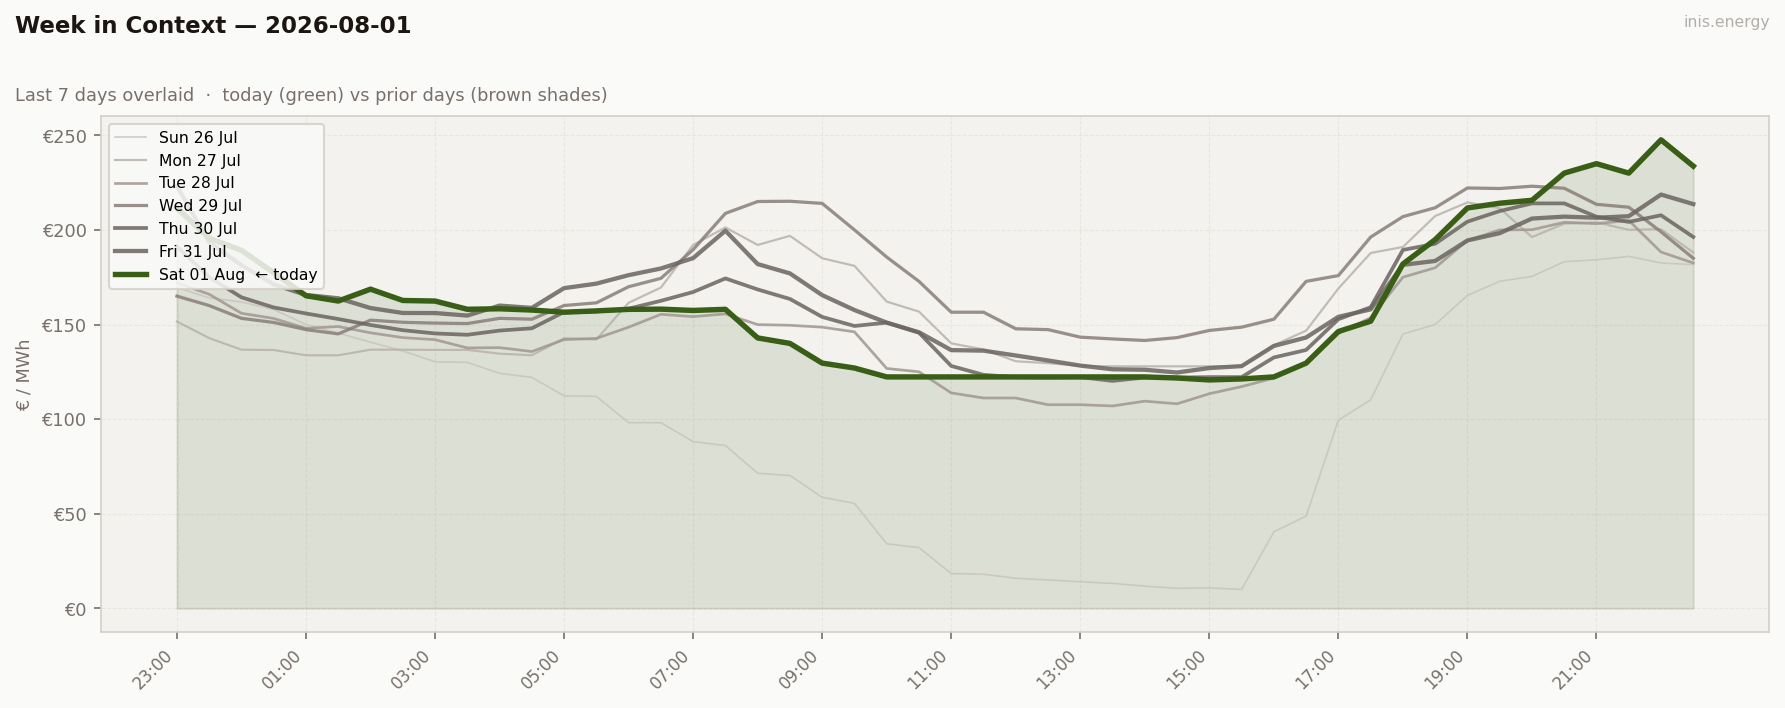
The lowest-wind day of the week, 9.7% on average and never above 17.8%, but it didn’t play out as a flat, high day like the 29th — Saturday demand was too soft for that. Wind eased price down from €211 at 23:00 to the €156–158 range by 05:00–07:00, then held there as wind fell back toward 8–10%. With weekend demand light enough to absorb it, price didn’t spike — it flatlined instead, pinned at exactly €122.30 for six straight periods from 11:00 to 14:00. Only once wind collapsed further into the evening, down to 2.2% by 22:30, and demand picked back up did the market break: €146 by 17:00, €215 by 20:00, a session-high €247.60 at 22:00.
That’s the widest range of the week so far, €126.89, and the highest std dev, €37.65 — a day that looked calm at midday and violent by night. Peak/off-peak spread pushed further negative again, €-23.93, continuing the pattern from Friday: whenever the trough falls inside the 07:00–22:00 window and the real spike lands either side of it, the “peak” average ends up looking cheaper than off-peak.
Storage had its best day since the 26th’s outlier: charging at €121 into the midday flat spot and discharging at €237 for the evening spike cleared €159 gross at 65.5% ROI. Low wind alone didn’t do it — it was low wind plus a demand-driven evening ramp with nothing to blunt it. Worth watching whether wind returns before the next weekend rolls around.
Half-hourly data — 2026-08-01
| Period | Time | Price (€/MWh) | Wind % |
|---|---|---|---|
| 1 | 23:00 | 211.51 | 2.3% |
| 2 | 23:30 | 195.60 | 2.1% |
| 3 | 00:00 | 189.20 | 14.7% |
| 4 | 00:30 | 177.36 | 15.6% |
| 5 | 01:00 | 165.20 | 16.3% |
| 6 | 01:30 | 162.40 | 16.5% |
| 7 | 02:00 | 168.68 | 16.6% |
| 8 | 02:30 | 162.70 | 17.7% |
| 9 | 03:00 | 162.39 | 17.7% |
| 10 | 03:30 | 158.05 | 17.8% |
| 11 | 04:00 | 158.31 | 16.3% |
| 12 | 04:30 | 157.64 | 15.4% |
| 13 | 05:00 | 156.50 | 14.2% |
| 14 | 05:30 | 157.20 | 13.6% |
| 15 | 06:00 | 158.01 | 11.6% |
| 16 | 06:30 | 158.12 | 10.8% |
| 17 | 07:00 | 157.43 | 8.9% |
| 18 | 07:30 | 158.02 | 7.2% |
| 19 | 08:00 | 142.90 | 6.5% |
| 20 | 08:30 | 140.01 | 6.1% |
| 21 | 09:00 | 129.59 | 8.2% |
| 22 | 09:30 | 127.00 | 8.4% |
| 23 | 10:00 | 122.30 | 8.0% |
| 24 | 10:30 | 122.30 | 9.0% |
| 25 | 11:00 | 122.30 | 10.7% |
| 26 | 11:30 | 122.30 | 10.3% |
| 27 | 12:00 | 122.30 | 11.0% |
| 28 | 12:30 | 122.30 | 10.1% |
| 29 | 13:00 | 122.30 | 9.9% |
| 30 | 13:30 | 122.30 | 10.9% |
| 31 | 14:00 | 122.30 | 10.6% |
| 32 | 14:30 | 121.73 | 10.2% |
| 33 | 15:00 | 120.71 | 9.5% |
| 34 | 15:30 | 121.23 | 9.7% |
| 35 | 16:00 | 122.30 | 10.3% |
| 36 | 16:30 | 129.59 | 9.9% |
| 37 | 17:00 | 146.31 | 10.0% |
| 38 | 17:30 | 151.75 | 8.6% |
| 39 | 18:00 | 181.99 | 7.5% |
| 40 | 18:30 | 194.86 | 6.8% |
| 41 | 19:00 | 211.60 | 5.6% |
| 42 | 19:30 | 214.10 | 4.3% |
| 43 | 20:00 | 215.64 | 3.7% |
| 44 | 20:30 | 230.00 | 3.5% |
| 45 | 21:00 | 235.00 | 3.3% |
| 46 | 21:30 | 230.00 | 2.7% |
| 47 | 22:00 | 247.60 | 2.4% |
| 48 | 22:30 | 233.72 | 2.2% |
Compare your business electricity and gas rates in minutes with INIS Energy Brokers.
Compare rates