I-SEM Daily Briefing — 15 August 2026
Table of Contents
Market Snapshot
| Metric | Value |
|---|---|
| Mean DAM Price | €172.72/MWh |
| Median Price | €160.94/MWh |
| Std Dev | €27.44/MWh |
| Peak Price | €225.18/MWh (21:00) |
| Min Price | €137.6/MWh (15:00) |
| Price Range | €87.58/MWh |
| Periods above €150 | 41 of 48 (85%) |
| Periods above €200 | 10 of 48 (21%) |
| Peak Avg (07–22) | €173.09/MWh |
| Off-peak Avg (22–07) | €172.1/MWh |
| Peak/Off-Peak Spread | €0.99/MWh |
| Wind % of Demand | 4.1% |
| Wind Range | 1.2%–9.1% |
| Mean Demand | 3634 MW |
Price Profile #
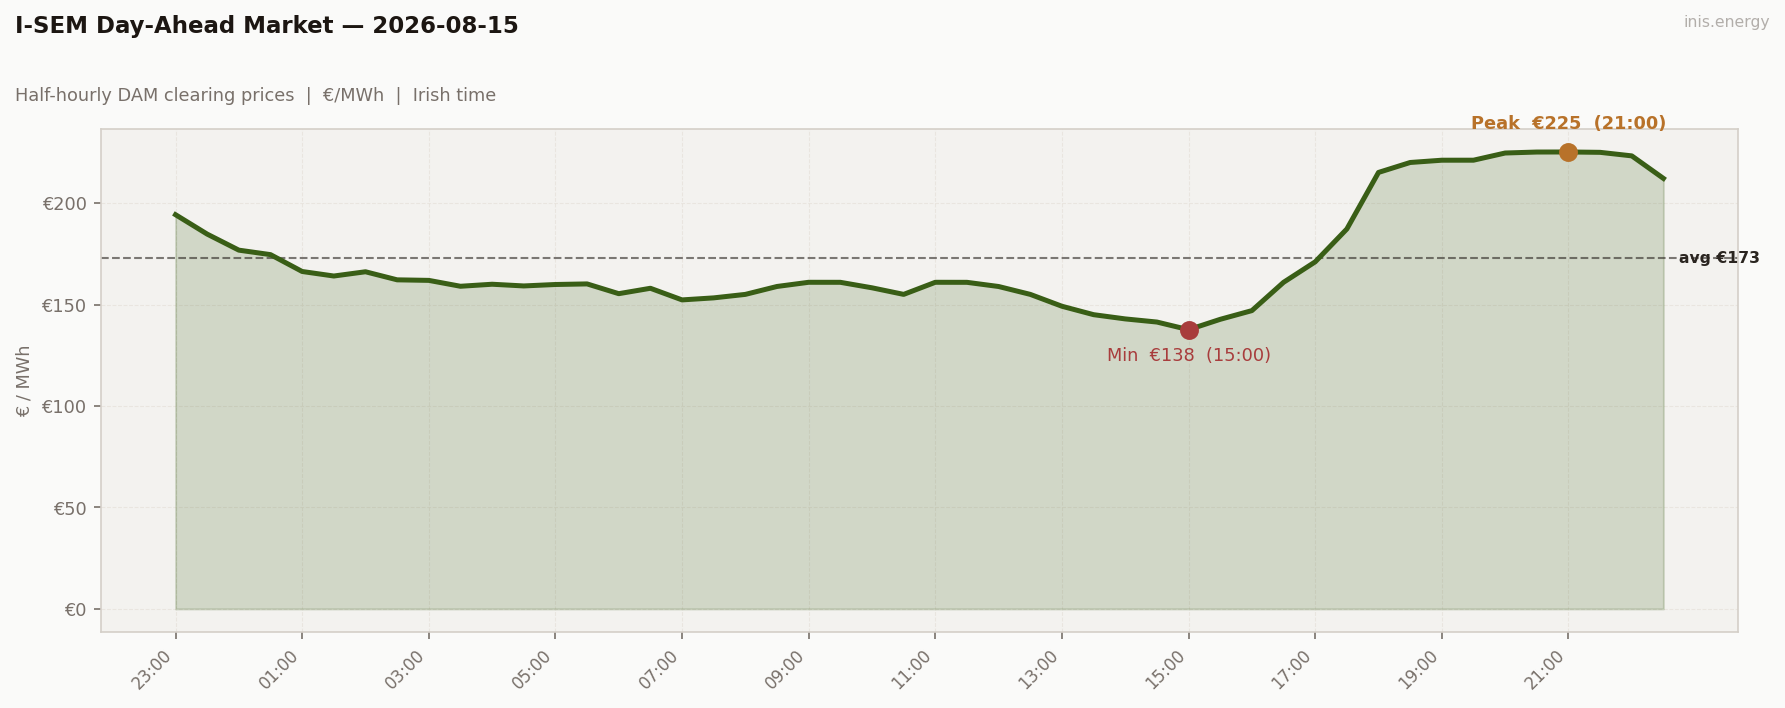
Std dev €27.44/MWh · Median €160.94/MWh · Periods above €150: 41 of 48 (85%)
Price vs Wind #
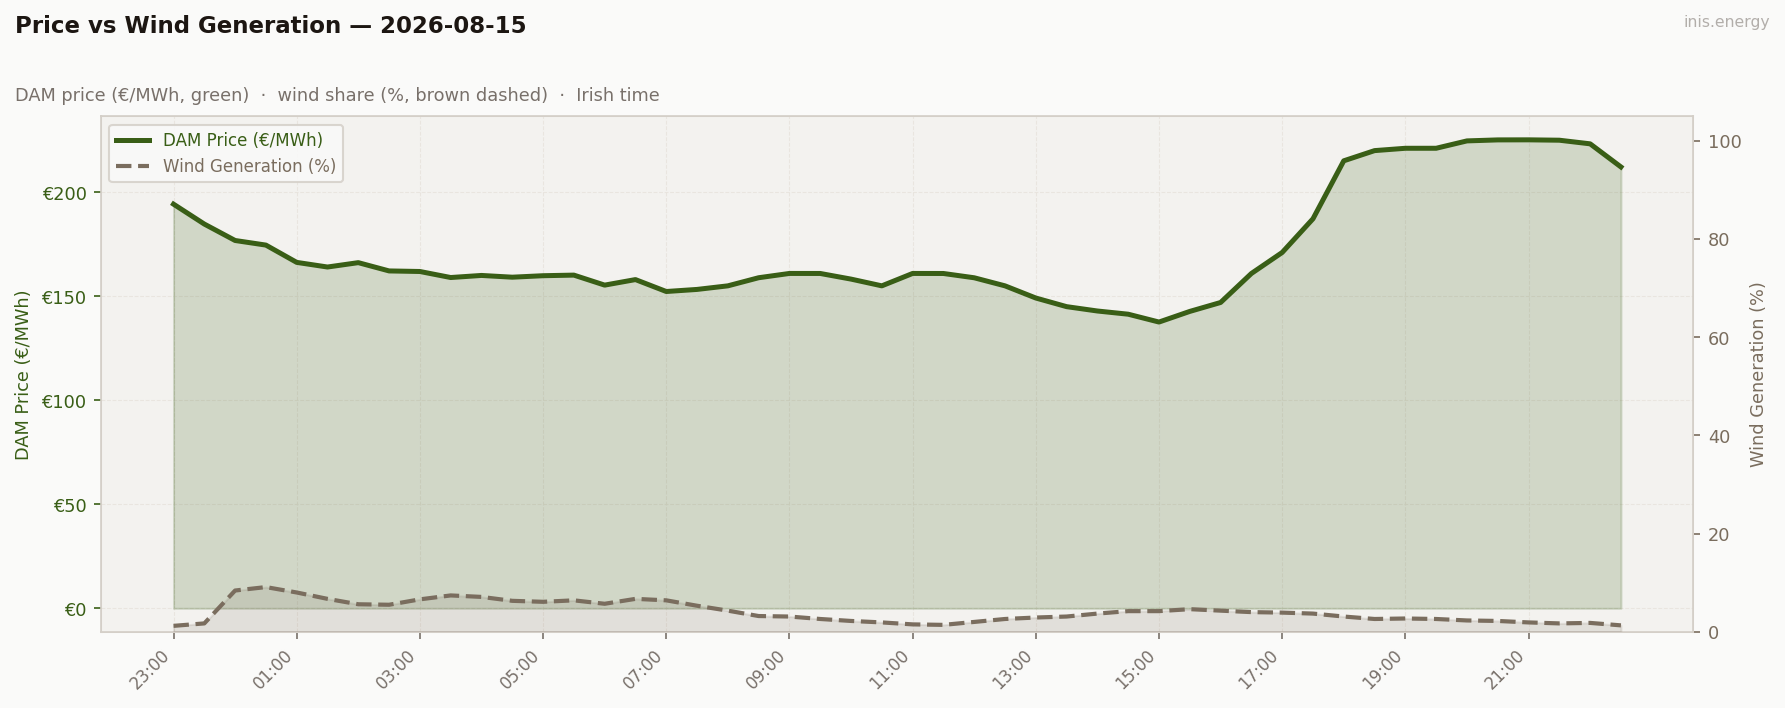
Mean wind: 4.1% · Range: 1.2%–9.1%
Week in Context #
Price Duration Curve #
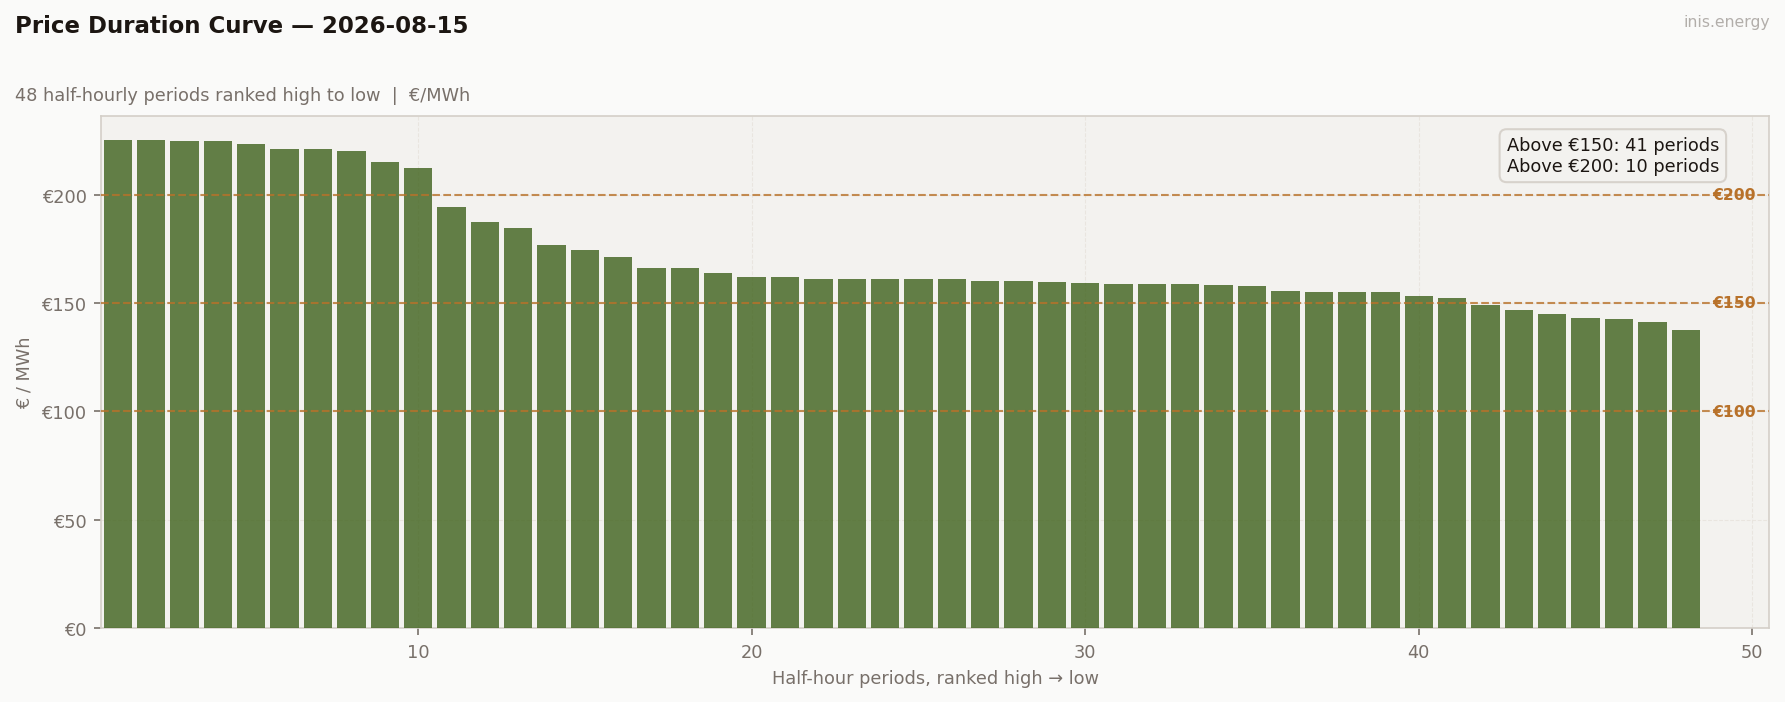
Periods above €150: 41 (85% of day) · Above €200: 10 (21% of day)
Peak / Off-Peak Spread #
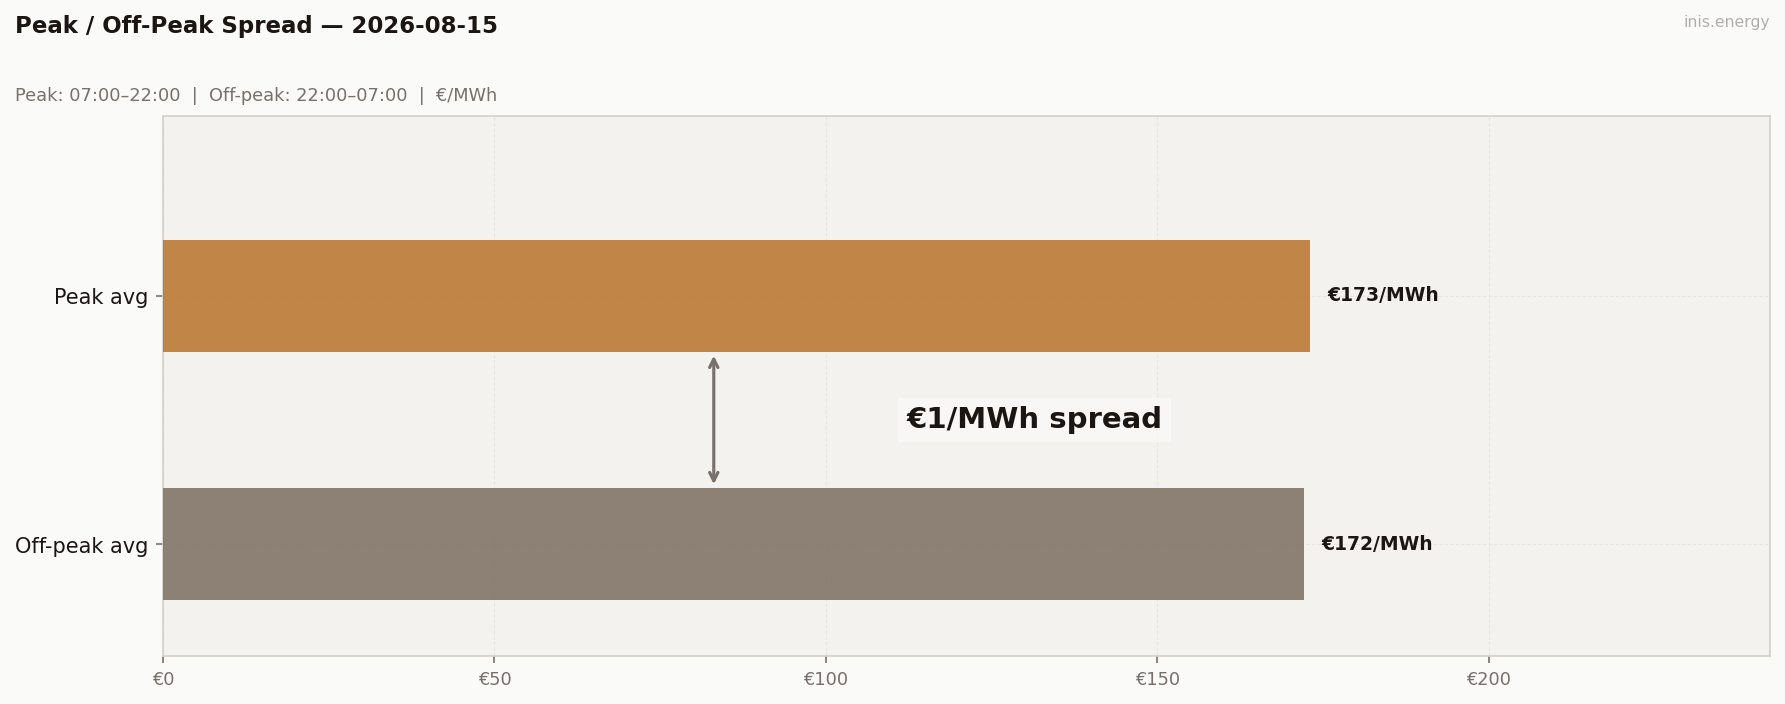
Peak avg (07:00–22:00): €173.09/MWh · Off-peak avg: €172.1/MWh · Spread: €0.99/MWh
BESS Dispatch Signal #
| Price | Time | Energy | Value | |
|---|---|---|---|---|
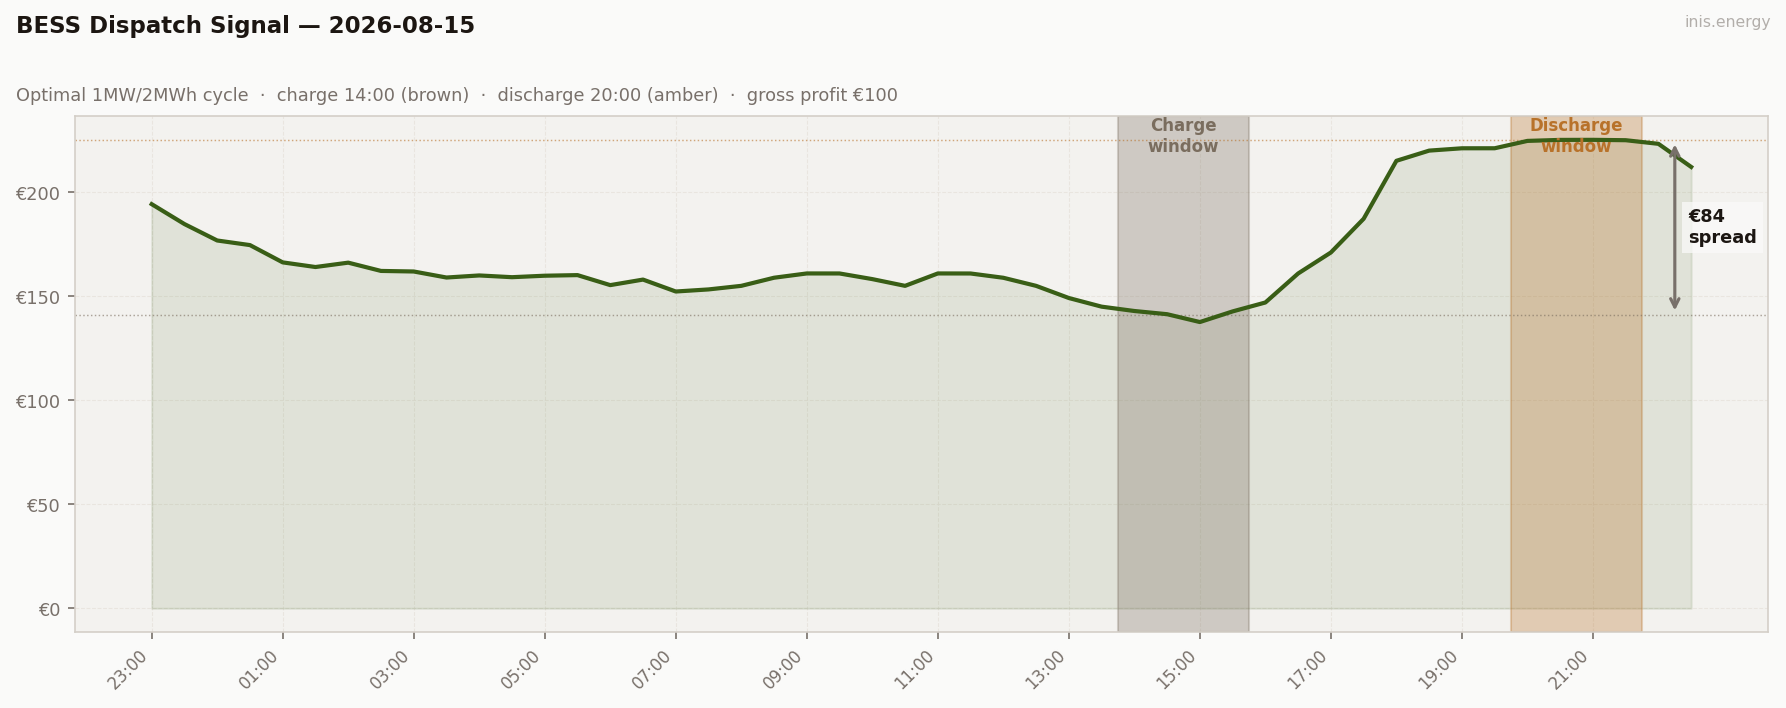
| Charge | €141/MWh | 14:00 | 2 MWh | −€282 |
| Discharge | €225/MWh | 20:00 | 1.7 MWh (85% RTE) | +€382 |
| Gross profit | €100 | |||
| Price spread | €84/MWh | ROI: 35.5% |
Simulated 1MW/2MWh battery, one optimal DAM cycle. Gross before network charges and capacity costs.
Commentary #
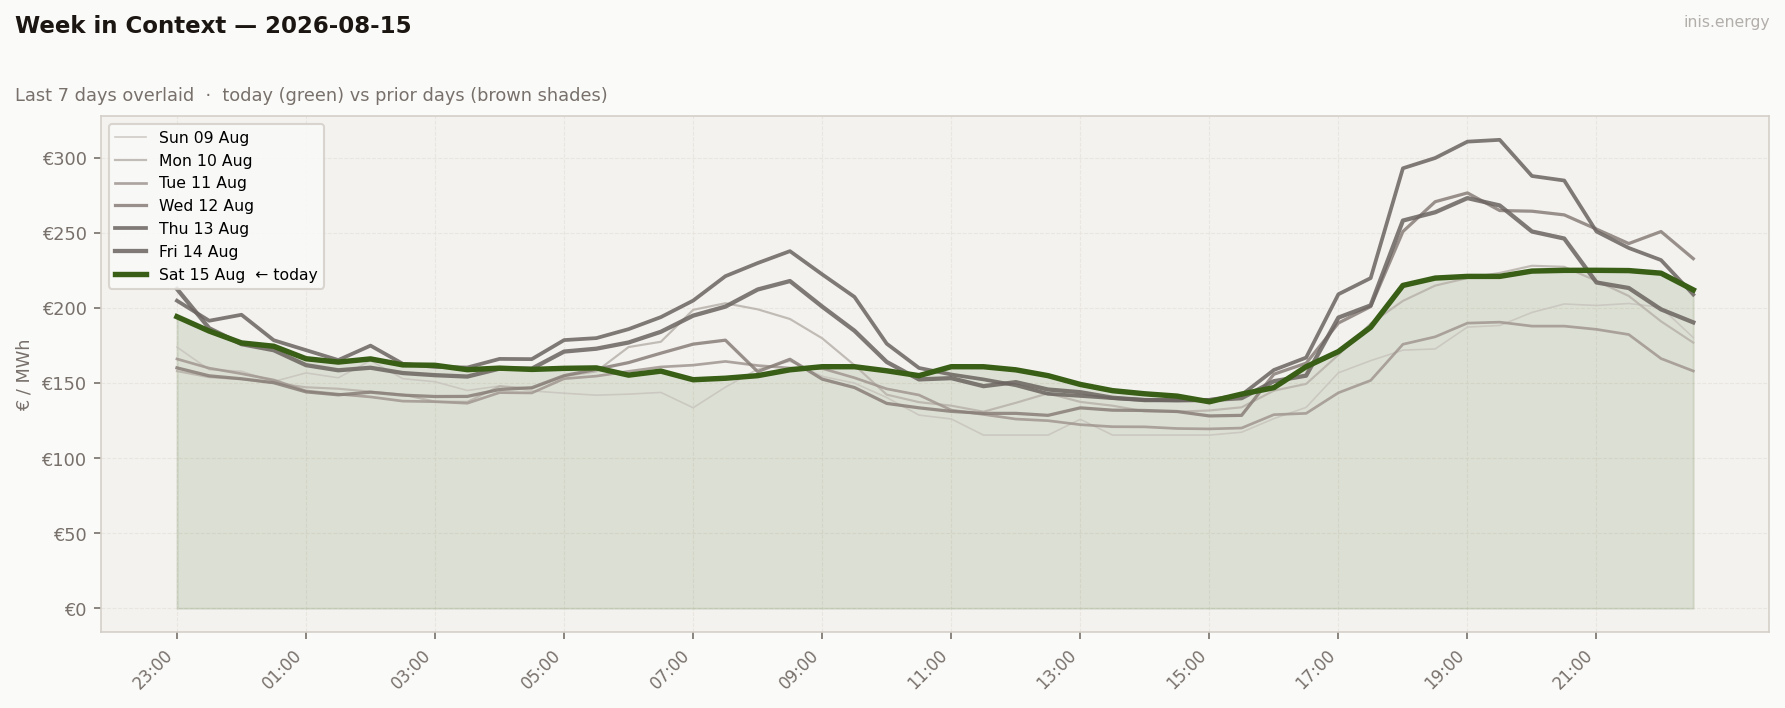
Saturday broke the pattern the week had been building. Wind fell to its lowest point yet — 4.1%, ranging just 1.2–9.1% — which on Thursday and Friday would have meant a sharp evening squeeze. Instead the day went flat: std dev dropped to €27.44, the peak eased to €225.18 at 21:00 (later than the week’s usual 19:00 ramp), and the peak/off-peak spread compressed to essentially nothing at €0.99. Eighty-five percent of periods cleared above €150 — the highest share of the week — but only 21% broke €200. The floor rose while the ceiling came down.
The explanation is Saturday, not wind. Mean demand fell to 3634 MW, the week’s lowest, and with weekend demand pulled back there was no evening surge to punch through the gas floor even with almost nothing on the system from wind. Flat and high, not scarce-and-spiky. Storage revenue comes from volatility, not from price level, and Saturday had price level with none of the volatility: €100 gross, 35.5% ROI, less than half Thursday’s despite lower wind. Give us weekday demand back.
Half-hourly data — 2026-08-15
| Period | Time | Price (€/MWh) | Wind % |
|---|---|---|---|
| 1 | 23:00 | 194.27 | 1.2% |
| 2 | 23:30 | 184.70 | 1.7% |
| 3 | 00:00 | 176.80 | 8.4% |
| 4 | 00:30 | 174.59 | 9.1% |
| 5 | 01:00 | 166.28 | 8.0% |
| 6 | 01:30 | 164.05 | 6.7% |
| 7 | 02:00 | 166.15 | 5.6% |
| 8 | 02:30 | 162.17 | 5.5% |
| 9 | 03:00 | 161.90 | 6.6% |
| 10 | 03:30 | 159.00 | 7.4% |
| 11 | 04:00 | 160.00 | 7.1% |
| 12 | 04:30 | 159.16 | 6.3% |
| 13 | 05:00 | 159.87 | 6.1% |
| 14 | 05:30 | 160.16 | 6.4% |
| 15 | 06:00 | 155.35 | 5.7% |
| 16 | 06:30 | 158.01 | 6.7% |
| 17 | 07:00 | 152.28 | 6.4% |
| 18 | 07:30 | 153.28 | 5.3% |
| 19 | 08:00 | 155.00 | 4.3% |
| 20 | 08:30 | 158.90 | 3.2% |
| 21 | 09:00 | 160.96 | 3.1% |
| 22 | 09:30 | 160.95 | 2.6% |
| 23 | 10:00 | 158.24 | 2.2% |
| 24 | 10:30 | 155.00 | 1.9% |
| 25 | 11:00 | 160.96 | 1.5% |
| 26 | 11:30 | 160.94 | 1.4% |
| 27 | 12:00 | 158.88 | 2.0% |
| 28 | 12:30 | 155.00 | 2.6% |
| 29 | 13:00 | 149.15 | 2.9% |
| 30 | 13:30 | 145.00 | 3.1% |
| 31 | 14:00 | 142.91 | 3.7% |
| 32 | 14:30 | 141.37 | 4.2% |
| 33 | 15:00 | 137.60 | 4.2% |
| 34 | 15:30 | 142.71 | 4.6% |
| 35 | 16:00 | 147.00 | 4.3% |
| 36 | 16:30 | 160.94 | 4.0% |
| 37 | 17:00 | 171.04 | 3.9% |
| 38 | 17:30 | 187.23 | 3.7% |
| 39 | 18:00 | 215.10 | 3.1% |
| 40 | 18:30 | 220.00 | 2.6% |
| 41 | 19:00 | 221.12 | 2.7% |
| 42 | 19:30 | 221.13 | 2.6% |
| 43 | 20:00 | 224.67 | 2.3% |
| 44 | 20:30 | 225.15 | 2.2% |
| 45 | 21:00 | 225.18 | 1.9% |
| 46 | 21:30 | 225.00 | 1.7% |
| 47 | 22:00 | 223.26 | 1.8% |
| 48 | 22:30 | 212.15 | 1.3% |
Compare your business electricity and gas rates in minutes with INIS Energy Brokers.
Compare rates