I-SEM Daily Briefing — 16 August 2026
Table of Contents
Market Snapshot
| Metric | Value |
|---|---|
| Mean DAM Price | €168.38/MWh |
| Median Price | €160.86/MWh |
| Std Dev | €23.52/MWh |
| Peak Price | €209.07/MWh (20:00) |
| Min Price | €137.61/MWh (14:30) |
| Price Range | €71.46/MWh |
| Periods above €150 | 37 of 48 (77%) |
| Periods above €200 | 9 of 48 (19%) |
| Peak Avg (07–22) | €165.21/MWh |
| Off-peak Avg (22–07) | €173.67/MWh |
| Peak/Off-Peak Spread | €-8.46/MWh |
| Wind % of Demand | 14.6% |
| Wind Range | 1.7%–25.0% |
| Mean Demand | 3583 MW |
Price Profile #
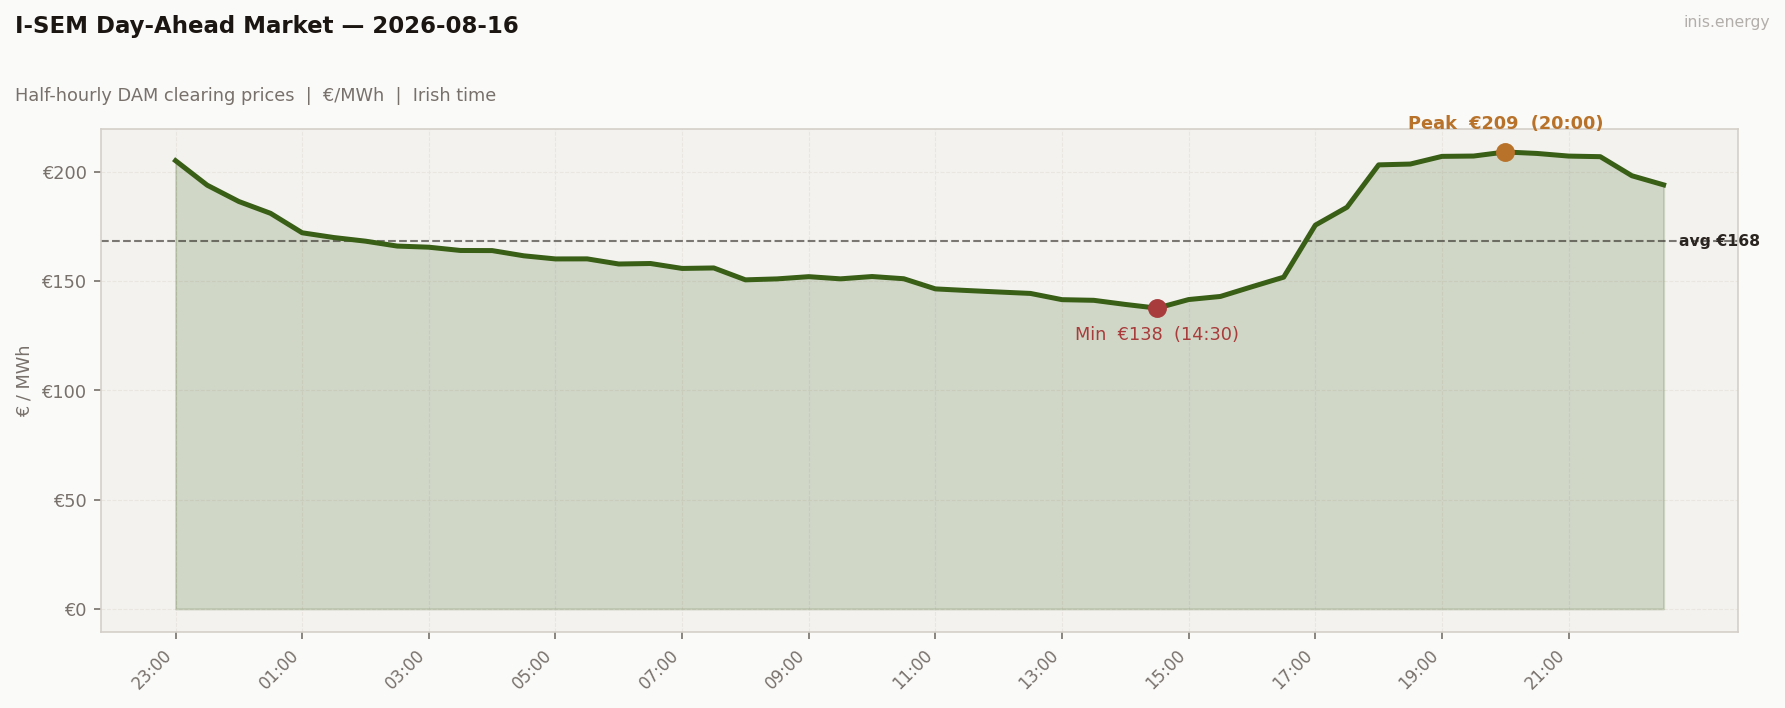
Std dev €23.52/MWh · Median €160.86/MWh · Periods above €150: 37 of 48 (77%)
Price vs Wind #
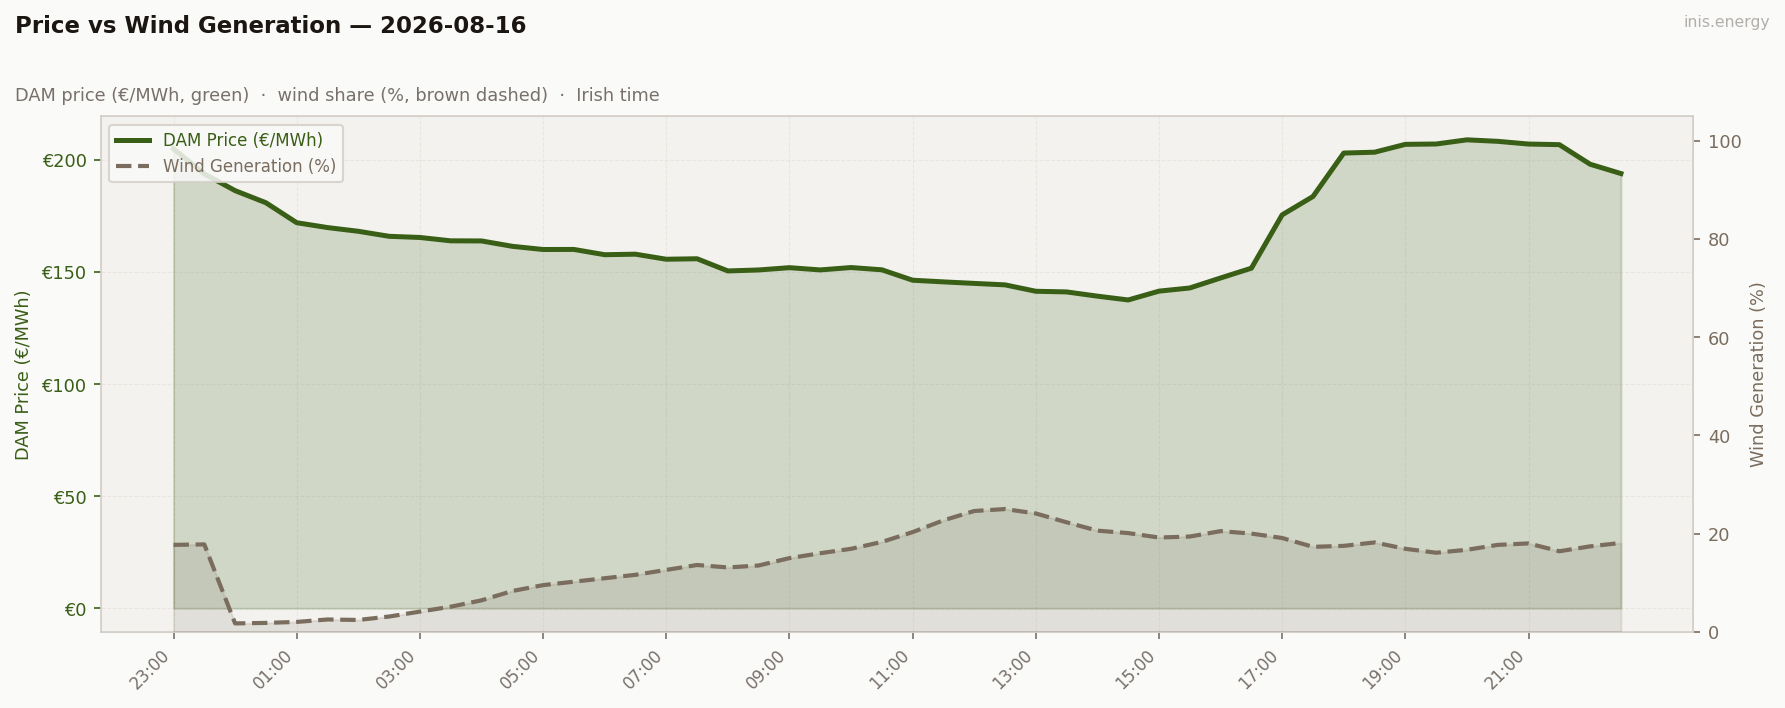
Mean wind: 14.6% · Range: 1.7%–25.0%
Week in Context #
Price Duration Curve #
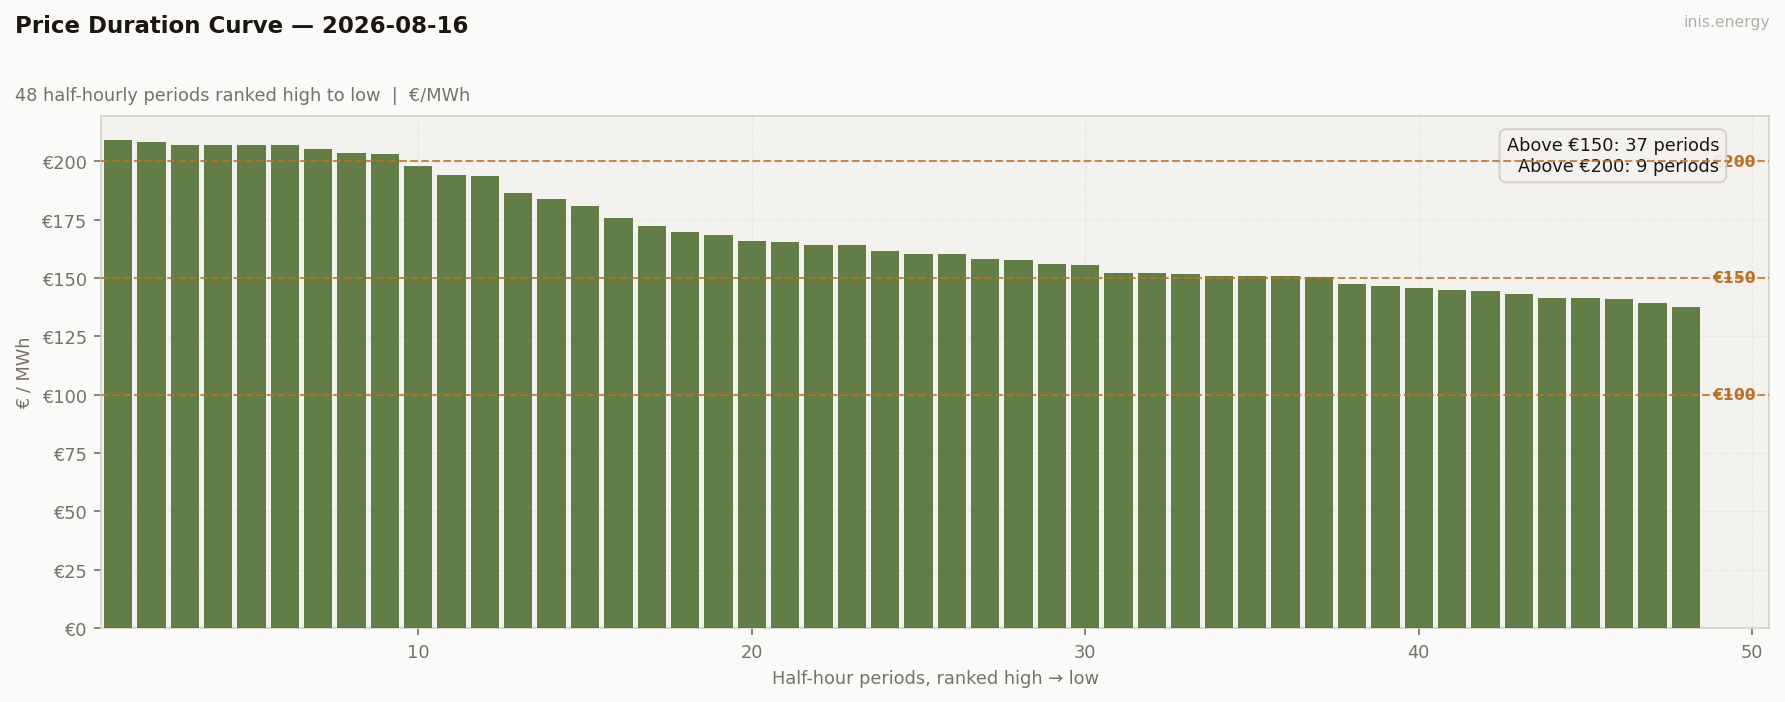
Periods above €150: 37 (77% of day) · Above €200: 9 (19% of day)
Peak / Off-Peak Spread #
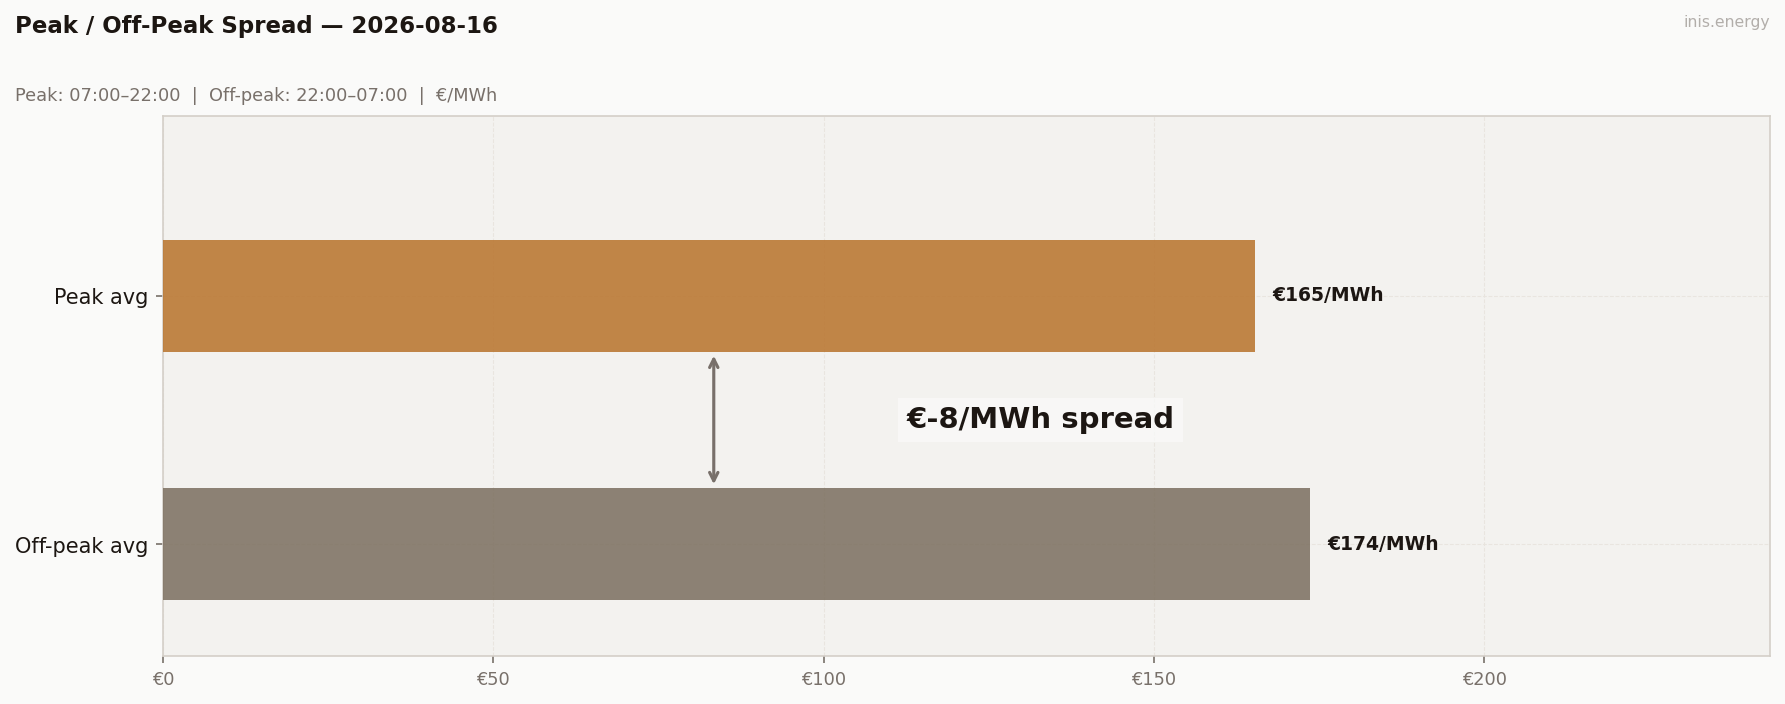
Peak avg (07:00–22:00): €165.21/MWh · Off-peak avg: €173.67/MWh · Spread: €-8.46/MWh
BESS Dispatch Signal #
| Price | Time | Energy | Value | |
|---|---|---|---|---|
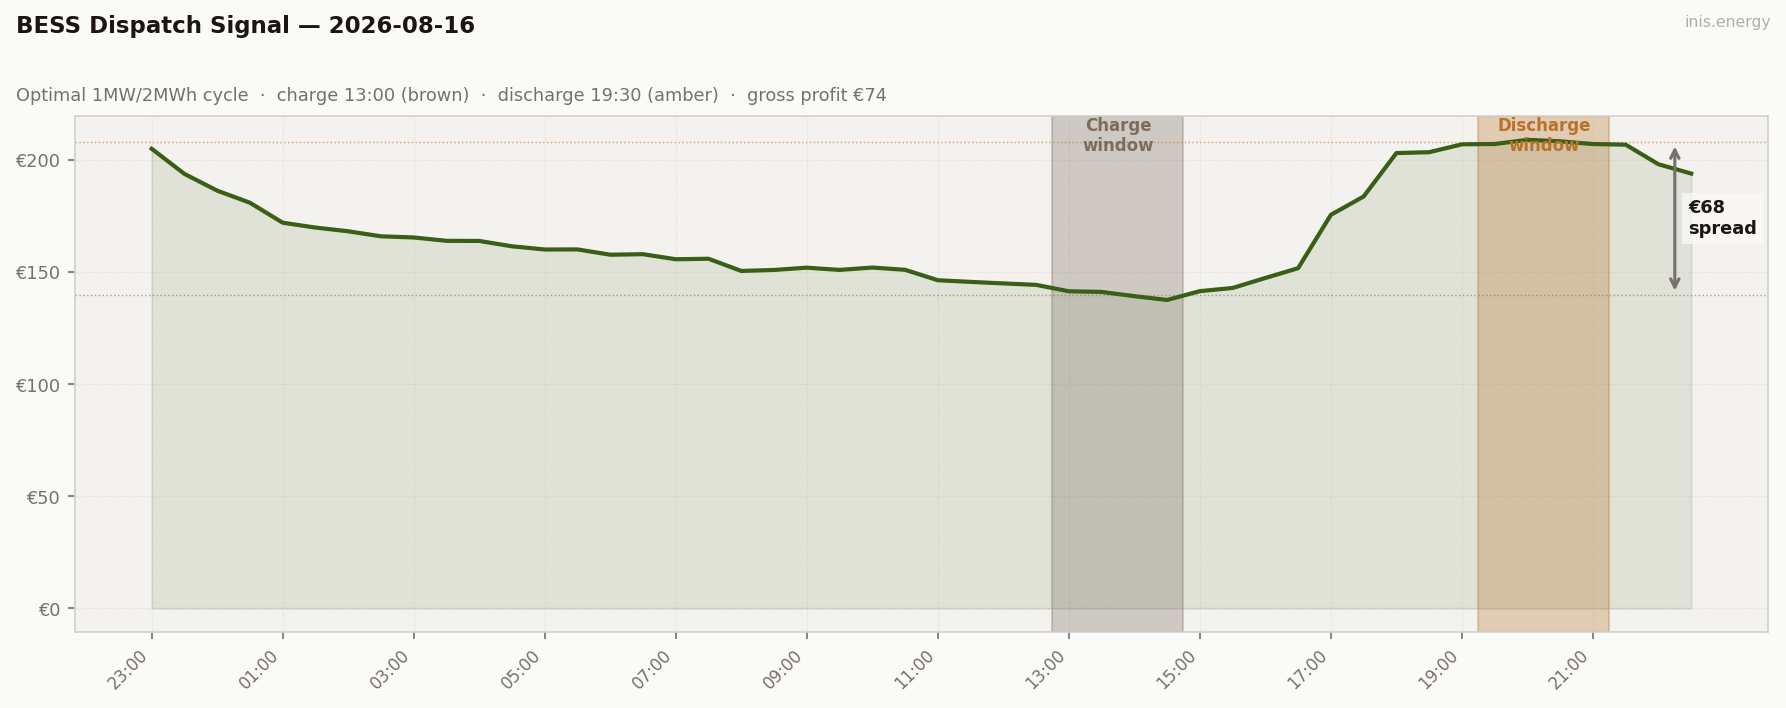
| Charge | €140/MWh | 13:00 | 2 MWh | −€280 |
| Discharge | €208/MWh | 19:30 | 1.7 MWh (85% RTE) | +€354 |
| Gross profit | €74 | |||
| Price spread | €68/MWh | ROI: 26.4% |
Simulated 1MW/2MWh battery, one optimal DAM cycle. Gross before network charges and capacity costs.
Commentary #
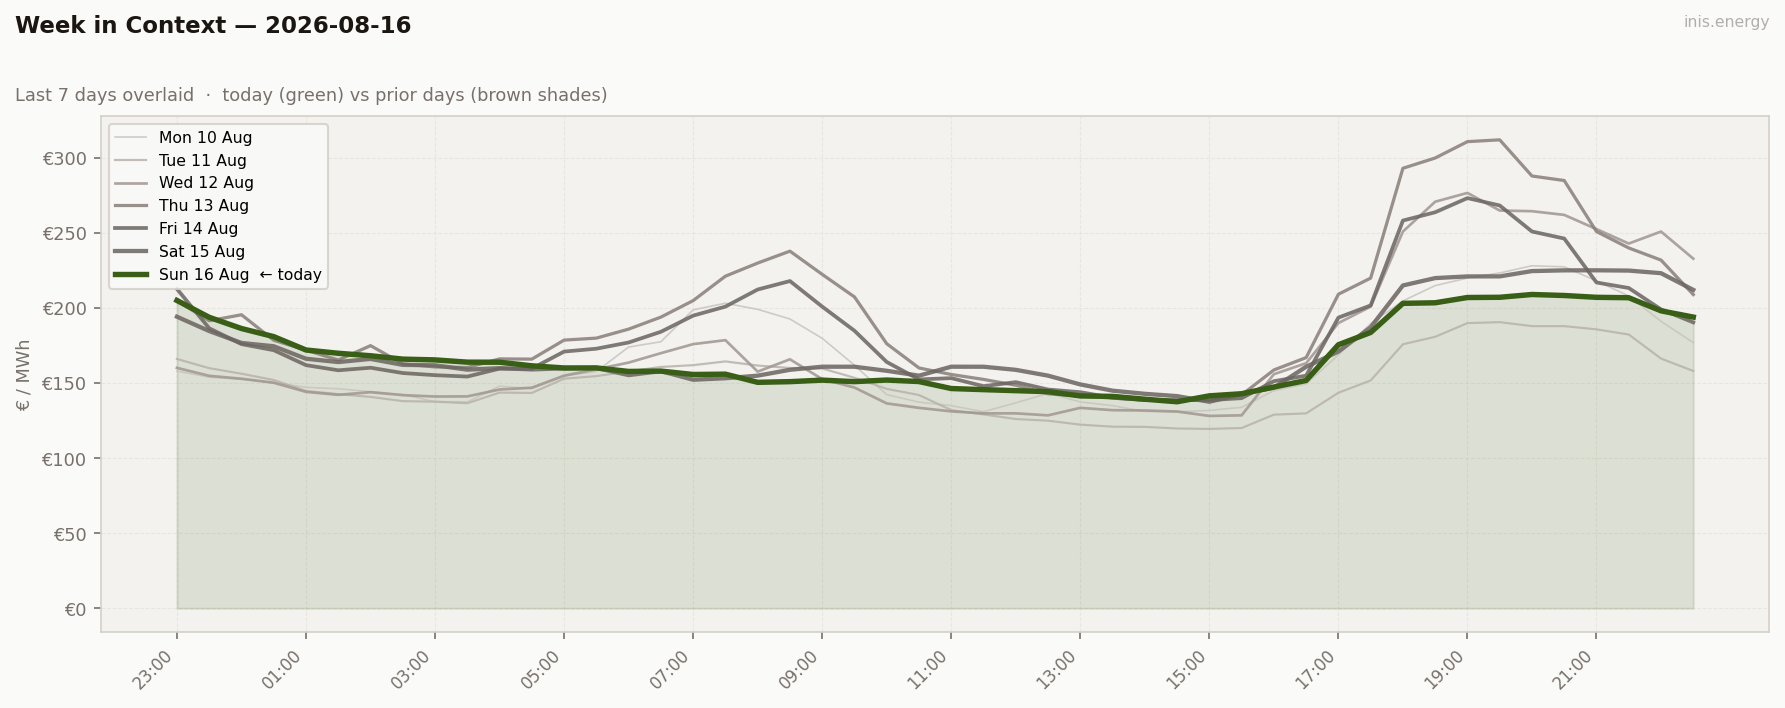
Sunday pushed the weekend demand story further and delivered the week’s flattest day: std dev €23.52, mean €168.38, both new lows. The standout number is the peak/off-peak spread — it went negative, €-8.46, meaning the average price during peak hours (07:00–22:00) actually came in below the overnight average. With Sunday demand at the week’s floor (3583 MW) and wind up to a moderate 14.6% (1.7–25.0%), there was no daytime demand pull strong enough to lift peak-hour prices above whatever held overnight — a genuine inversion of the usual shape, not just a flat day.
Storage had its weakest showing of the run: €74 gross, 26.4% ROI, charging the 13:00 €140 trough into a modest 19:30 €208 discharge. Two weekend days, two of the run’s weakest storage returns. The rule holds regardless of how low wind sits: no volatility, no revenue.
Half-hourly data — 2026-08-16
| Period | Time | Price (€/MWh) | Wind % |
|---|---|---|---|
| 1 | 23:00 | 205.09 | 17.7% |
| 2 | 23:30 | 193.87 | 17.8% |
| 3 | 00:00 | 186.40 | 1.7% |
| 4 | 00:30 | 181.00 | 1.8% |
| 5 | 01:00 | 172.09 | 2.0% |
| 6 | 01:30 | 169.92 | 2.5% |
| 7 | 02:00 | 168.26 | 2.4% |
| 8 | 02:30 | 166.02 | 3.1% |
| 9 | 03:00 | 165.50 | 4.1% |
| 10 | 03:30 | 164.00 | 5.1% |
| 11 | 04:00 | 163.95 | 6.4% |
| 12 | 04:30 | 161.56 | 8.3% |
| 13 | 05:00 | 160.13 | 9.5% |
| 14 | 05:30 | 160.16 | 10.2% |
| 15 | 06:00 | 157.81 | 10.9% |
| 16 | 06:30 | 158.04 | 11.6% |
| 17 | 07:00 | 155.78 | 12.6% |
| 18 | 07:30 | 156.00 | 13.6% |
| 19 | 08:00 | 150.56 | 13.1% |
| 20 | 08:30 | 151.00 | 13.5% |
| 21 | 09:00 | 152.02 | 15.0% |
| 22 | 09:30 | 151.02 | 16.0% |
| 23 | 10:00 | 152.08 | 16.9% |
| 24 | 10:30 | 151.07 | 18.3% |
| 25 | 11:00 | 146.42 | 20.3% |
| 26 | 11:30 | 145.68 | 22.7% |
| 27 | 12:00 | 145.00 | 24.6% |
| 28 | 12:30 | 144.35 | 25.0% |
| 29 | 13:00 | 141.49 | 24.1% |
| 30 | 13:30 | 141.20 | 22.3% |
| 31 | 14:00 | 139.31 | 20.6% |
| 32 | 14:30 | 137.61 | 20.1% |
| 33 | 15:00 | 141.55 | 19.2% |
| 34 | 15:30 | 142.96 | 19.4% |
| 35 | 16:00 | 147.42 | 20.5% |
| 36 | 16:30 | 151.79 | 20.0% |
| 37 | 17:00 | 175.60 | 19.1% |
| 38 | 17:30 | 183.79 | 17.3% |
| 39 | 18:00 | 203.17 | 17.5% |
| 40 | 18:30 | 203.55 | 18.2% |
| 41 | 19:00 | 207.06 | 16.9% |
| 42 | 19:30 | 207.21 | 16.1% |
| 43 | 20:00 | 209.07 | 16.7% |
| 44 | 20:30 | 208.40 | 17.7% |
| 45 | 21:00 | 207.19 | 18.0% |
| 46 | 21:30 | 206.92 | 16.4% |
| 47 | 22:00 | 198.18 | 17.4% |
| 48 | 22:30 | 194.02 | 18.1% |
Compare your business electricity and gas rates in minutes with INIS Energy Brokers.
Compare rates