I-SEM Daily Briefing — 17 August 2026
Table of Contents
Market Snapshot
| Metric | Value |
|---|---|
| Mean DAM Price | €192.2/MWh |
| Median Price | €189.95/MWh |
| Std Dev | €24.16/MWh |
| Peak Price | €248.0/MWh (09:30) |
| Min Price | €162.12/MWh (15:30) |
| Price Range | €85.88/MWh |
| Periods above €150 | 48 of 48 (100%) |
| Periods above €200 | 20 of 48 (42%) |
| Peak Avg (07–22) | €200.55/MWh |
| Off-peak Avg (22–07) | €178.27/MWh |
| Peak/Off-Peak Spread | €22.28/MWh |
| Wind % of Demand | 23.7% |
| Wind Range | 8.2%–48.0% |
| Mean Demand | 3920 MW |
Price Profile #
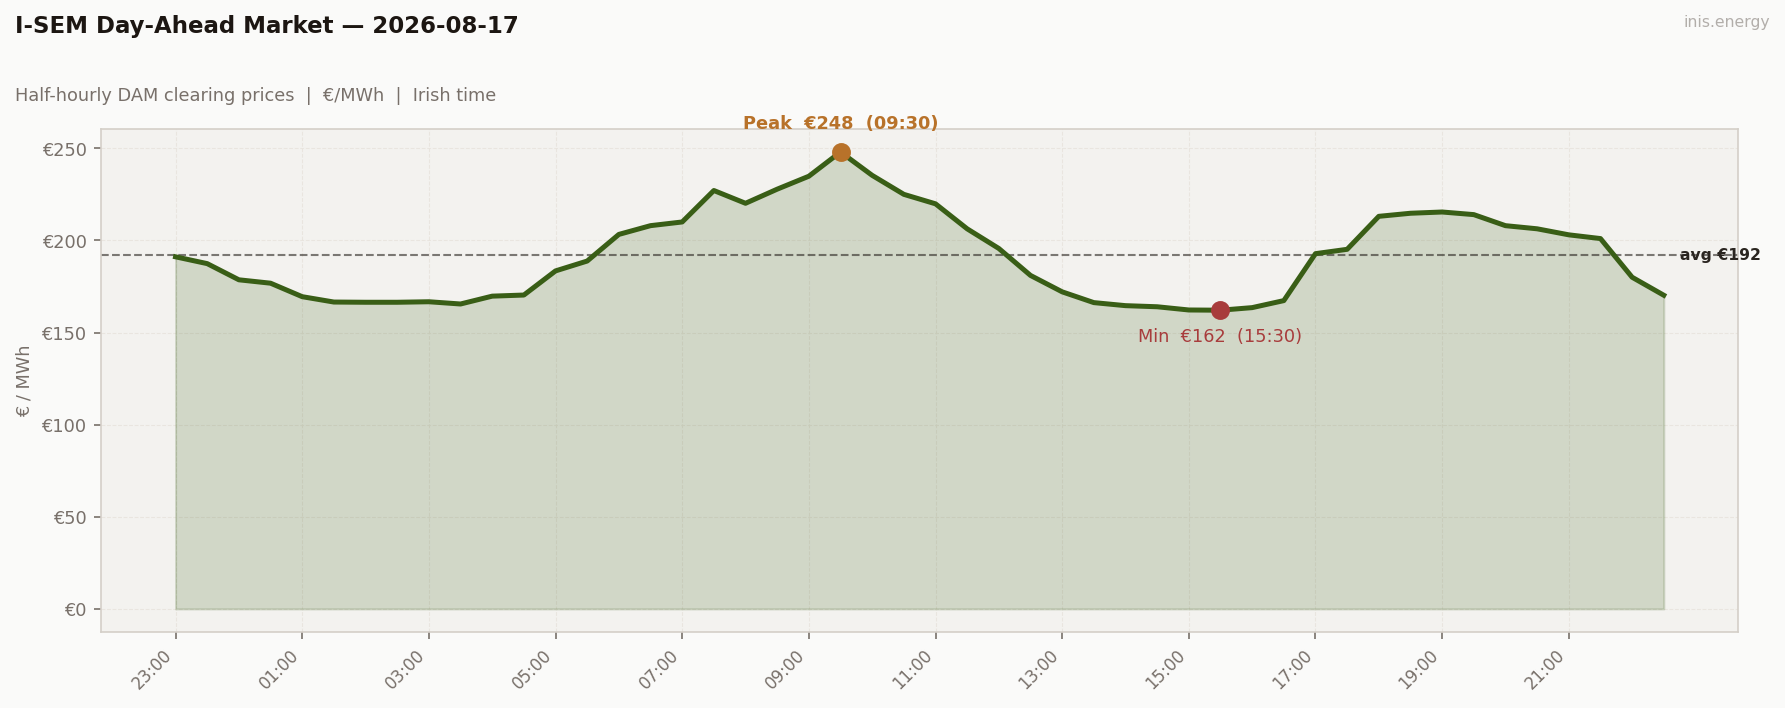
Std dev €24.16/MWh · Median €189.95/MWh · Periods above €150: 48 of 48 (100%)
Price vs Wind #
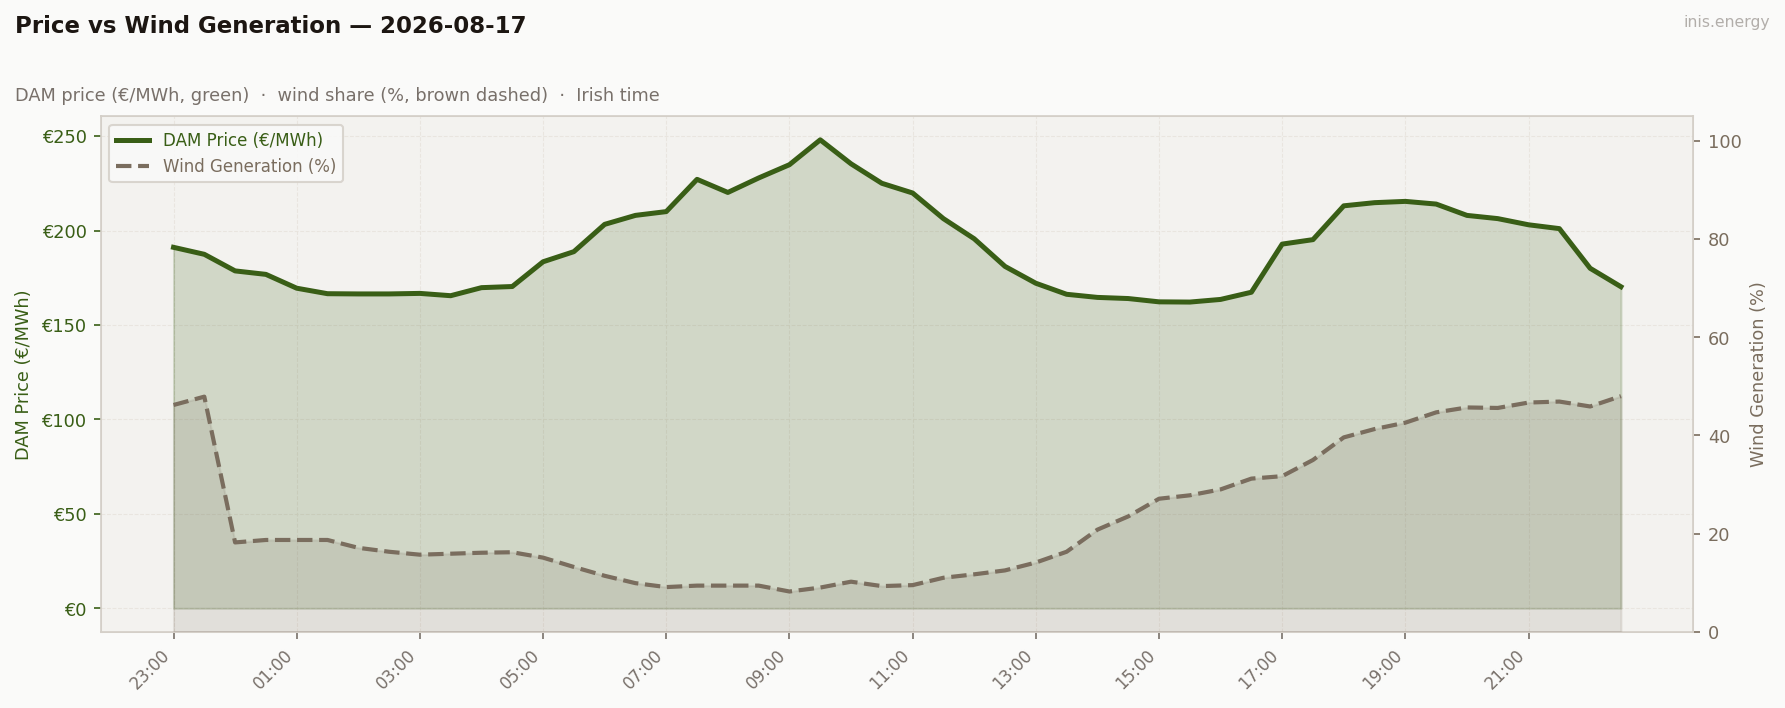
Mean wind: 23.7% · Range: 8.2%–48.0%
Week in Context #
Price Duration Curve #
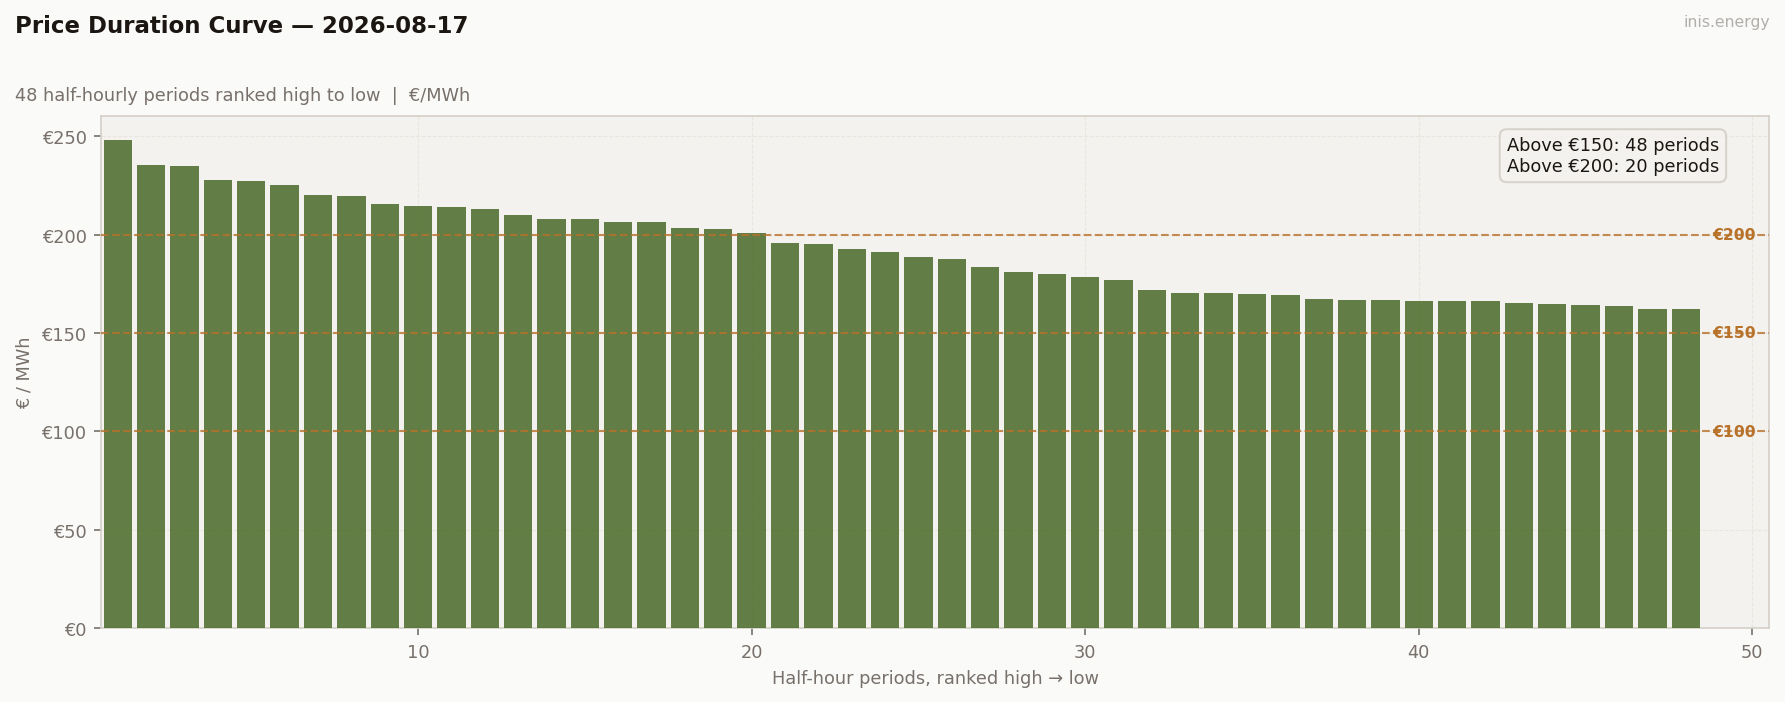
Periods above €150: 48 (100% of day) · Above €200: 20 (42% of day)
Peak / Off-Peak Spread #
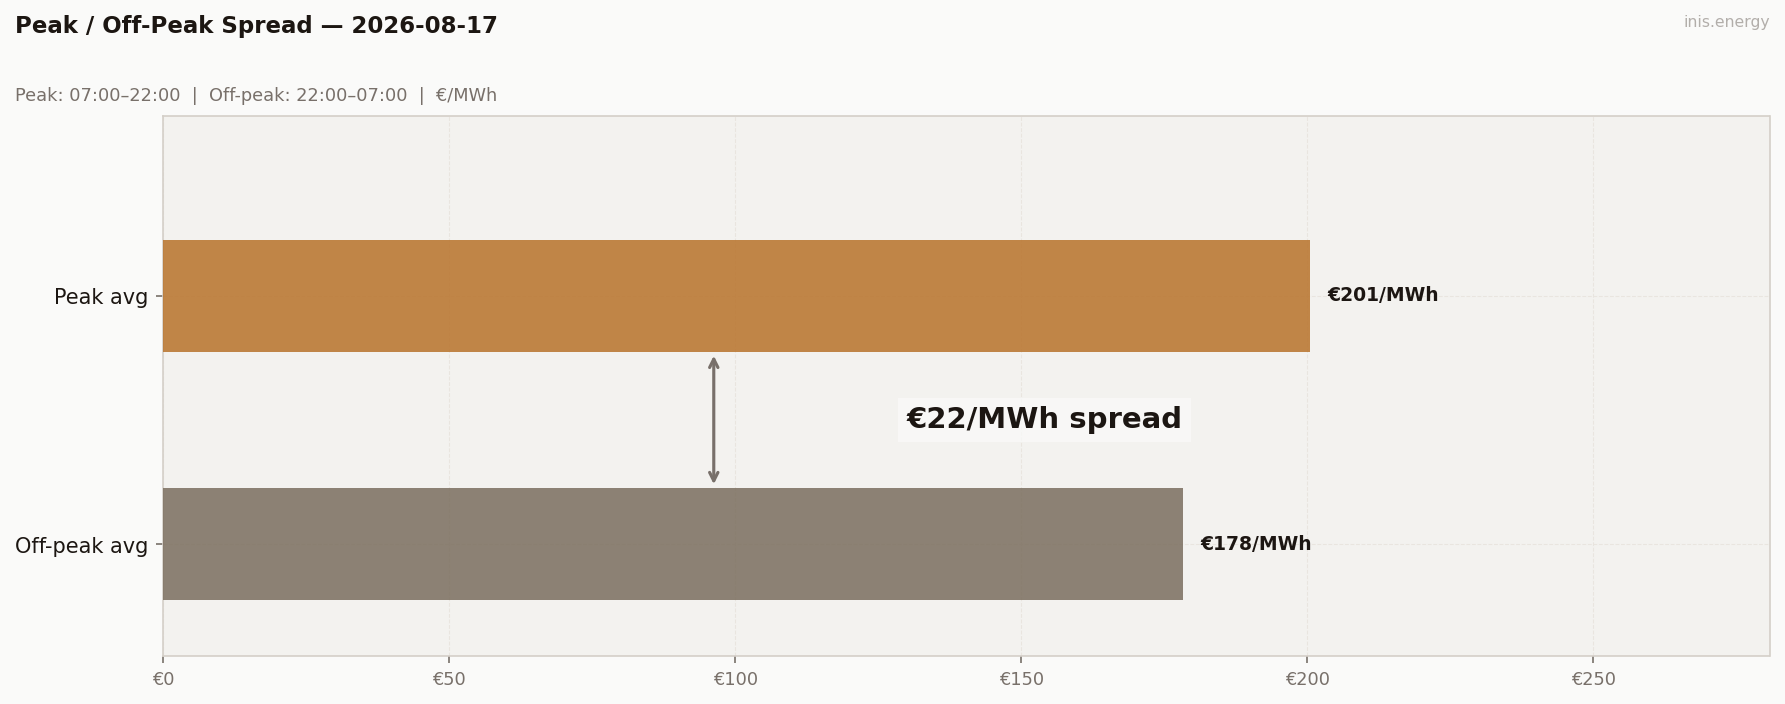
Peak avg (07:00–22:00): €200.55/MWh · Off-peak avg: €178.27/MWh · Spread: €22.28/MWh
BESS Dispatch Signal #
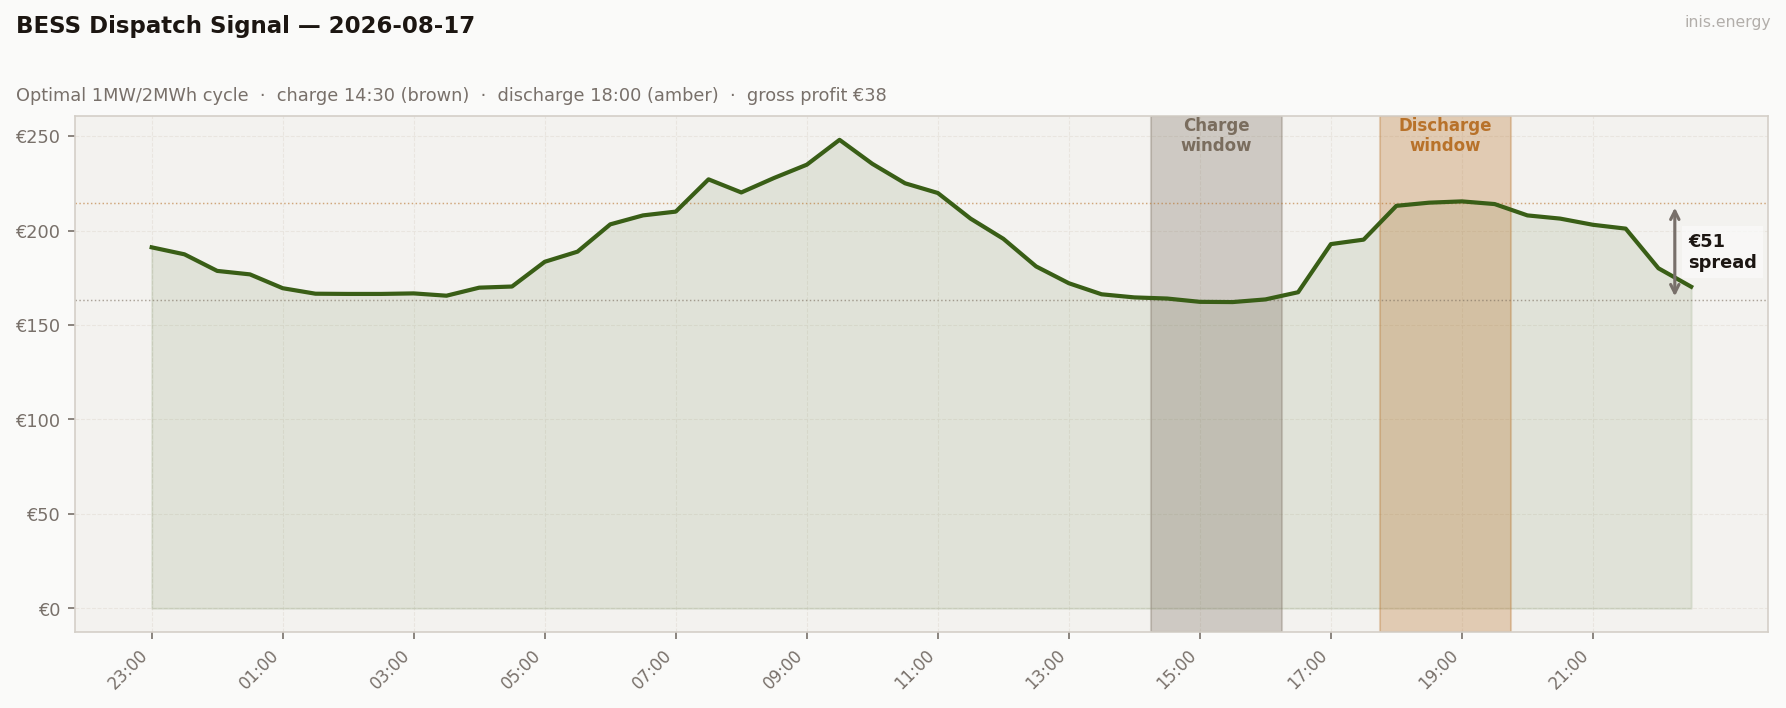
| Price | Time | Energy | Value | |
|---|---|---|---|---|
| Charge | €163/MWh | 14:30 | 2 MWh | −€326 |
| Discharge | €214/MWh | 18:00 | 1.7 MWh (85% RTE) | +€364 |
| Gross profit | €38 | |||
| Price spread | €51/MWh | ROI: 11.8% |
Simulated 1MW/2MWh battery, one optimal DAM cycle. Gross before network charges and capacity costs.
Commentary #
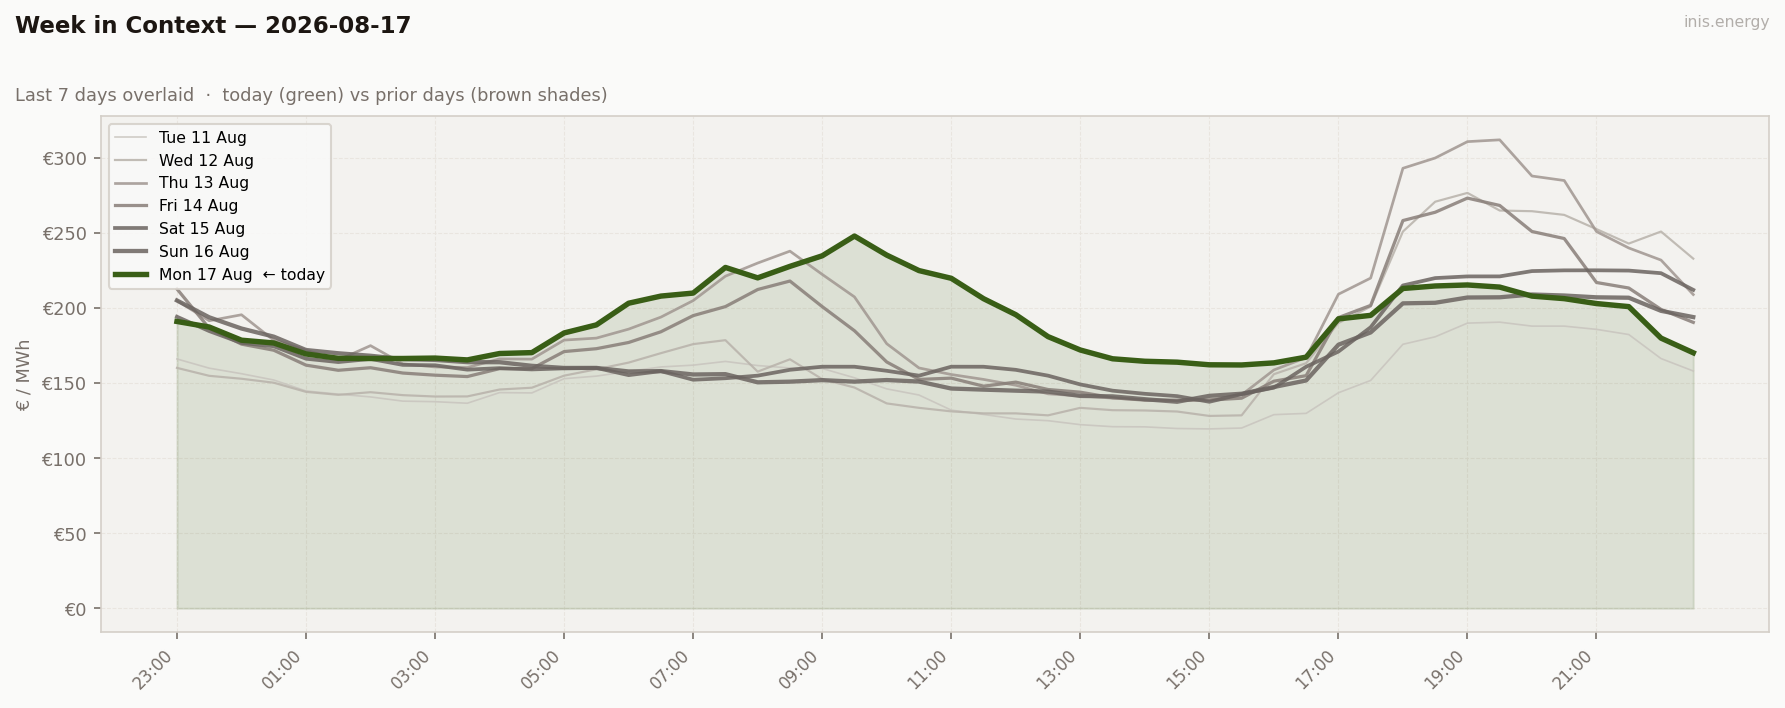
Monday broke the shape as well as the pattern. Overnight wind was strong — 46–48% through the small hours — but it collapsed to single digits by 06:00–09:30, right as morning demand ramped up, and the price spiked into a €248.00 peak at 09:30. That’s a morning squeeze, not the usual evening one, and it’s why every single period cleared above €150 today (100%, the first time this week) and 42% cleared above €200. Wind recovered steadily through the afternoon and evening — back to 40%+ by 18:00 — which capped what would otherwise have been a second, evening peak: prices eased to a €162.12 trough at 15:30 and only climbed back to €215-ish by 19:00, well under the morning’s €248.
Storage charged into the afternoon trough at 14:30 (€163 avg) and discharged into the evening peak at 18:00 (€214 avg). €38 gross, 11.8% ROI — a modest return, because the morning squeeze at 09:30 (€248 peak) was the day’s real scarcity event, but it came before the afternoon trough, so a same-day cycle couldn’t reach it: the battery can only discharge into a window after it has charged, and by the time the afternoon trough opened up, the morning’s sharper peak was already behind it.
Half-hourly data — 2026-08-17
| Period | Time | Price (€/MWh) | Wind % |
|---|---|---|---|
| 1 | 23:00 | 191.10 | 46.2% |
| 2 | 23:30 | 187.40 | 47.9% |
| 3 | 00:00 | 178.62 | 18.2% |
| 4 | 00:30 | 176.78 | 18.7% |
| 5 | 01:00 | 169.46 | 18.7% |
| 6 | 01:30 | 166.55 | 18.7% |
| 7 | 02:00 | 166.43 | 17.1% |
| 8 | 02:30 | 166.43 | 16.3% |
| 9 | 03:00 | 166.71 | 15.7% |
| 10 | 03:30 | 165.49 | 15.9% |
| 11 | 04:00 | 169.75 | 16.1% |
| 12 | 04:30 | 170.35 | 16.2% |
| 13 | 05:00 | 183.45 | 15.1% |
| 14 | 05:30 | 188.81 | 13.2% |
| 15 | 06:00 | 203.26 | 11.4% |
| 16 | 06:30 | 208.01 | 9.9% |
| 17 | 07:00 | 210.01 | 9.1% |
| 18 | 07:30 | 227.09 | 9.4% |
| 19 | 08:00 | 220.15 | 9.4% |
| 20 | 08:30 | 227.81 | 9.4% |
| 21 | 09:00 | 234.84 | 8.2% |
| 22 | 09:30 | 248.00 | 9.0% |
| 23 | 10:00 | 235.31 | 10.2% |
| 24 | 10:30 | 225.00 | 9.3% |
| 25 | 11:00 | 219.86 | 9.5% |
| 26 | 11:30 | 206.29 | 11.0% |
| 27 | 12:00 | 195.62 | 11.7% |
| 28 | 12:30 | 181.00 | 12.5% |
| 29 | 13:00 | 172.09 | 14.1% |
| 30 | 13:30 | 166.24 | 16.3% |
| 31 | 14:00 | 164.59 | 20.8% |
| 32 | 14:30 | 163.99 | 23.5% |
| 33 | 15:00 | 162.24 | 27.1% |
| 34 | 15:30 | 162.12 | 27.8% |
| 35 | 16:00 | 163.52 | 29.0% |
| 36 | 16:30 | 167.33 | 31.2% |
| 37 | 17:00 | 192.81 | 31.7% |
| 38 | 17:30 | 195.17 | 35.0% |
| 39 | 18:00 | 213.07 | 39.6% |
| 40 | 18:30 | 214.74 | 41.3% |
| 41 | 19:00 | 215.42 | 42.6% |
| 42 | 19:30 | 214.00 | 44.7% |
| 43 | 20:00 | 208.00 | 45.7% |
| 44 | 20:30 | 206.30 | 45.6% |
| 45 | 21:00 | 203.03 | 46.7% |
| 46 | 21:30 | 201.00 | 46.9% |
| 47 | 22:00 | 180.01 | 45.9% |
| 48 | 22:30 | 170.24 | 48.0% |
Compare your business electricity and gas rates in minutes with INIS Energy Brokers.
Compare rates