I-SEM Daily Briefing — 18 August 2026
Table of Contents
Market Snapshot
| Metric | Value |
|---|---|
| Mean DAM Price | €168.19/MWh |
| Median Price | €160.93/MWh |
| Std Dev | €22.06/MWh |
| Peak Price | €207.89/MWh (19:30) |
| Min Price | €142.0/MWh (03:30) |
| Price Range | €65.89/MWh |
| Periods above €150 | 31 of 48 (65%) |
| Periods above €200 | 7 of 48 (15%) |
| Peak Avg (07–22) | €173.5/MWh |
| Off-peak Avg (22–07) | €159.35/MWh |
| Peak/Off-Peak Spread | €14.15/MWh |
| Wind % of Demand | 32.4% |
| Wind Range | 14.9%–51.7% |
| Mean Demand | 3976 MW |
Price Profile #
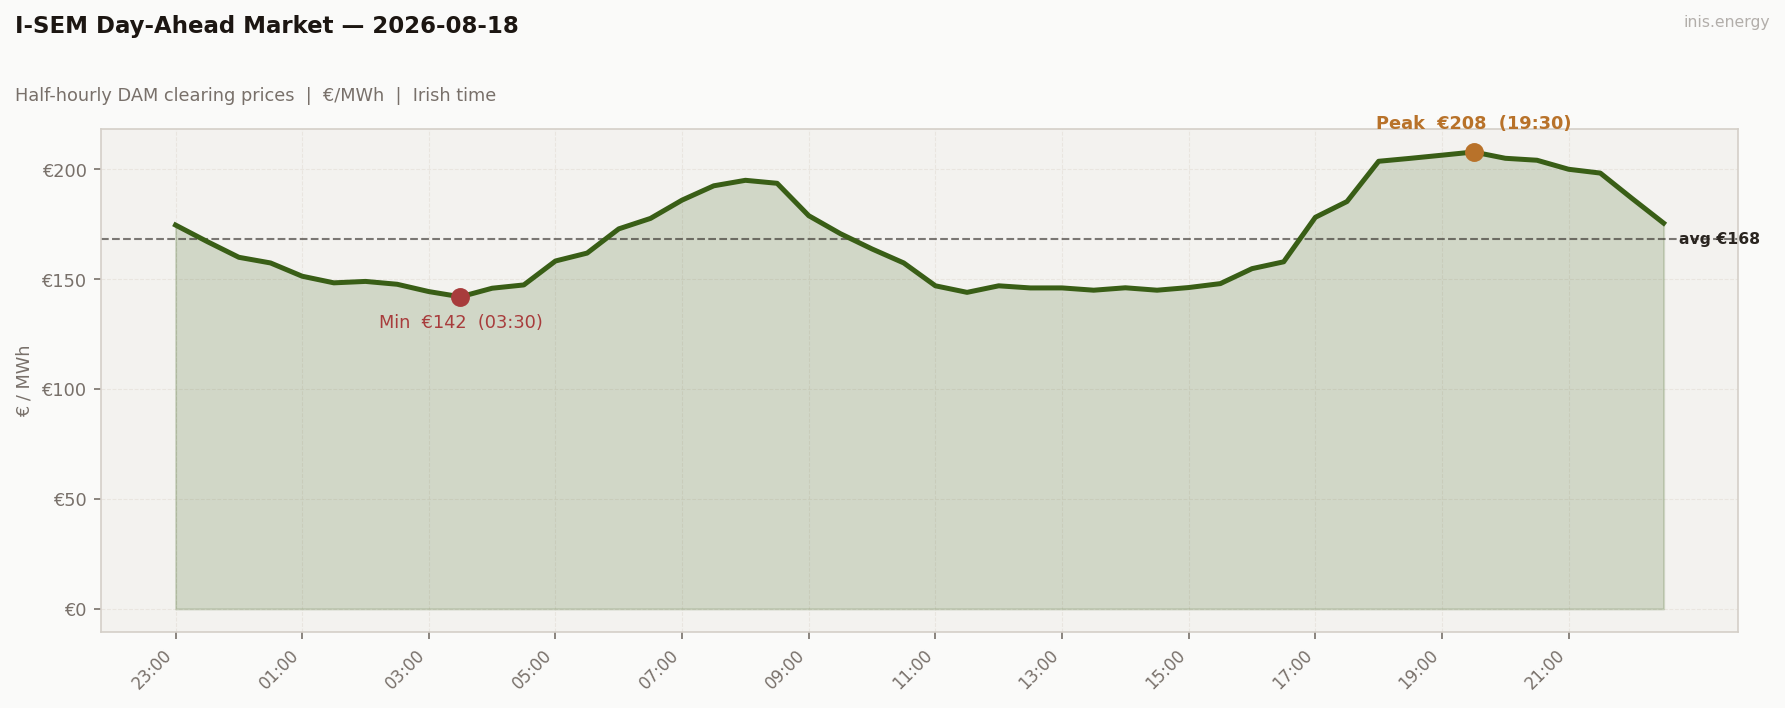
Std dev €22.06/MWh · Median €160.93/MWh · Periods above €150: 31 of 48 (65%)
Price vs Wind #
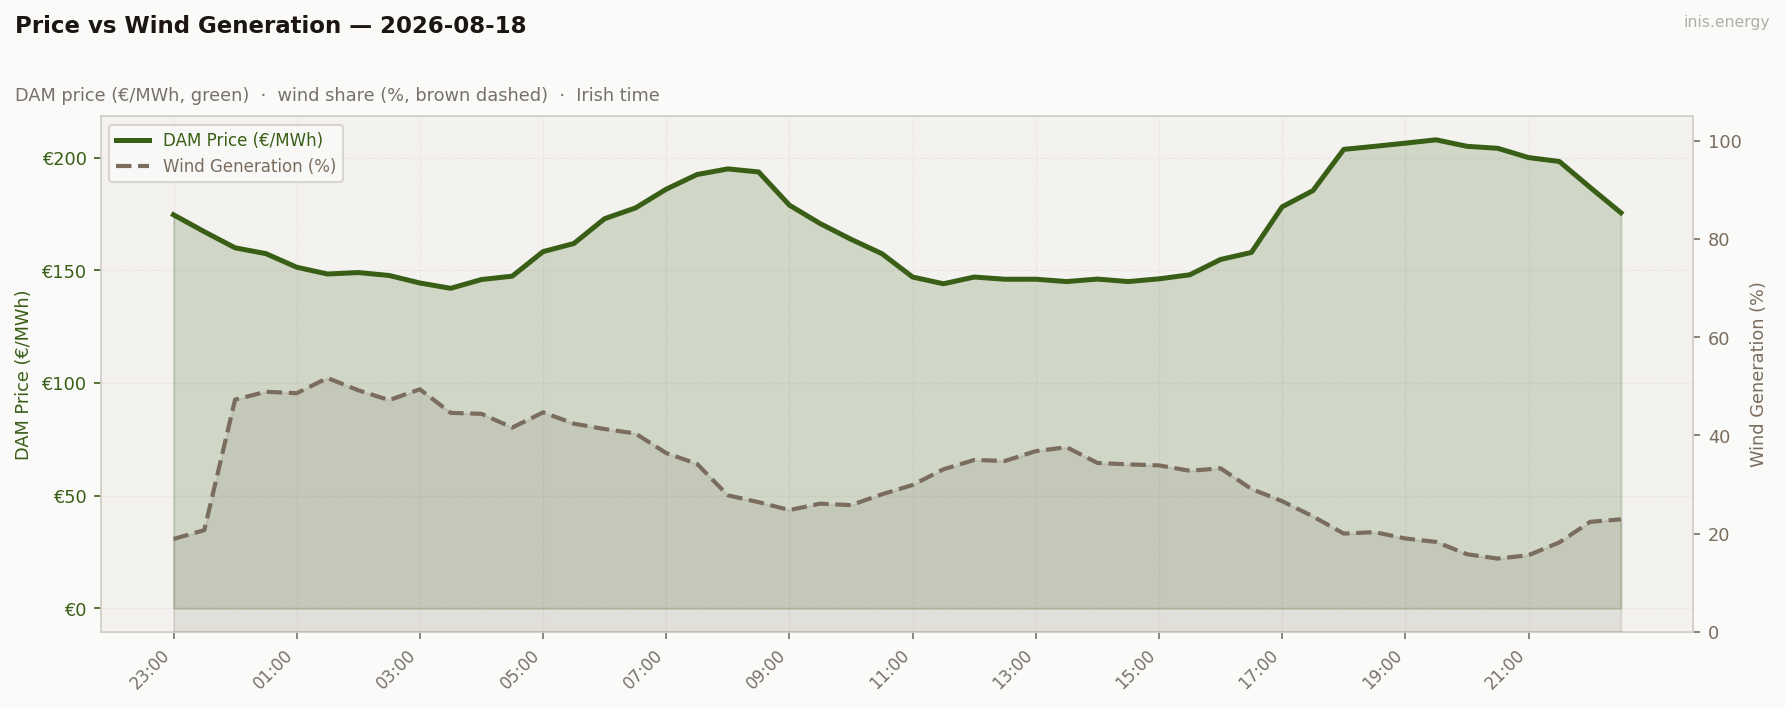
Mean wind: 32.4% · Range: 14.9%–51.7%
Week in Context #
Price Duration Curve #
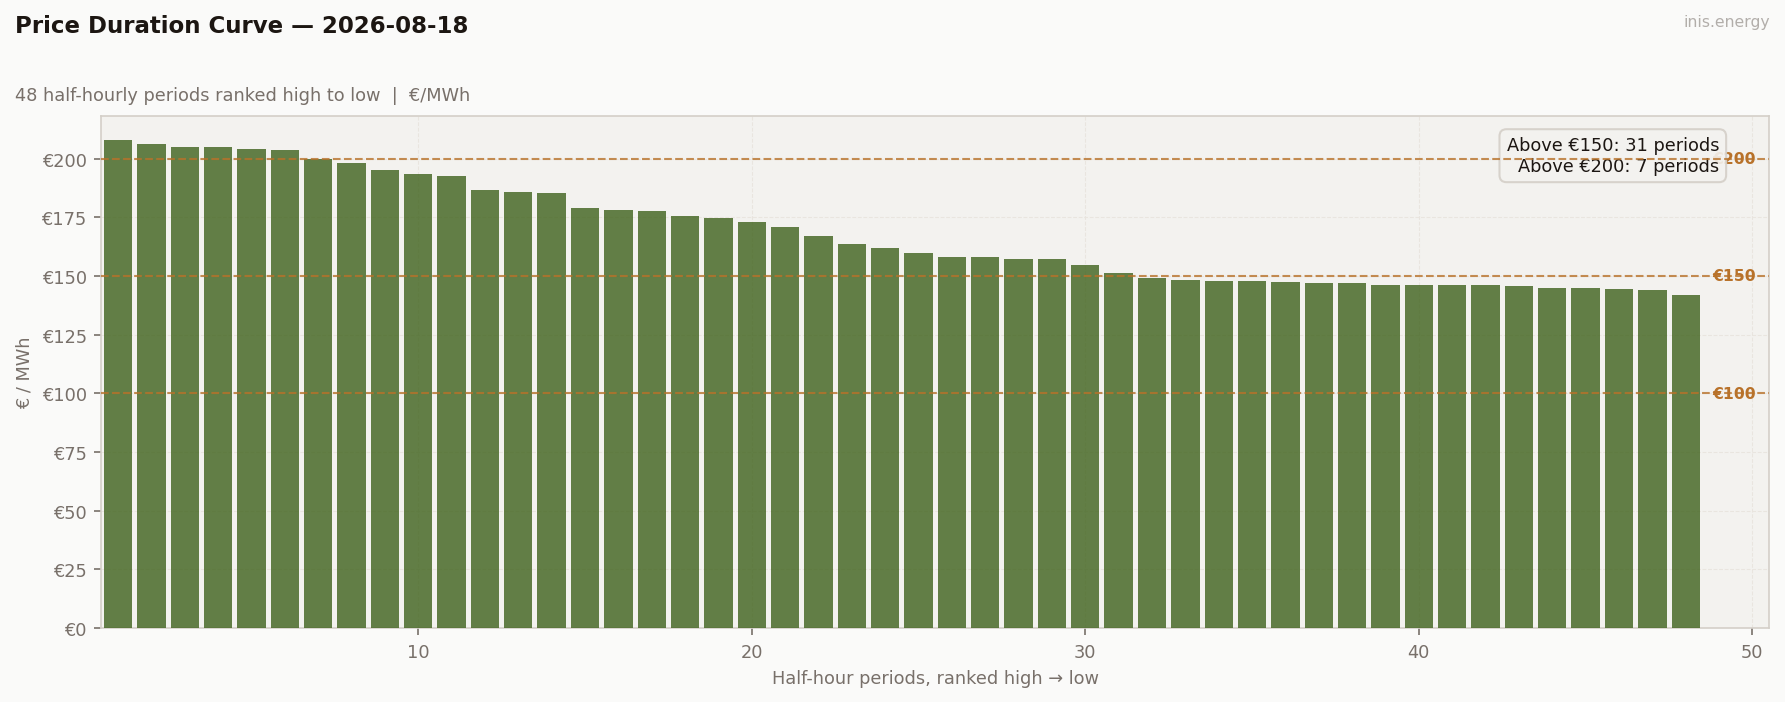
Periods above €150: 31 (65% of day) · Above €200: 7 (15% of day)
Peak / Off-Peak Spread #
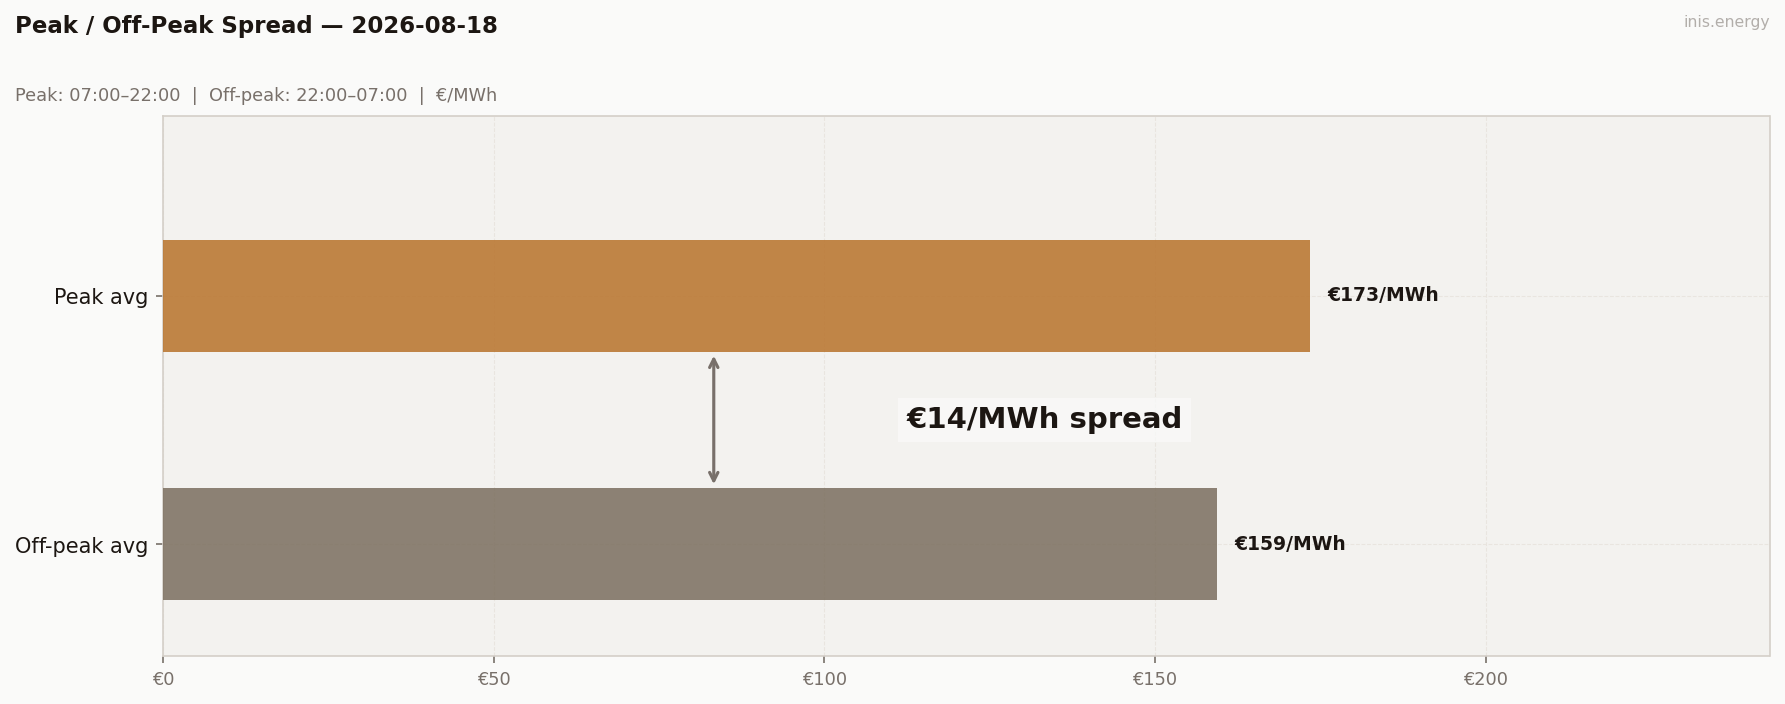
Peak avg (07:00–22:00): €173.5/MWh · Off-peak avg: €159.35/MWh · Spread: €14.15/MWh
BESS Dispatch Signal #
| Price | Time | Energy | Value | |
|---|---|---|---|---|
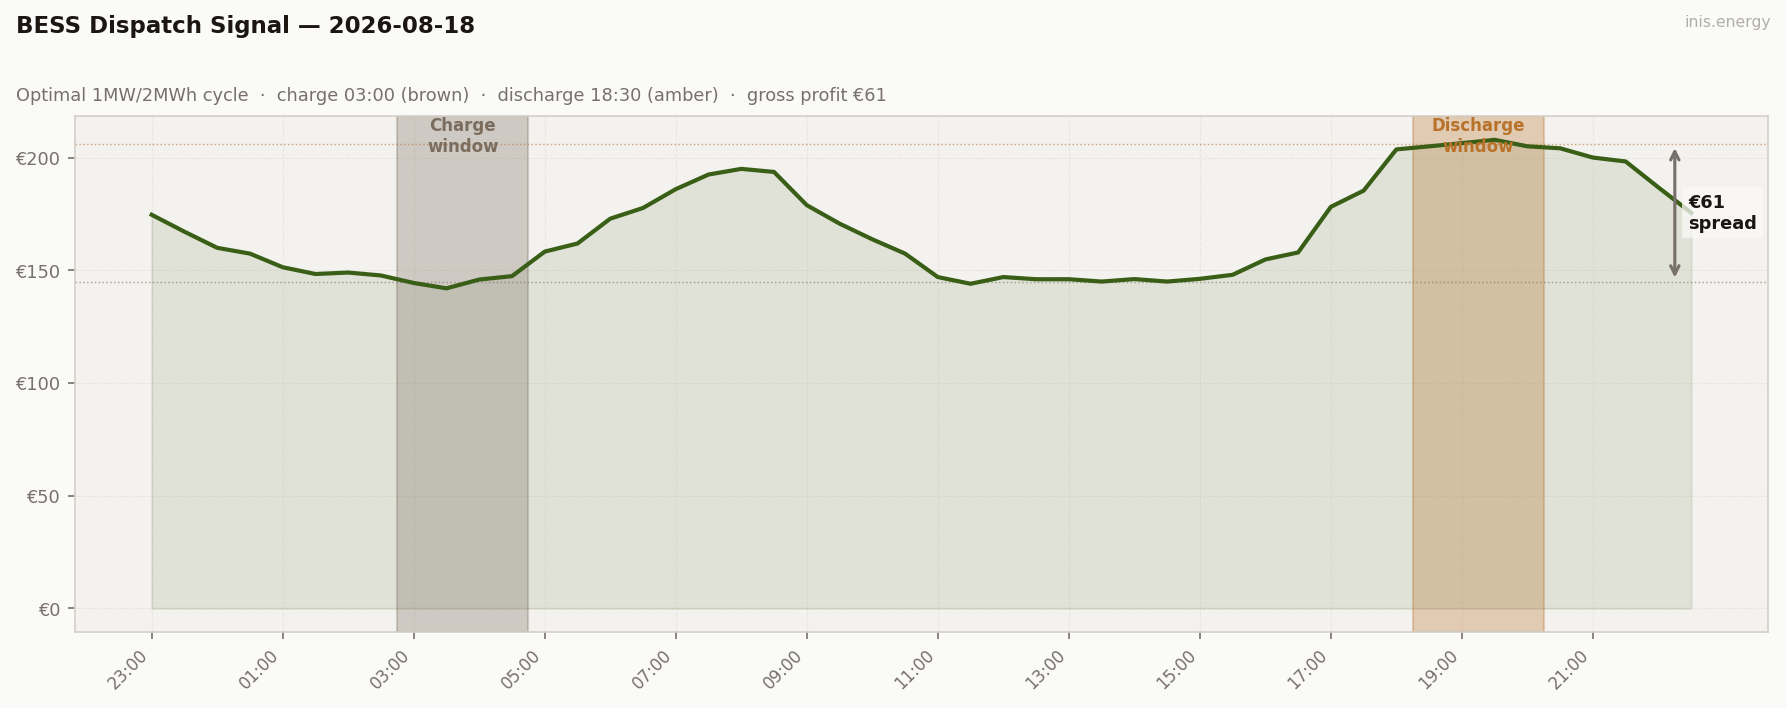
| Charge | €145/MWh | 03:00 | 2 MWh | −€290 |
| Discharge | €206/MWh | 18:30 | 1.7 MWh (85% RTE) | +€350 |
| Gross profit | €61 | |||
| Price spread | €61/MWh | ROI: 20.9% |
Simulated 1MW/2MWh battery, one optimal DAM cycle. Gross before network charges and capacity costs.
Commentary #
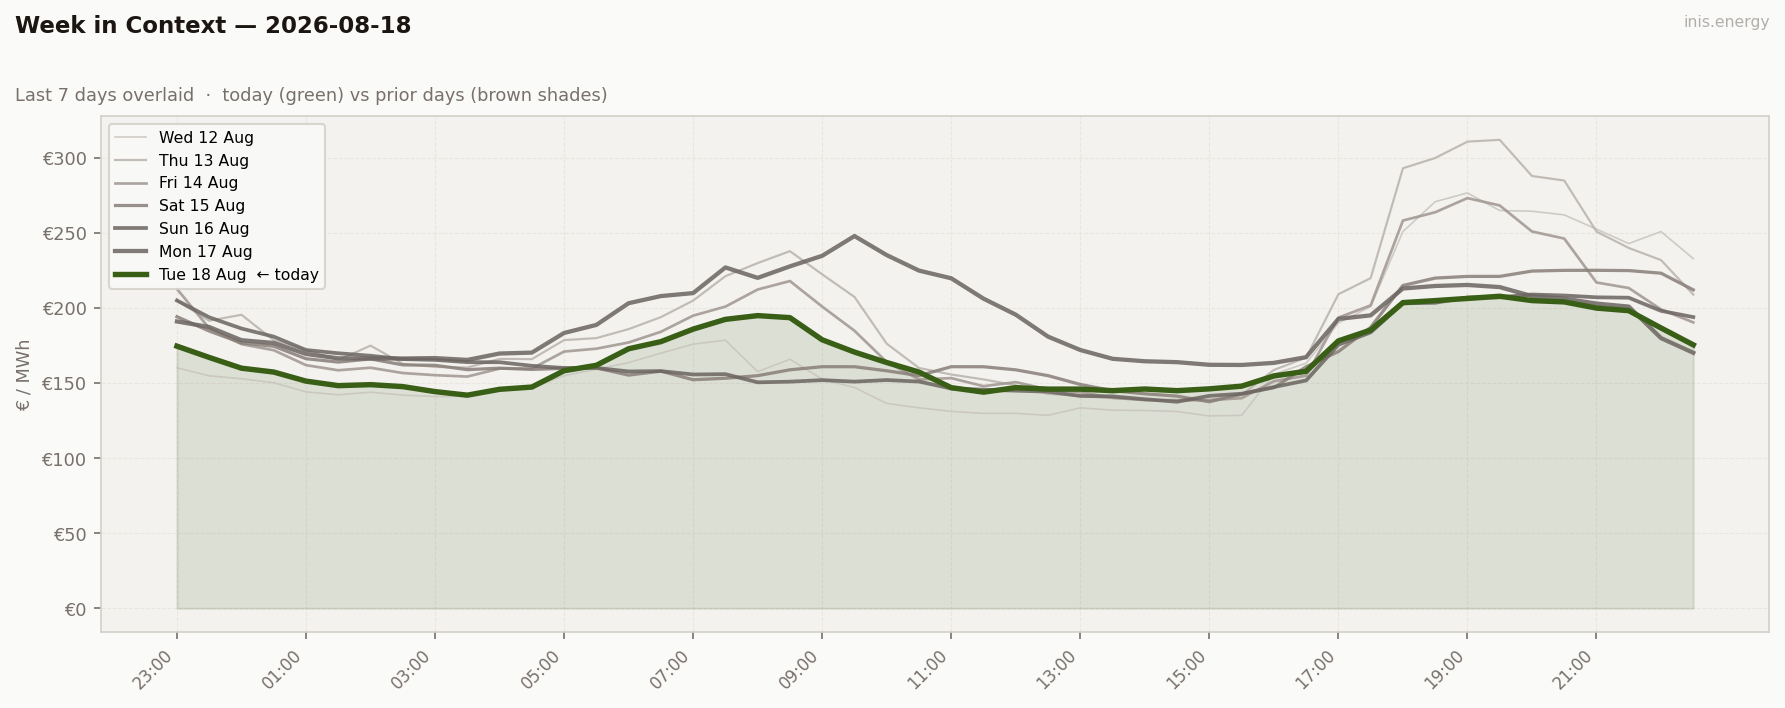
Tuesday reset the week. Wind surged overnight — 47–52% from midnight through the small hours — and drove the day’s mean down to €168.19, the run’s lowest std dev (€22.06), and just 15% of periods above €200, the quietest ceiling of the run. The €142.00 trough landed at 03:30, in the middle of that overnight wind glut, not the usual midday dip — a reminder that “trough” moves with wherever the wind actually is, not with the clock.
Storage charged into that overnight glut at 03:00 (€145) and discharged near the evening peak at 18:30 (€206, against a €207.89 day-high at 19:30 just after), for €61 gross and 20.9% ROI — the weakest weekday return of the run, because high wind flattened both ends of the spread even where the trough fell somewhere unusual. High wind is good for the system and bad for storage in the same breath: less scarcity to sell into.
Half-hourly data — 2026-08-18
| Period | Time | Price (€/MWh) | Wind % |
|---|---|---|---|
| 1 | 23:00 | 174.64 | 18.9% |
| 2 | 23:30 | 167.13 | 20.7% |
| 3 | 00:00 | 159.97 | 47.3% |
| 4 | 00:30 | 157.40 | 48.9% |
| 5 | 01:00 | 151.36 | 48.6% |
| 6 | 01:30 | 148.35 | 51.7% |
| 7 | 02:00 | 149.00 | 49.2% |
| 8 | 02:30 | 147.70 | 47.2% |
| 9 | 03:00 | 144.37 | 49.4% |
| 10 | 03:30 | 142.00 | 44.6% |
| 11 | 04:00 | 145.90 | 44.4% |
| 12 | 04:30 | 147.40 | 41.6% |
| 13 | 05:00 | 158.29 | 44.7% |
| 14 | 05:30 | 161.89 | 42.4% |
| 15 | 06:00 | 172.91 | 41.3% |
| 16 | 06:30 | 177.66 | 40.4% |
| 17 | 07:00 | 186.00 | 36.4% |
| 18 | 07:30 | 192.50 | 34.2% |
| 19 | 08:00 | 195.00 | 27.8% |
| 20 | 08:30 | 193.64 | 26.4% |
| 21 | 09:00 | 178.89 | 24.8% |
| 22 | 09:30 | 170.71 | 26.1% |
| 23 | 10:00 | 163.75 | 25.8% |
| 24 | 10:30 | 157.40 | 28.0% |
| 25 | 11:00 | 147.00 | 29.9% |
| 26 | 11:30 | 144.02 | 33.1% |
| 27 | 12:00 | 147.00 | 35.0% |
| 28 | 12:30 | 146.03 | 34.8% |
| 29 | 13:00 | 146.04 | 36.8% |
| 30 | 13:30 | 145.00 | 37.6% |
| 31 | 14:00 | 146.10 | 34.4% |
| 32 | 14:30 | 145.00 | 34.1% |
| 33 | 15:00 | 146.21 | 33.9% |
| 34 | 15:30 | 148.00 | 32.8% |
| 35 | 16:00 | 154.81 | 33.3% |
| 36 | 16:30 | 157.92 | 29.1% |
| 37 | 17:00 | 178.17 | 26.6% |
| 38 | 17:30 | 185.35 | 23.5% |
| 39 | 18:00 | 203.66 | 20.0% |
| 40 | 18:30 | 205.00 | 20.3% |
| 41 | 19:00 | 206.43 | 19.0% |
| 42 | 19:30 | 207.89 | 18.3% |
| 43 | 20:00 | 205.02 | 15.8% |
| 44 | 20:30 | 204.13 | 14.9% |
| 45 | 21:00 | 200.02 | 15.6% |
| 46 | 21:30 | 198.29 | 18.2% |
| 47 | 22:00 | 186.77 | 22.4% |
| 48 | 22:30 | 175.52 | 22.9% |
Compare your business electricity and gas rates in minutes with INIS Energy Brokers.
Compare rates