I-SEM Daily Briefing — 19 August 2026
Table of Contents
Market Snapshot
| Metric | Value |
|---|---|
| Mean DAM Price | €173.6/MWh |
| Median Price | €164.83/MWh |
| Std Dev | €24.62/MWh |
| Peak Price | €220.93/MWh (19:00) |
| Min Price | €146.15/MWh (15:00) |
| Price Range | €74.78/MWh |
| Periods above €150 | 37 of 48 (77%) |
| Periods above €200 | 9 of 48 (19%) |
| Peak Avg (07–22) | €176.76/MWh |
| Off-peak Avg (22–07) | €168.32/MWh |
| Peak/Off-Peak Spread | €8.44/MWh |
| Wind % of Demand | 32.5% |
| Wind Range | 23.0%–42.0% |
| Mean Demand | 3868 MW |
Price Profile #
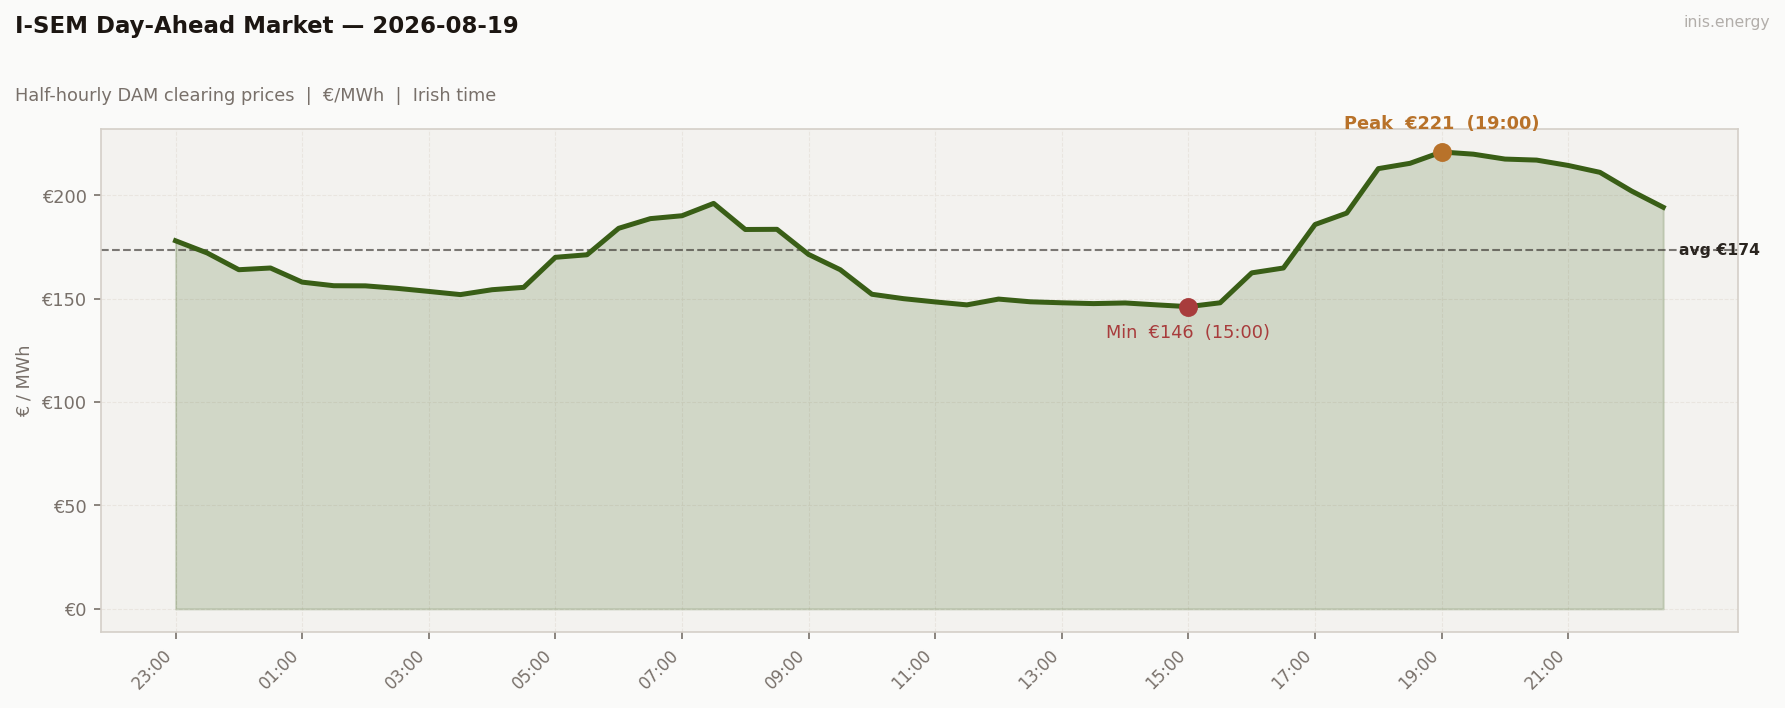
Std dev €24.62/MWh · Median €164.83/MWh · Periods above €150: 37 of 48 (77%)
Price vs Wind #
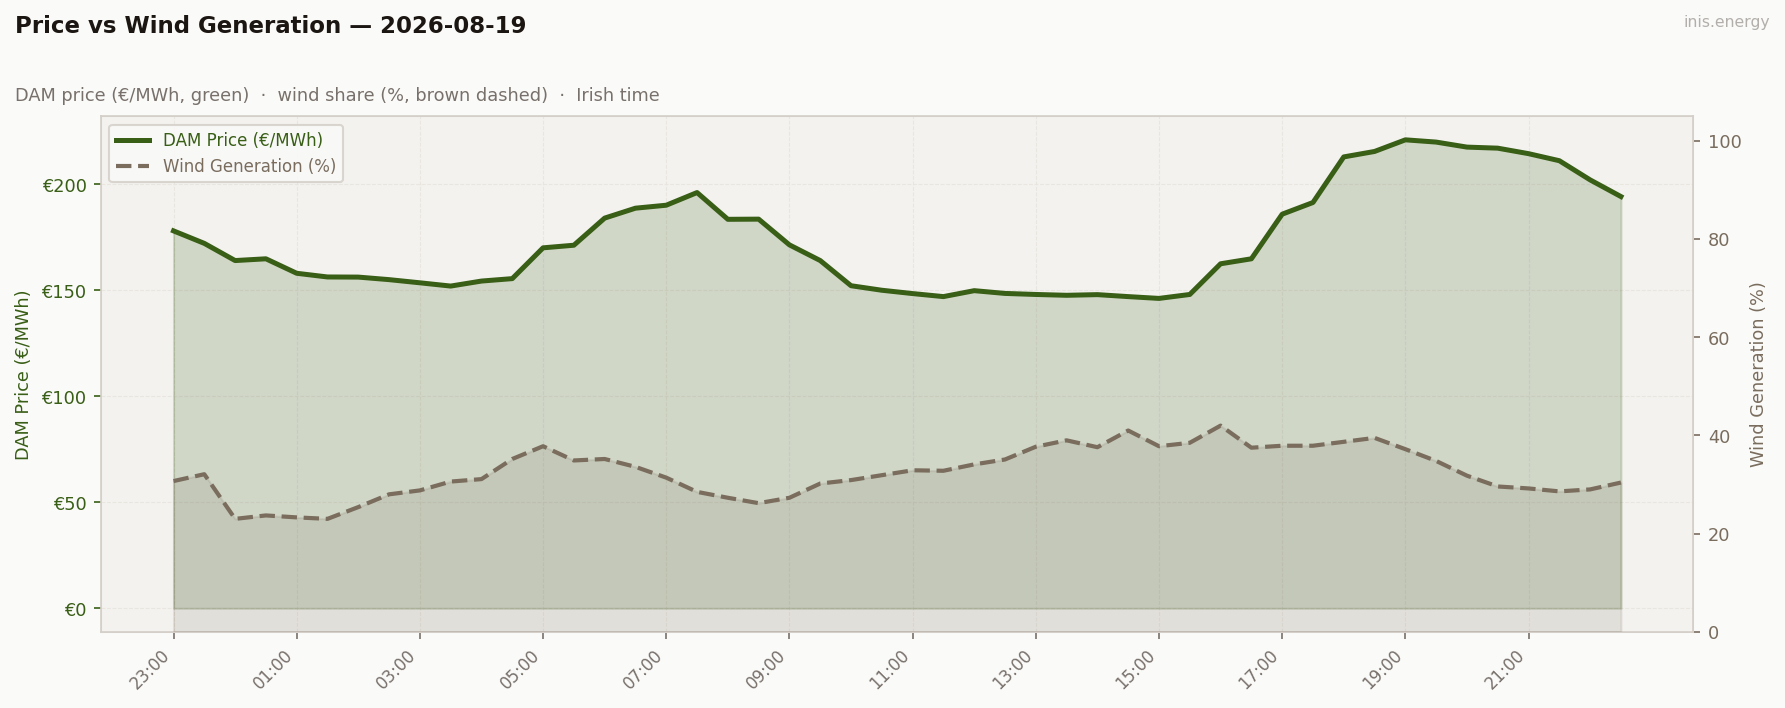
Mean wind: 32.5% · Range: 23.0%–42.0%
Week in Context #
Price Duration Curve #
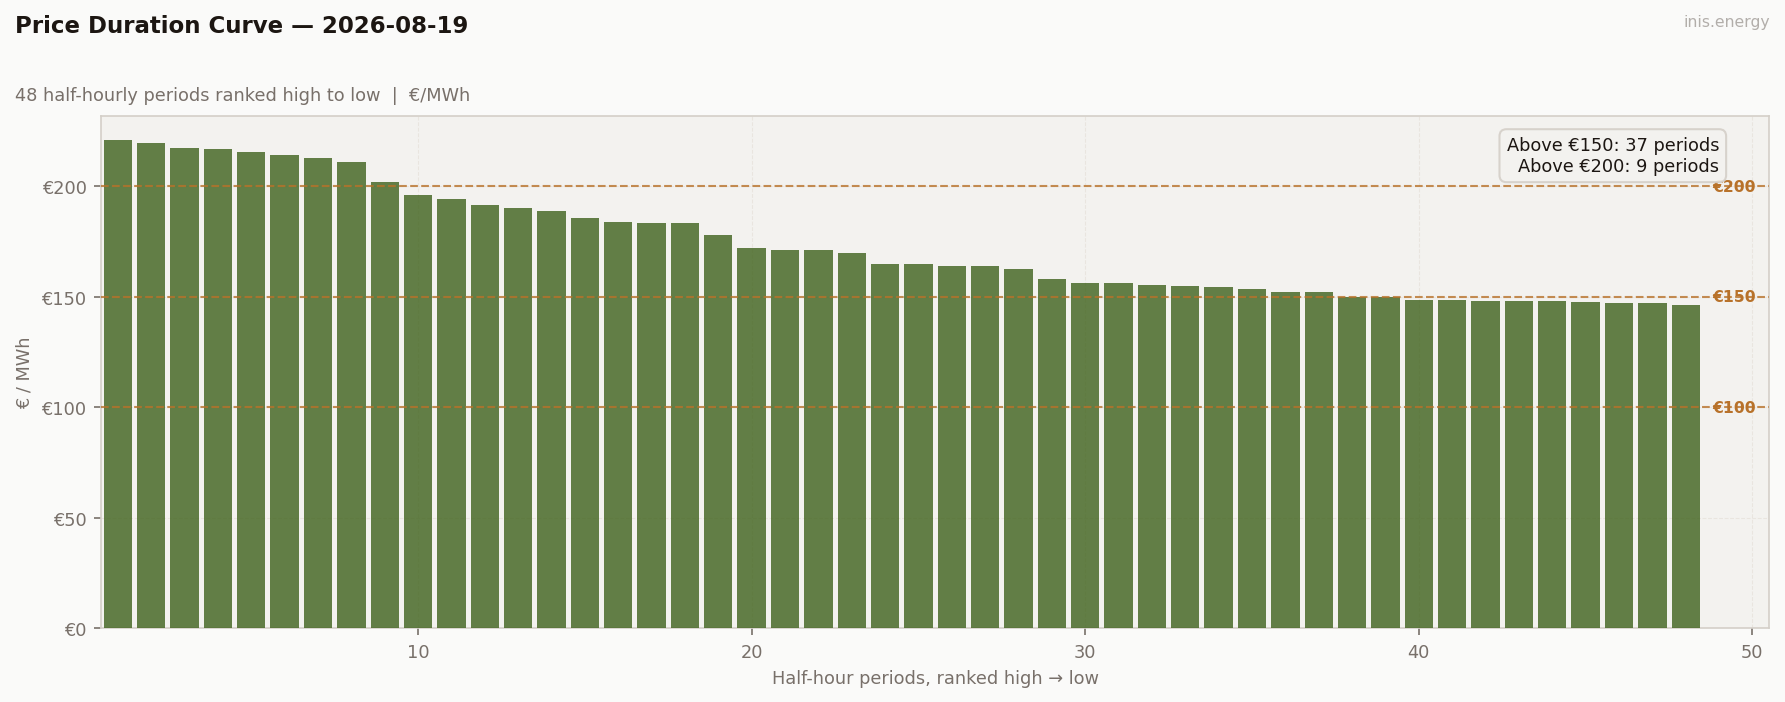
Periods above €150: 37 (77% of day) · Above €200: 9 (19% of day)
Peak / Off-Peak Spread #
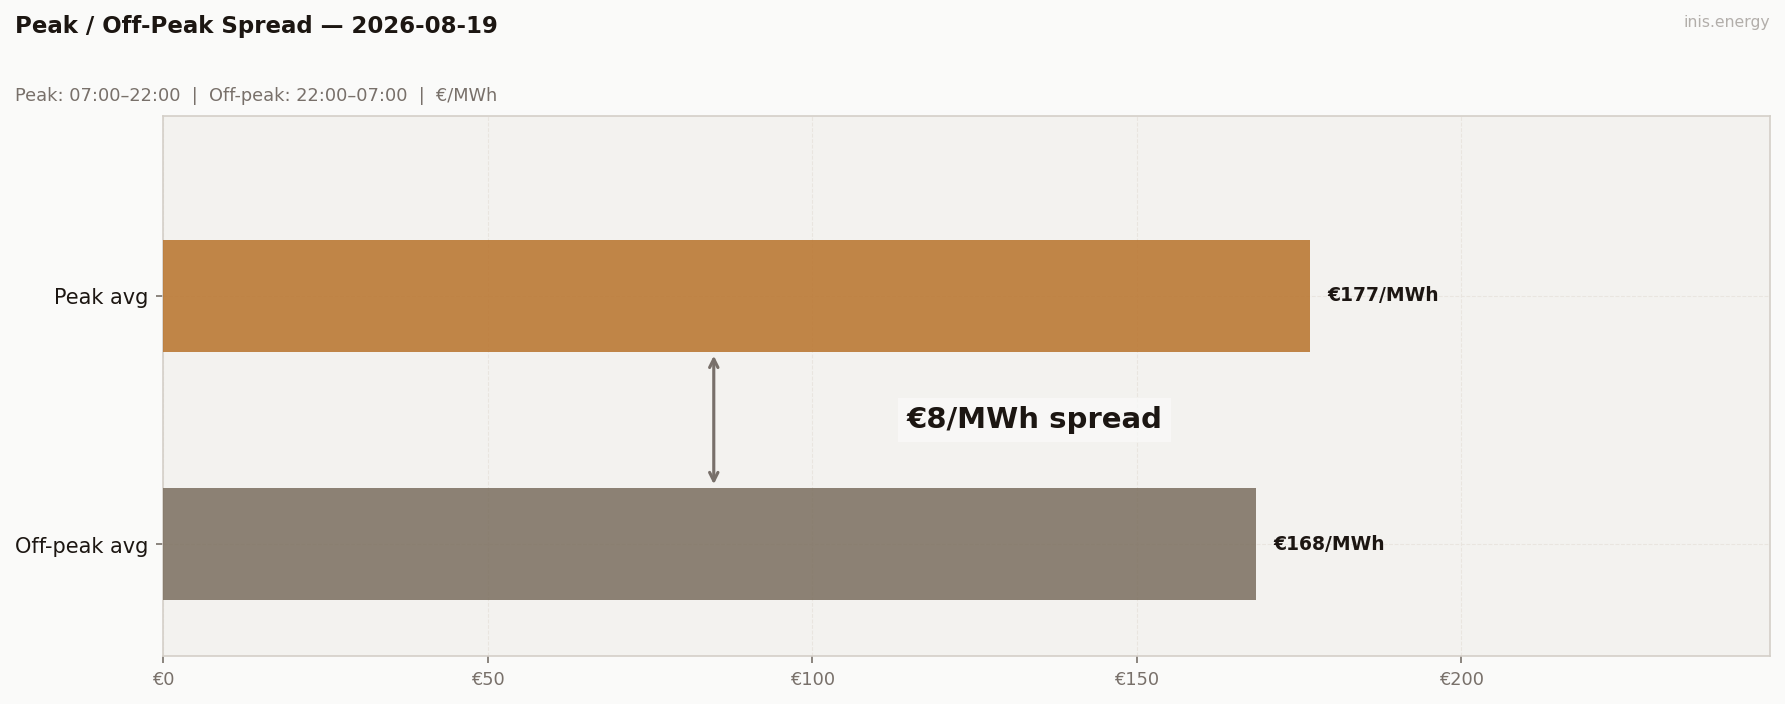
Peak avg (07:00–22:00): €176.76/MWh · Off-peak avg: €168.32/MWh · Spread: €8.44/MWh
BESS Dispatch Signal #
| Price | Time | Energy | Value | |
|---|---|---|---|---|
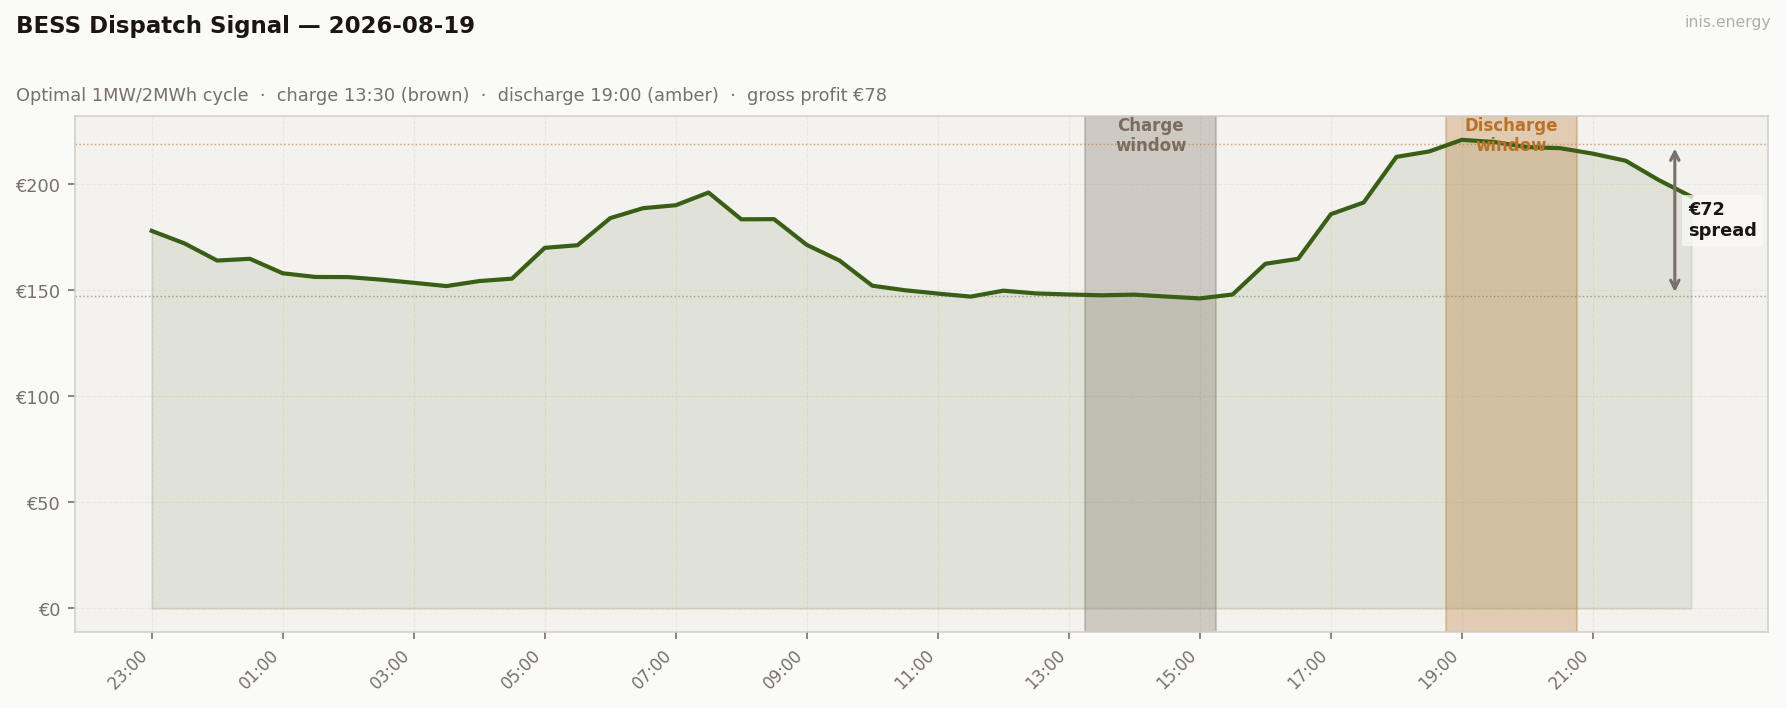
| Charge | €147/MWh | 13:30 | 2 MWh | −€294 |
| Discharge | €219/MWh | 19:00 | 1.7 MWh (85% RTE) | +€372 |
| Gross profit | €78 | |||
| Price spread | €72/MWh | ROI: 26.4% |
Simulated 1MW/2MWh battery, one optimal DAM cycle. Gross before network charges and capacity costs.
Commentary #
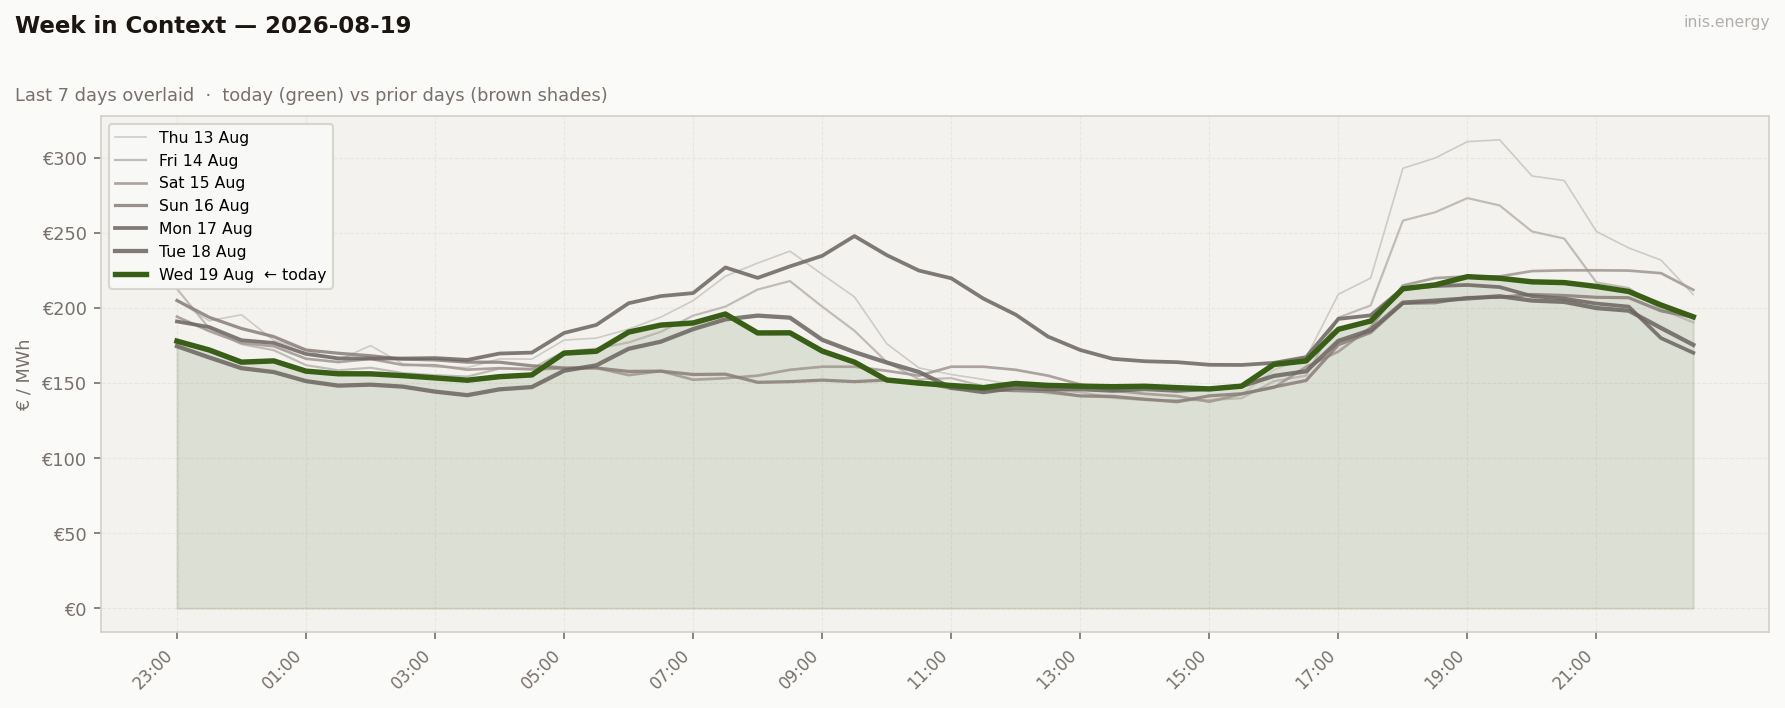
Wednesday held wind high for a second straight day — 32.5% (23.0–42.0%) — and the week’s now-familiar flat, moderate profile continued: mean €173.6, std dev €24.62, only 19% of periods above €200. The peak/off-peak spread returned to normal, small and positive at €8.44, undoing Sunday’s inversion now that weekday demand was back: evening peak-hour demand only needed to nudge above overnight levels, not fight through near-zero wind, to hold the usual shape.
Storage charged the 13:30 €147 trough and discharged the 19:00 €219 evening peak for €78 gross, 26.4% ROI — right in line with the back half of the week. High wind has been the whole story since Monday’s morning squeeze broke: the higher it sits, the narrower the trough-to-peak spread, the less there is for a battery to sell.
Half-hourly data — 2026-08-19
| Period | Time | Price (€/MWh) | Wind % |
|---|---|---|---|
| 1 | 23:00 | 178.00 | 30.7% |
| 2 | 23:30 | 172.10 | 32.1% |
| 3 | 00:00 | 164.00 | 23.0% |
| 4 | 00:30 | 164.83 | 23.7% |
| 5 | 01:00 | 158.00 | 23.3% |
| 6 | 01:30 | 156.26 | 23.0% |
| 7 | 02:00 | 156.20 | 25.4% |
| 8 | 02:30 | 155.00 | 28.0% |
| 9 | 03:00 | 153.51 | 28.8% |
| 10 | 03:30 | 151.97 | 30.6% |
| 11 | 04:00 | 154.33 | 31.1% |
| 12 | 04:30 | 155.48 | 35.2% |
| 13 | 05:00 | 170.00 | 37.8% |
| 14 | 05:30 | 171.23 | 34.9% |
| 15 | 06:00 | 184.02 | 35.2% |
| 16 | 06:30 | 188.70 | 33.6% |
| 17 | 07:00 | 190.10 | 31.4% |
| 18 | 07:30 | 196.07 | 28.5% |
| 19 | 08:00 | 183.45 | 27.3% |
| 20 | 08:30 | 183.53 | 26.2% |
| 21 | 09:00 | 171.39 | 27.3% |
| 22 | 09:30 | 164.00 | 30.2% |
| 23 | 10:00 | 152.13 | 30.9% |
| 24 | 10:30 | 150.00 | 31.9% |
| 25 | 11:00 | 148.43 | 32.9% |
| 26 | 11:30 | 147.00 | 32.8% |
| 27 | 12:00 | 149.80 | 34.1% |
| 28 | 12:30 | 148.50 | 35.1% |
| 29 | 13:00 | 148.01 | 37.7% |
| 30 | 13:30 | 147.62 | 39.0% |
| 31 | 14:00 | 147.93 | 37.6% |
| 32 | 14:30 | 147.00 | 41.0% |
| 33 | 15:00 | 146.15 | 37.8% |
| 34 | 15:30 | 148.01 | 38.5% |
| 35 | 16:00 | 162.48 | 42.0% |
| 36 | 16:30 | 164.83 | 37.5% |
| 37 | 17:00 | 185.87 | 37.9% |
| 38 | 17:30 | 191.38 | 37.9% |
| 39 | 18:00 | 212.88 | 38.7% |
| 40 | 18:30 | 215.45 | 39.5% |
| 41 | 19:00 | 220.93 | 37.2% |
| 42 | 19:30 | 219.87 | 34.8% |
| 43 | 20:00 | 217.50 | 31.8% |
| 44 | 20:30 | 217.00 | 29.6% |
| 45 | 21:00 | 214.41 | 29.2% |
| 46 | 21:30 | 211.08 | 28.6% |
| 47 | 22:00 | 202.04 | 29.0% |
| 48 | 22:30 | 194.18 | 30.4% |
Compare your business electricity and gas rates in minutes with INIS Energy Brokers.
Compare rates