I-SEM Daily Briefing — 20 August 2026
Table of Contents
Market Snapshot
| Metric | Value |
|---|---|
| Mean DAM Price | €167.95/MWh |
| Median Price | €164.58/MWh |
| Std Dev | €21.59/MWh |
| Peak Price | €203.17/MWh (20:30) |
| Min Price | €140.56/MWh (15:00) |
| Price Range | €62.61/MWh |
| Periods above €150 | 35 of 48 (73%) |
| Periods above €200 | 4 of 48 (8%) |
| Peak Avg (07–22) | €167.13/MWh |
| Off-peak Avg (22–07) | €169.31/MWh |
| Peak/Off-Peak Spread | €-2.18/MWh |
Price Profile #
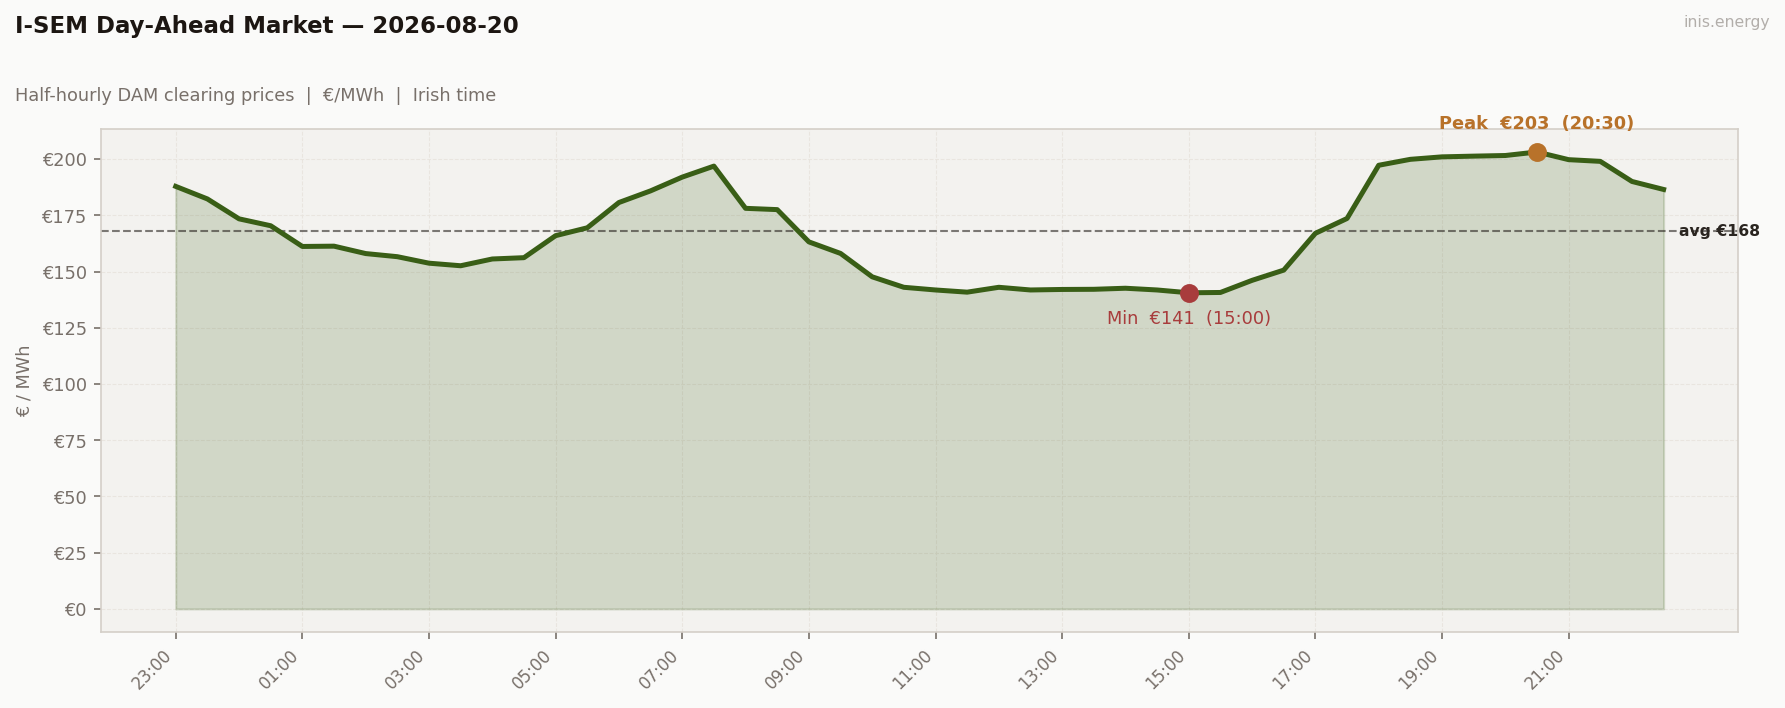
Std dev €21.59/MWh · Median €164.58/MWh · Periods above €150: 35 of 48 (73%)
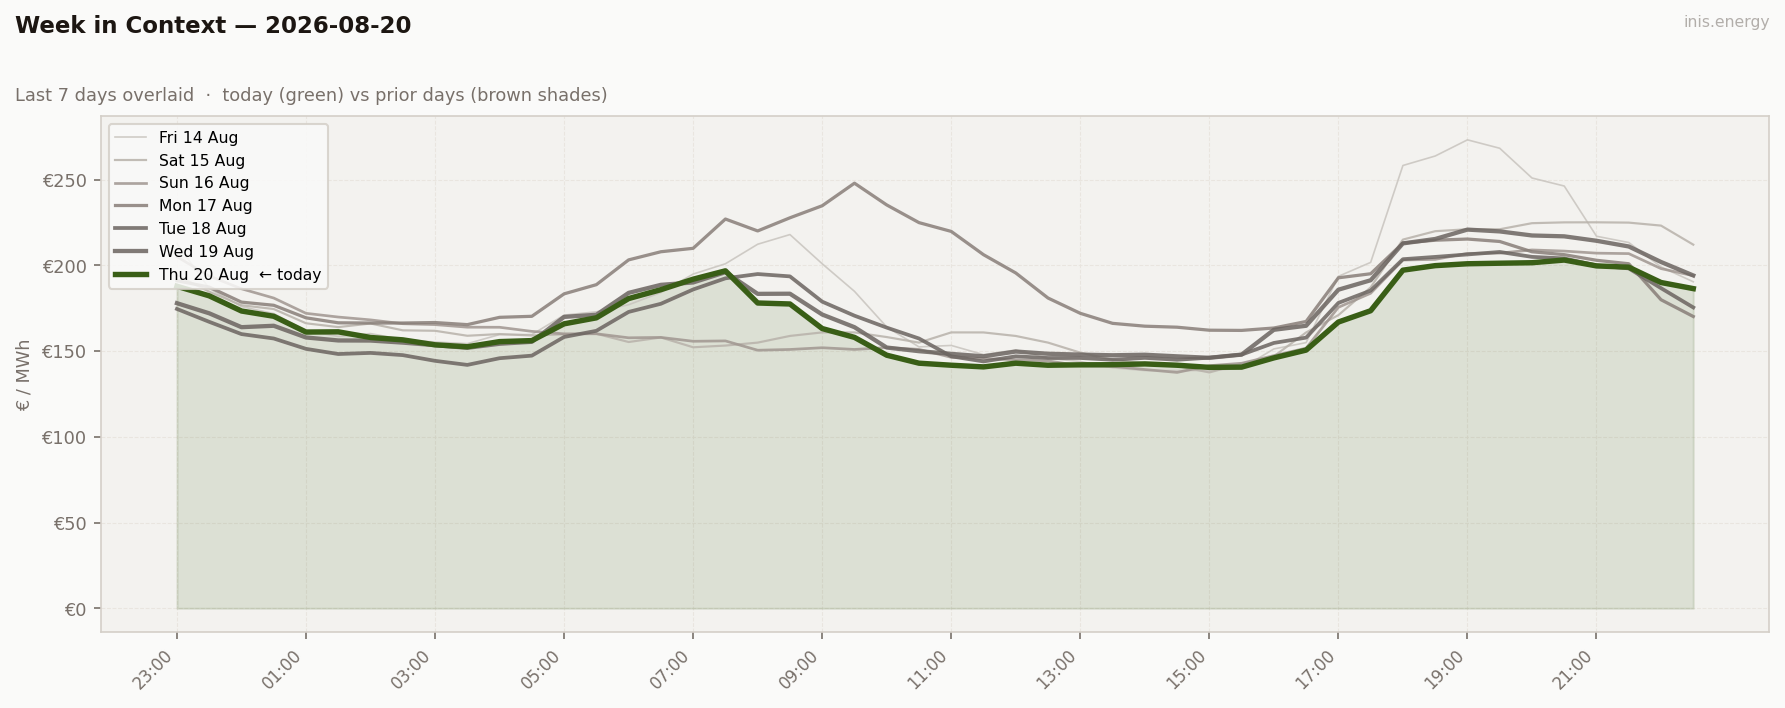
Week in Context #
Price Duration Curve #
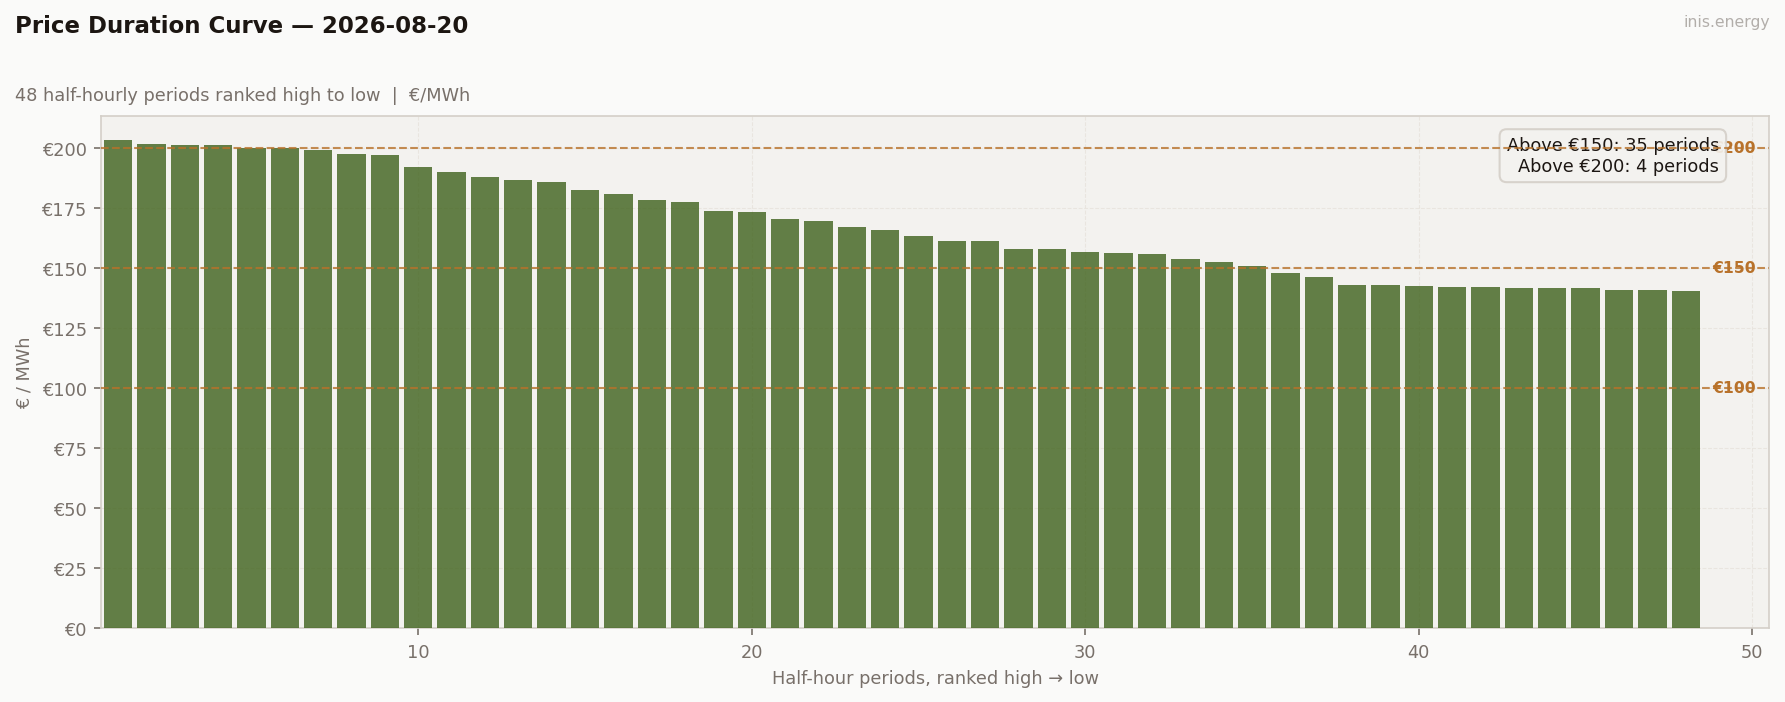
Periods above €150: 35 (73% of day) · Above €200: 4 (8% of day)
Peak / Off-Peak Spread #
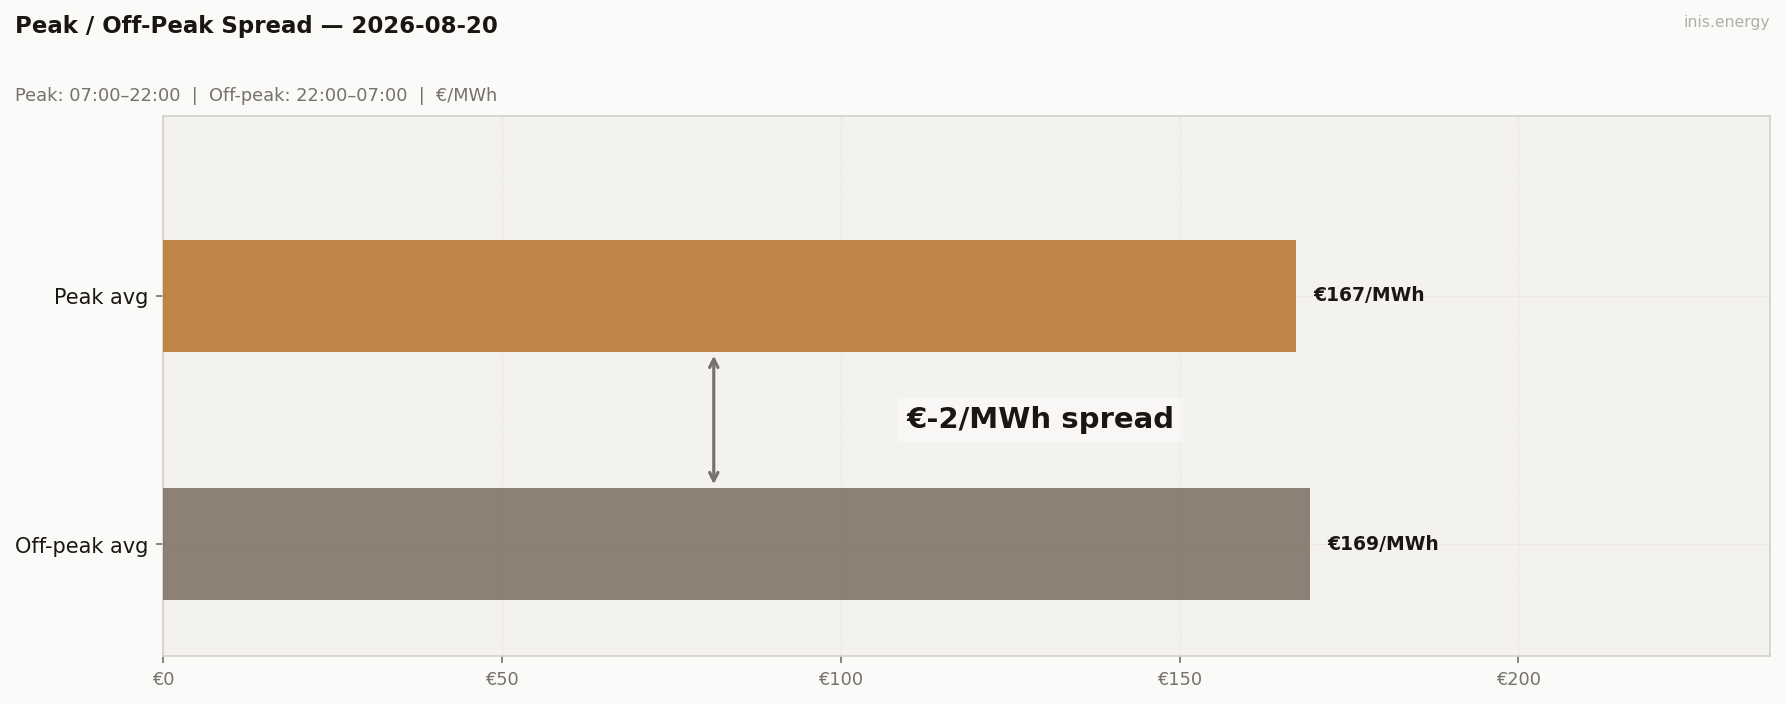
Peak avg (07:00–22:00): €167.13/MWh · Off-peak avg: €169.31/MWh · Spread: €-2.18/MWh
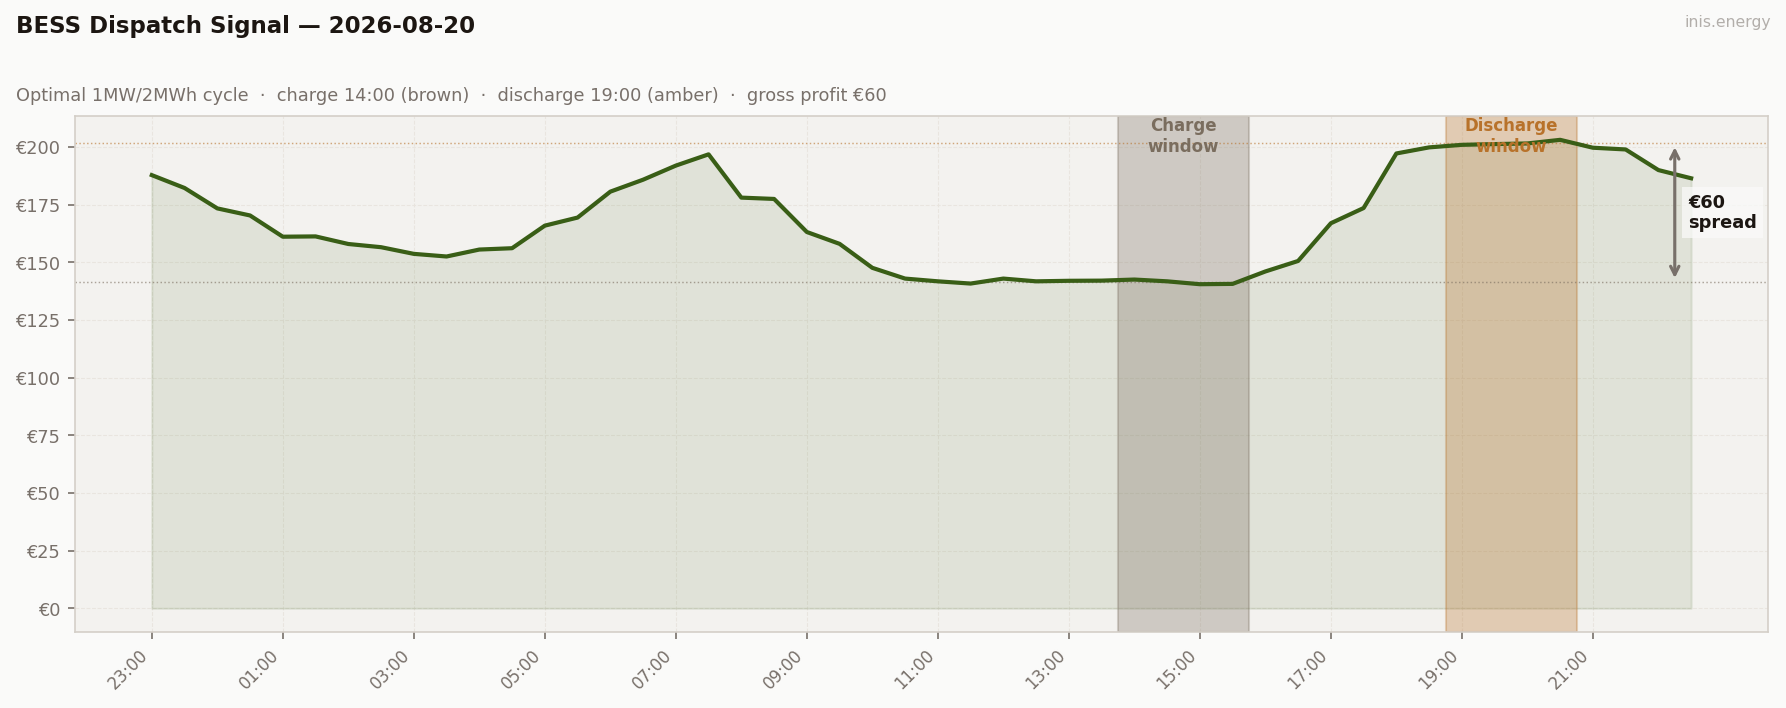
BESS Dispatch Signal #
| Price | Time | Energy | Value | |
|---|---|---|---|---|
| Charge | €141/MWh | 14:00 | 2 MWh | −€283 |
| Discharge | €202/MWh | 19:00 | 1.7 MWh (85% RTE) | +€343 |
| Gross profit | €60 | |||
| Price spread | €60/MWh | ROI: 21.3% |
Simulated 1MW/2MWh battery, one optimal DAM cycle. Gross before network charges and capacity costs.
Commentary #
Thursday traced the usual midday-dip, evening-climb shape — down to a €140.56 floor at 15:00, up to €203.17 by 20:30 — but the wind feed didn’t come through today, so this one’s price-only. What we do have is wind in raw MW: it held above 1,400MW for most of the morning and only fell away after 19:00, right as the evening price started climbing, which is at least a plausible driver even without demand to turn it into a clean percentage. The odd number of the day was a slightly negative peak/off-peak spread (€-2.18) — overnight hours stayed elevated enough (€187.87 at 23:00, still €173 by midnight) to outweigh the midday trough within the 07:00–22:00 window, so “peak” hours actually averaged a touch below “off-peak.”
Storage read the shape correctly: charged into the 14:00 trough at €141, discharged at 19:00 for €202 — a little ahead of the actual 20:30 high, so it left something on the table, but still banked €60 gross for 21.3% ROI, solidly mid-pack.
Half-hourly data — 2026-08-20
| Period | Time | Price (€/MWh) |
|---|---|---|
| 1 | 23:00 | 187.87 |
| 2 | 23:30 | 182.29 |
| 3 | 00:00 | 173.44 |
| 4 | 00:30 | 170.37 |
| 5 | 01:00 | 161.16 |
| 6 | 01:30 | 161.29 |
| 7 | 02:00 | 158.00 |
| 8 | 02:30 | 156.61 |
| 9 | 03:00 | 153.72 |
| 10 | 03:30 | 152.58 |
| 11 | 04:00 | 155.59 |
| 12 | 04:30 | 156.17 |
| 13 | 05:00 | 165.96 |
| 14 | 05:30 | 169.46 |
| 15 | 06:00 | 180.70 |
| 16 | 06:30 | 185.88 |
| 17 | 07:00 | 192.00 |
| 18 | 07:30 | 196.88 |
| 19 | 08:00 | 178.11 |
| 20 | 08:30 | 177.54 |
| 21 | 09:00 | 163.20 |
| 22 | 09:30 | 158.06 |
| 23 | 10:00 | 147.66 |
| 24 | 10:30 | 143.00 |
| 25 | 11:00 | 141.81 |
| 26 | 11:30 | 140.84 |
| 27 | 12:00 | 143.00 |
| 28 | 12:30 | 141.81 |
| 29 | 13:00 | 142.04 |
| 30 | 13:30 | 142.11 |
| 31 | 14:00 | 142.58 |
| 32 | 14:30 | 141.81 |
| 33 | 15:00 | 140.56 |
| 34 | 15:30 | 140.70 |
| 35 | 16:00 | 146.09 |
| 36 | 16:30 | 150.64 |
| 37 | 17:00 | 167.00 |
| 38 | 17:30 | 173.60 |
| 39 | 18:00 | 197.26 |
| 40 | 18:30 | 199.90 |
| 41 | 19:00 | 201.00 |
| 42 | 19:30 | 201.32 |
| 43 | 20:00 | 201.60 |
| 44 | 20:30 | 203.17 |
| 45 | 21:00 | 199.75 |
| 46 | 21:30 | 199.00 |
| 47 | 22:00 | 190.06 |
| 48 | 22:30 | 186.50 |
Compare your business electricity and gas rates in minutes with INIS Energy Brokers.
Compare rates