I-SEM Daily Briefing — 24 August 2026
Table of Contents
Market Snapshot
| Metric | Value |
|---|---|
| Mean DAM Price | €190.38/MWh |
| Median Price | €177.78/MWh |
| Std Dev | €34.58/MWh |
| Peak Price | €247.27/MWh (20:00) |
| Min Price | €146.31/MWh (14:00) |
| Price Range | €100.96/MWh |
| Periods above €150 | 43 of 48 (90%) |
| Periods above €200 | 19 of 48 (40%) |
| Peak Avg (07–22) | €195.9/MWh |
| Off-peak Avg (22–07) | €181.2/MWh |
| Peak/Off-Peak Spread | €14.7/MWh |
| Cheap/Dear Spread | €147.04/MWh → €243.99/MWh (€96.95) |
| Wind % of Demand | 12.6% |
| Wind Range | 7.0%–21.1% |
| Mean Demand | 3777 MW |
Price Profile #
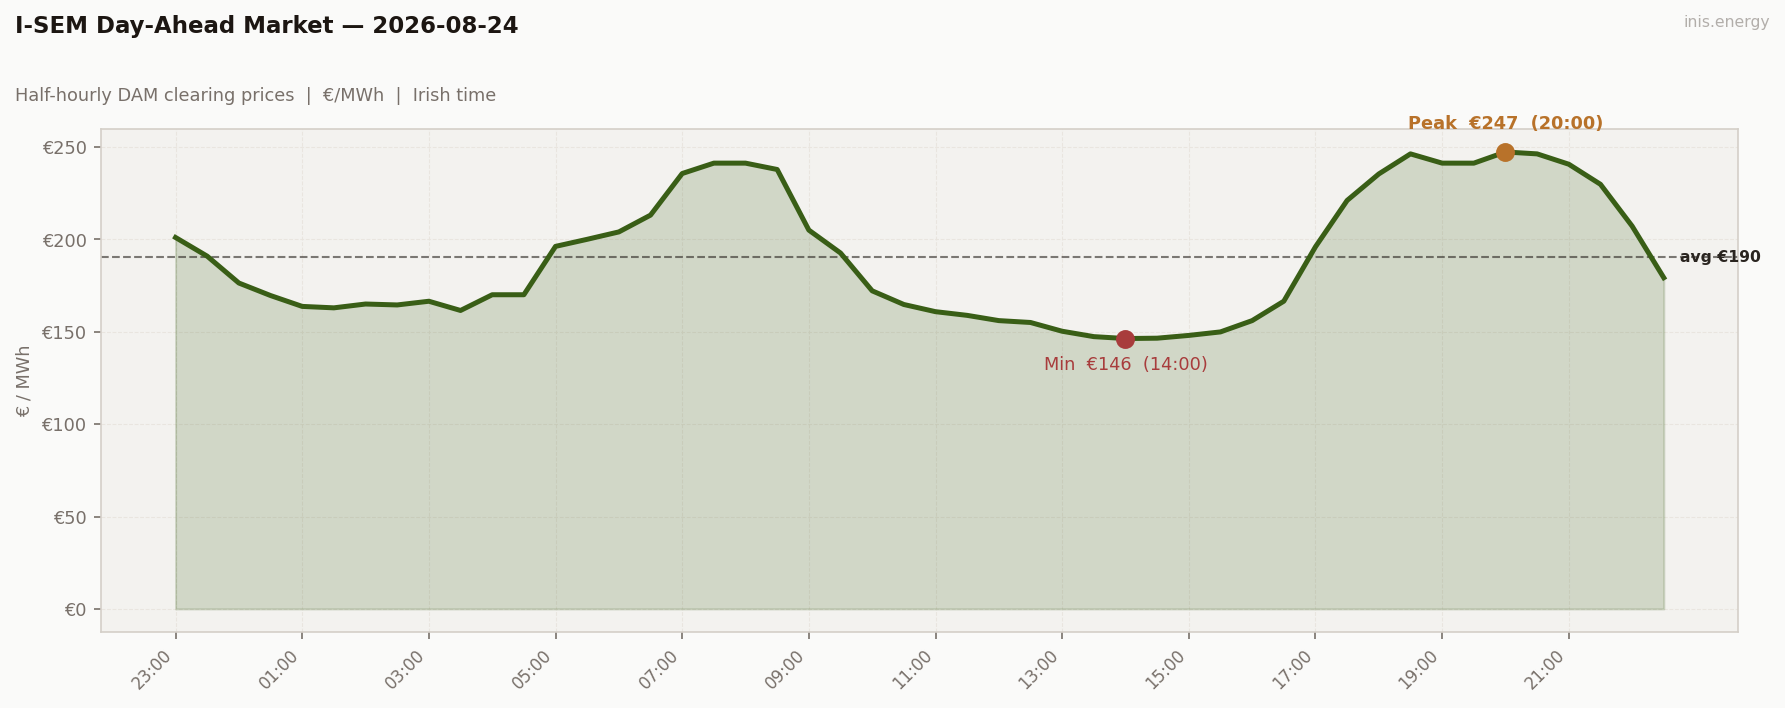
Std dev €34.58/MWh · Median €177.78/MWh · Periods above €150: 43 of 48 (90%)
Price vs Wind #
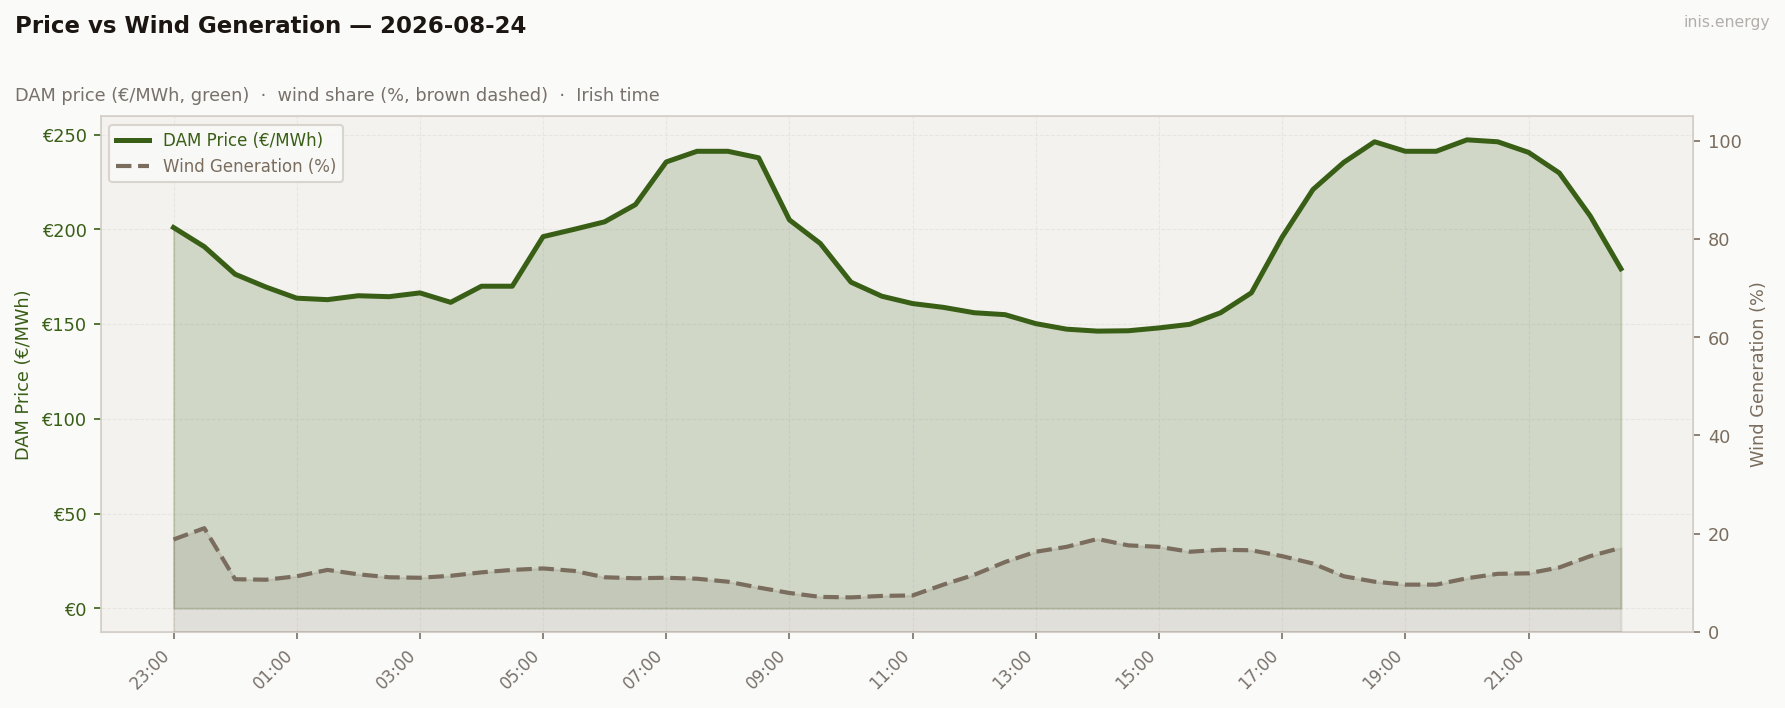
Mean wind: 12.6% · Range: 7.0%–21.1%
Week in Context #
Price Duration Curve #
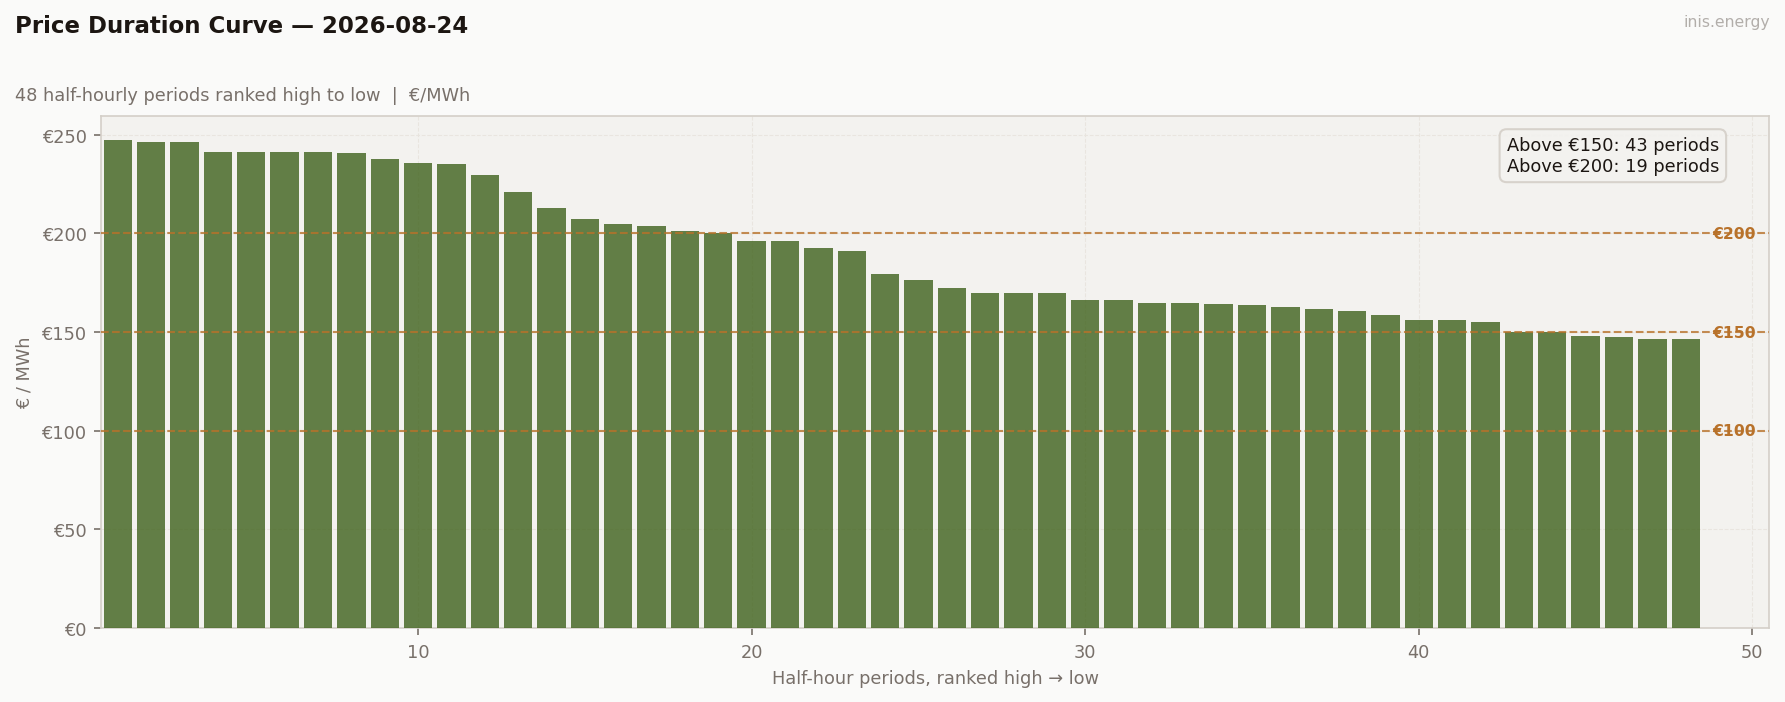
Periods above €150: 43 (90% of day) · Above €200: 19 (40% of day)
Peak / Off-Peak Spread #
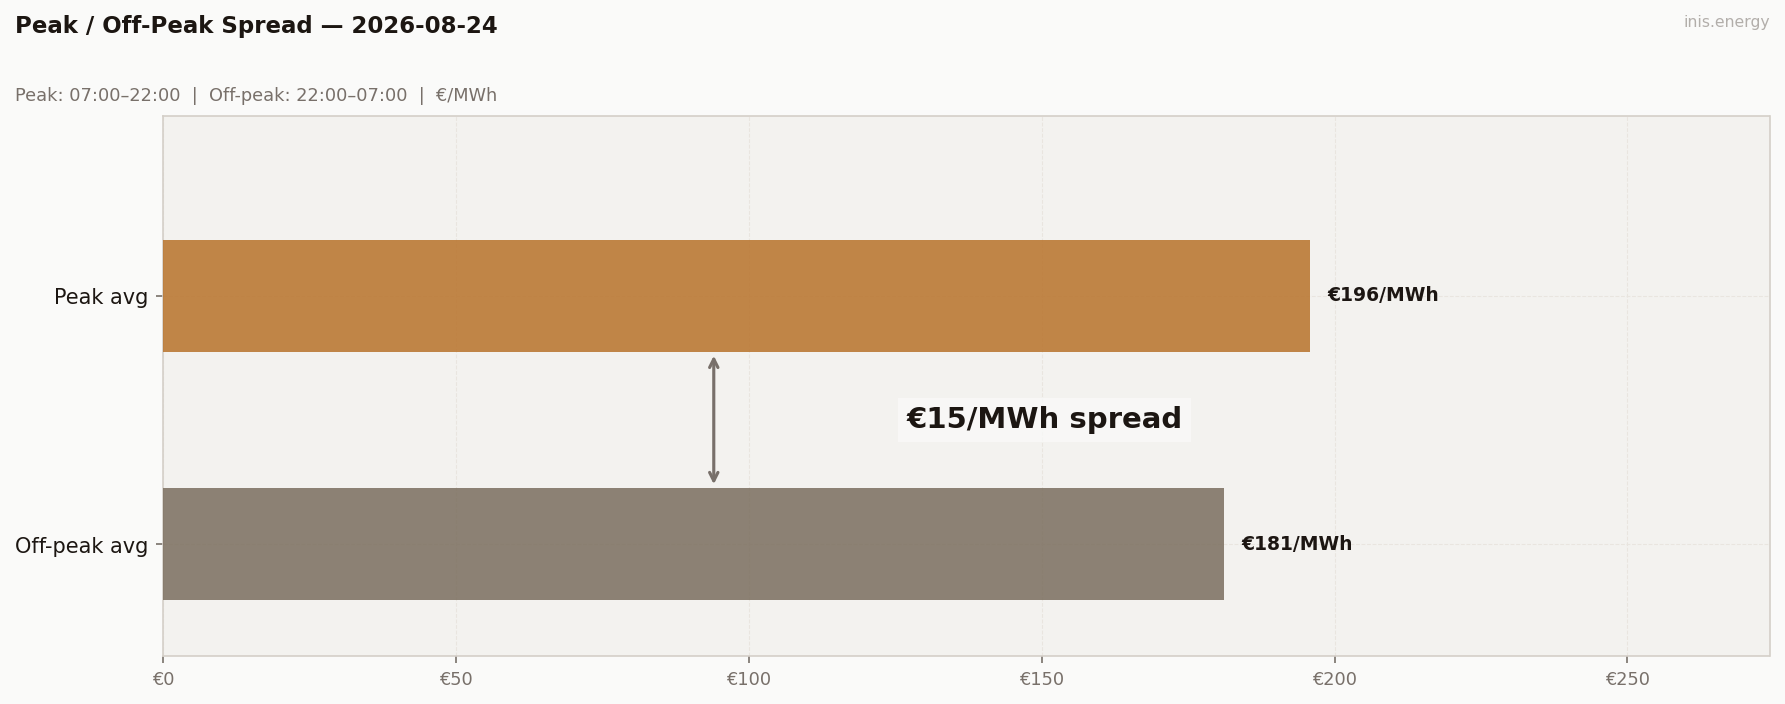
Peak avg (07:00–22:00): €195.9/MWh · Off-peak avg: €181.2/MWh · Spread: €14.7/MWh
Cheap window: €147.04/MWh · Dear window: €243.99/MWh · Spread: €96.95/MWh — the actual cheapest and dearest 2-hour blocks of the day, wherever they fall on the clock
Commentary #
Two peaks, not one. Wind idled around 10-13% through the morning ramp and the market still pushed to €241.23 by 08:00 — that one’s on demand, not wind. It rebuilt into the high teens by early afternoon and pulled the day down to its low, €146.31 at 14:00. Then it faded hard again, bottoming at 10.2% right as the evening ramp hit, and that’s where the real peak landed: €247.27 at 20:00.
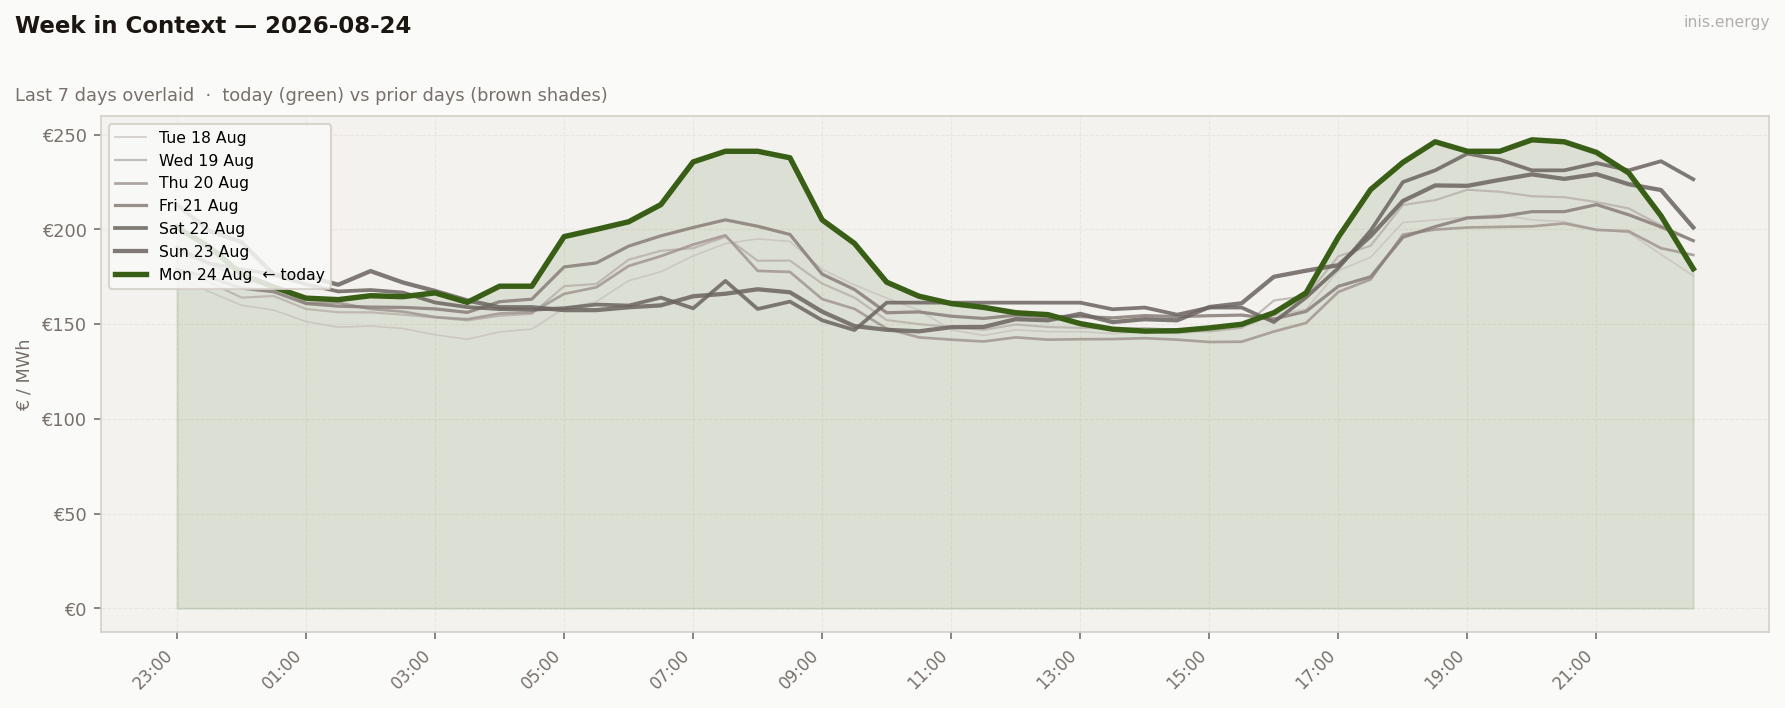
Mean cleared at €190.38, std dev €34.58 — two distinct shoulders rather than one clean shape. Peak/off-peak spread was a modest €14.7, but the cheap/dear window (€96.95) shows where the actual volatility sat: the afternoon wind fade, not the morning ramp. That’s the pattern the rest of the week would run with — some midday relief from wind, then an afternoon fade turning the evening ramp into the real event.
Half-hourly data — 2026-08-24
| Period | Time | Price (€/MWh) | Wind % |
|---|---|---|---|
| 1 | 23:00 | 201.00 | 18.8% |
| 2 | 23:30 | 190.87 | 21.1% |
| 3 | 00:00 | 176.35 | 10.7% |
| 4 | 00:30 | 169.58 | 10.6% |
| 5 | 01:00 | 163.70 | 11.3% |
| 6 | 01:30 | 162.92 | 12.6% |
| 7 | 02:00 | 164.99 | 11.7% |
| 8 | 02:30 | 164.49 | 11.1% |
| 9 | 03:00 | 166.49 | 11.0% |
| 10 | 03:30 | 161.50 | 11.4% |
| 11 | 04:00 | 170.01 | 12.1% |
| 12 | 04:30 | 170.01 | 12.6% |
| 13 | 05:00 | 196.18 | 12.9% |
| 14 | 05:30 | 200.01 | 12.4% |
| 15 | 06:00 | 204.01 | 11.1% |
| 16 | 06:30 | 213.10 | 10.9% |
| 17 | 07:00 | 235.61 | 11.0% |
| 18 | 07:30 | 241.23 | 10.8% |
| 19 | 08:00 | 241.23 | 10.2% |
| 20 | 08:30 | 237.79 | 9.0% |
| 21 | 09:00 | 205.00 | 7.9% |
| 22 | 09:30 | 192.60 | 7.1% |
| 23 | 10:00 | 172.13 | 7.0% |
| 24 | 10:30 | 164.73 | 7.3% |
| 25 | 11:00 | 160.85 | 7.4% |
| 26 | 11:30 | 158.85 | 9.6% |
| 27 | 12:00 | 156.01 | 11.6% |
| 28 | 12:30 | 155.00 | 14.2% |
| 29 | 13:00 | 150.26 | 16.3% |
| 30 | 13:30 | 147.34 | 17.3% |
| 31 | 14:00 | 146.31 | 18.9% |
| 32 | 14:30 | 146.50 | 17.6% |
| 33 | 15:00 | 148.00 | 17.3% |
| 34 | 15:30 | 149.90 | 16.3% |
| 35 | 16:00 | 156.01 | 16.7% |
| 36 | 16:30 | 166.52 | 16.6% |
| 37 | 17:00 | 195.97 | 15.4% |
| 38 | 17:30 | 221.05 | 13.9% |
| 39 | 18:00 | 235.38 | 11.3% |
| 40 | 18:30 | 246.24 | 10.2% |
| 41 | 19:00 | 241.23 | 9.6% |
| 42 | 19:30 | 241.22 | 9.6% |
| 43 | 20:00 | 247.27 | 10.9% |
| 44 | 20:30 | 246.24 | 11.8% |
| 45 | 21:00 | 240.64 | 11.9% |
| 46 | 21:30 | 229.77 | 13.1% |
| 47 | 22:00 | 207.15 | 15.4% |
| 48 | 22:30 | 179.22 | 17.1% |
Compare your business electricity and gas rates in minutes with INIS Energy Brokers.
Compare rates