I-SEM Daily Briefing — 25 August 2026
Table of Contents
Market Snapshot
| Metric | Value |
|---|---|
| Mean DAM Price | €178.7/MWh |
| Median Price | €169.5/MWh |
| Std Dev | €30.42/MWh |
| Peak Price | €237.84/MWh (18:30) |
| Min Price | €145.76/MWh (12:00) |
| Price Range | €92.08/MWh |
| Periods above €150 | 39 of 48 (81%) |
| Periods above €200 | 11 of 48 (23%) |
| Peak Avg (07–22) | €185.85/MWh |
| Off-peak Avg (22–07) | €166.78/MWh |
| Peak/Off-Peak Spread | €19.07/MWh |
| Cheap/Dear Spread | €145.76/MWh → €236.37/MWh (€90.61) |
| Wind % of Demand | 13.8% |
| Wind Range | 6.7%–22.1% |
| Mean Demand | 4029 MW |
Price Profile #
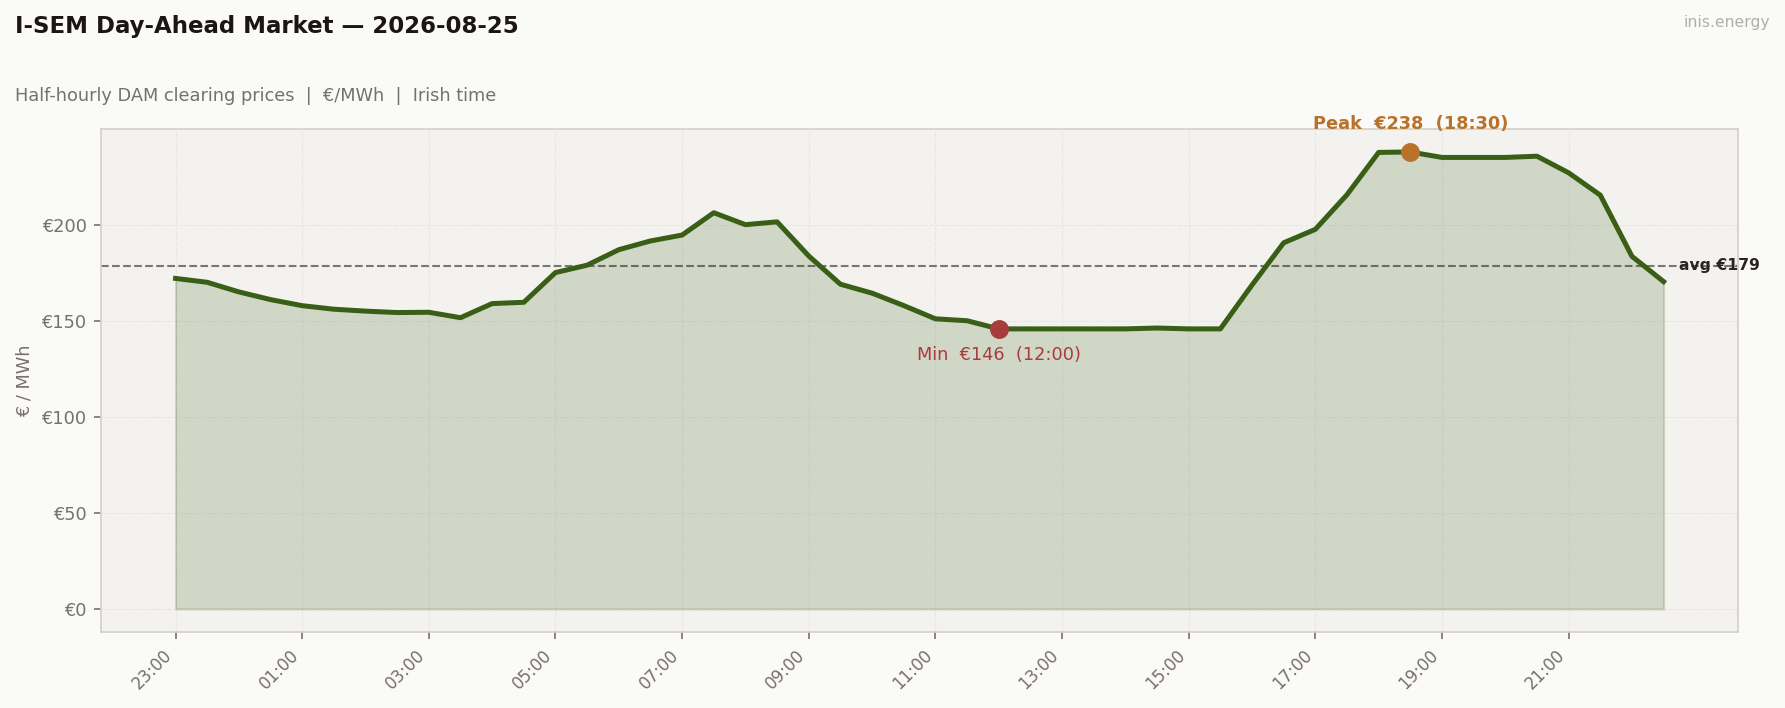
Std dev €30.42/MWh · Median €169.5/MWh · Periods above €150: 39 of 48 (81%)
Price vs Wind #
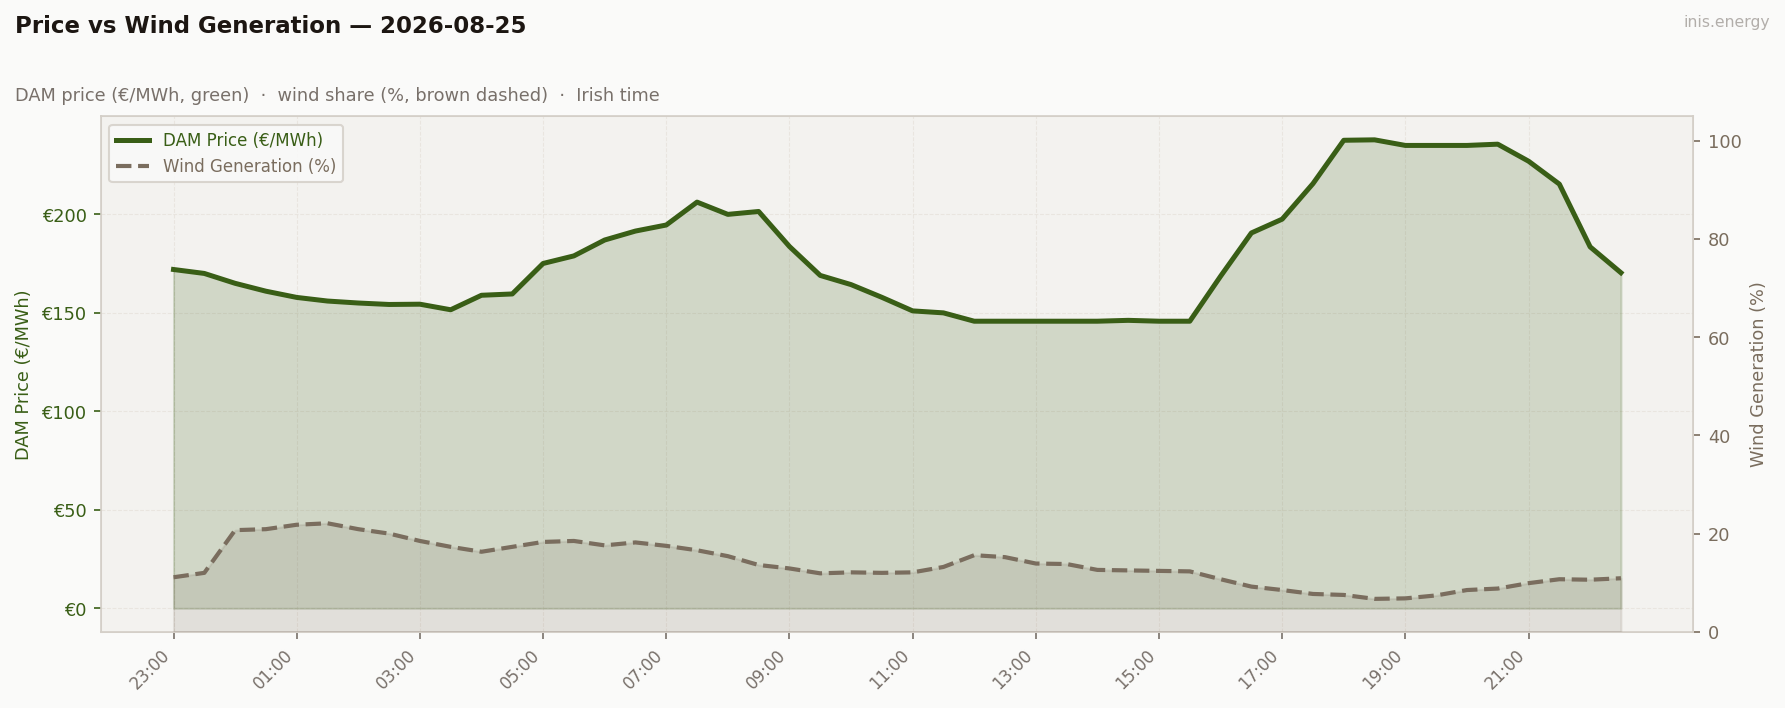
Mean wind: 13.8% · Range: 6.7%–22.1%
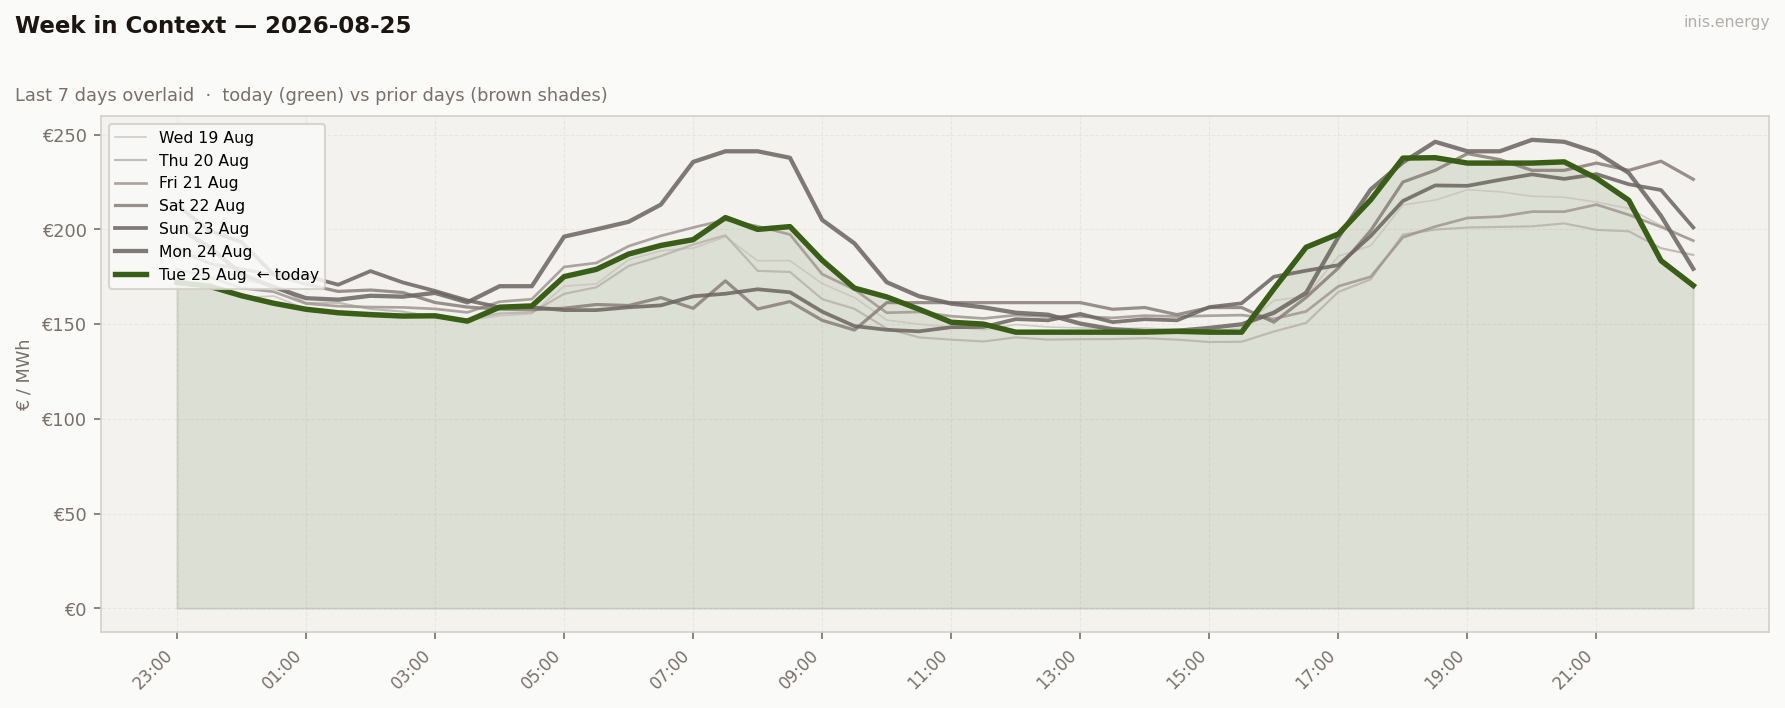
Week in Context #
Price Duration Curve #
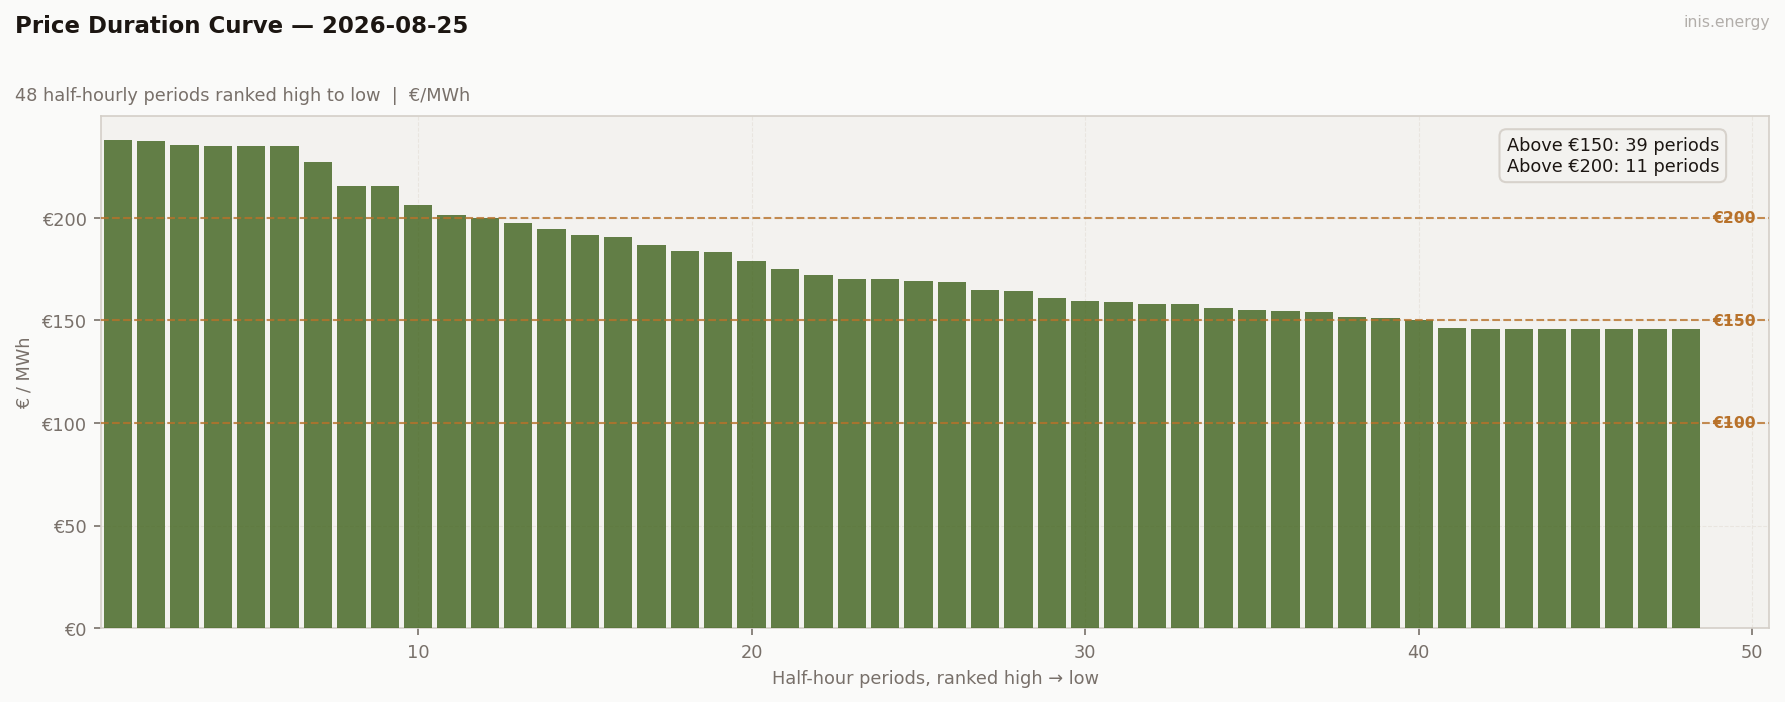
Periods above €150: 39 (81% of day) · Above €200: 11 (23% of day)
Peak / Off-Peak Spread #
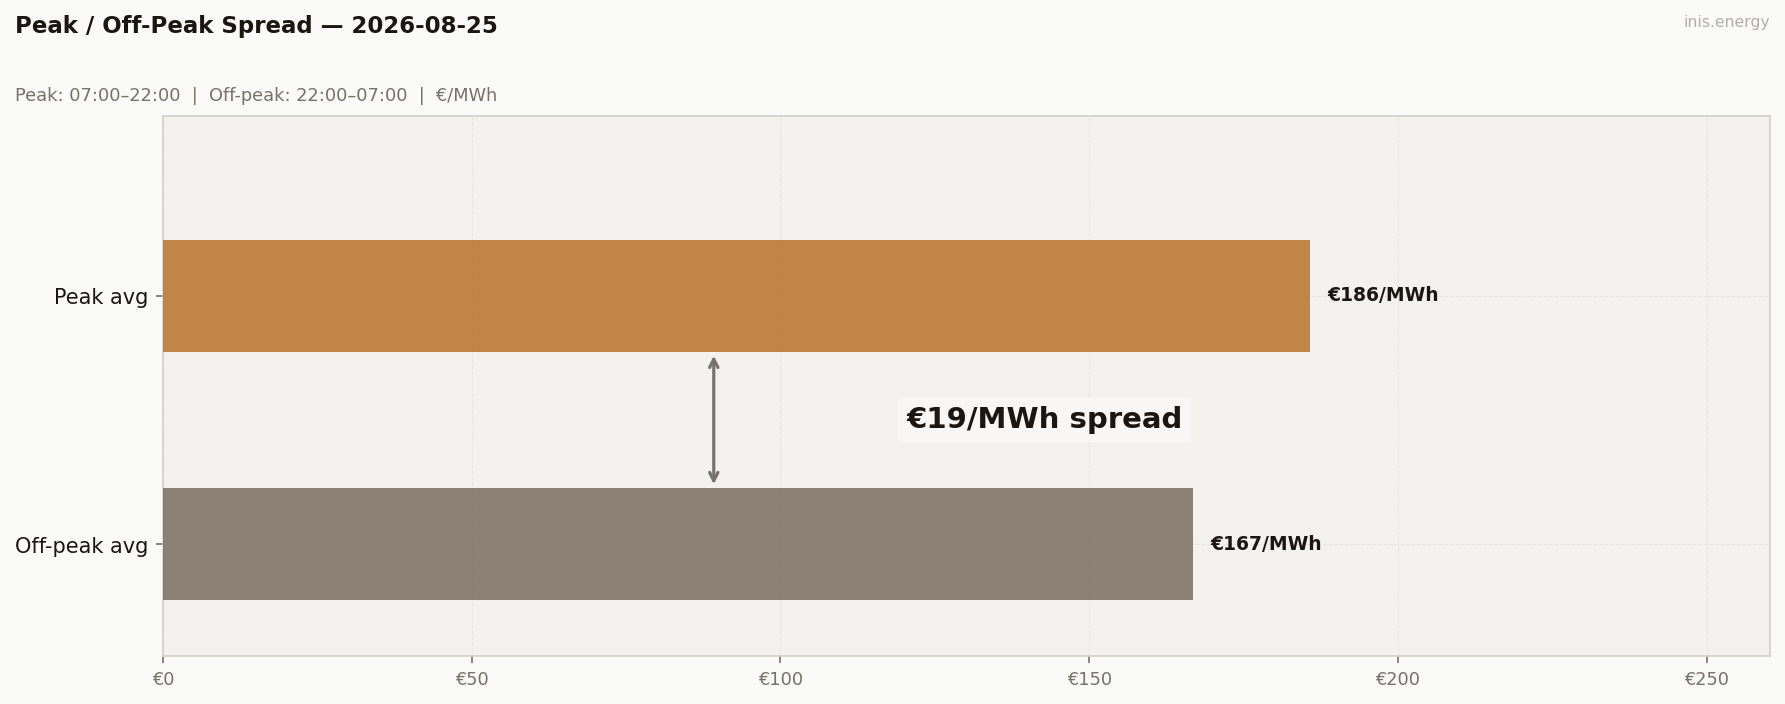
Peak avg (07:00–22:00): €185.85/MWh · Off-peak avg: €166.78/MWh · Spread: €19.07/MWh
Cheap window: €145.76/MWh · Dear window: €236.37/MWh · Spread: €90.61/MWh — the actual cheapest and dearest 2-hour blocks of the day, wherever they fall on the clock
Commentary #
Wind did the shaping today. It held in the low-20s overnight — 22.1% at 01:30 — which kept the small hours in the 150s-160s rather than letting them slide further. It rebuilt into the low teens around midday and pinned the floor dead flat: six straight half-hours locked at €145.76 from noon to 15:30, the flattest trough of the run so far. Then it fell away hard through the afternoon, bottoming at 6.7% right as the evening ramp hit, and the two effects stacked straight into the day’s peak — €237.84 at 18:30.
Mean landed at €178.70, std dev €30.42 — real shape, not noise. Peak/off-peak spread was a moderate €19.07, since overnight wind support kept the off-peak side from collapsing completely. Worth watching whether that midday floor holds tomorrow if wind doesn’t show up twice in a row.
Half-hourly data — 2026-08-25
| Period | Time | Price (€/MWh) | Wind % |
|---|---|---|---|
| 1 | 23:00 | 172.02 | 11.1% |
| 2 | 23:30 | 170.01 | 12.0% |
| 3 | 00:00 | 165.00 | 20.7% |
| 4 | 00:30 | 161.00 | 20.9% |
| 5 | 01:00 | 157.84 | 21.8% |
| 6 | 01:30 | 156.00 | 22.1% |
| 7 | 02:00 | 155.00 | 20.9% |
| 8 | 02:30 | 154.26 | 20.0% |
| 9 | 03:00 | 154.40 | 18.5% |
| 10 | 03:30 | 151.57 | 17.3% |
| 11 | 04:00 | 158.93 | 16.3% |
| 12 | 04:30 | 159.60 | 17.3% |
| 13 | 05:00 | 175.07 | 18.3% |
| 14 | 05:30 | 178.92 | 18.5% |
| 15 | 06:00 | 186.98 | 17.6% |
| 16 | 06:30 | 191.53 | 18.2% |
| 17 | 07:00 | 194.60 | 17.5% |
| 18 | 07:30 | 206.22 | 16.6% |
| 19 | 08:00 | 200.00 | 15.4% |
| 20 | 08:30 | 201.47 | 13.6% |
| 21 | 09:00 | 183.70 | 12.9% |
| 22 | 09:30 | 169.00 | 11.9% |
| 23 | 10:00 | 164.35 | 12.1% |
| 24 | 10:30 | 157.89 | 12.0% |
| 25 | 11:00 | 151.00 | 12.1% |
| 26 | 11:30 | 150.00 | 13.2% |
| 27 | 12:00 | 145.76 | 15.6% |
| 28 | 12:30 | 145.76 | 15.2% |
| 29 | 13:00 | 145.76 | 13.9% |
| 30 | 13:30 | 145.76 | 13.8% |
| 31 | 14:00 | 145.76 | 12.6% |
| 32 | 14:30 | 146.20 | 12.5% |
| 33 | 15:00 | 145.76 | 12.4% |
| 34 | 15:30 | 145.76 | 12.3% |
| 35 | 16:00 | 168.60 | 10.7% |
| 36 | 16:30 | 190.57 | 9.2% |
| 37 | 17:00 | 197.57 | 8.5% |
| 38 | 17:30 | 215.61 | 7.7% |
| 39 | 18:00 | 237.62 | 7.5% |
| 40 | 18:30 | 237.84 | 6.7% |
| 41 | 19:00 | 235.00 | 6.8% |
| 42 | 19:30 | 235.00 | 7.4% |
| 43 | 20:00 | 235.00 | 8.5% |
| 44 | 20:30 | 235.64 | 8.8% |
| 45 | 21:00 | 227.00 | 9.9% |
| 46 | 21:30 | 215.37 | 10.7% |
| 47 | 22:00 | 183.51 | 10.6% |
| 48 | 22:30 | 170.37 | 10.9% |
Compare your business electricity and gas rates in minutes with INIS Energy Brokers.
Compare rates