Weekly Analysis — 10–16 August 2026
Table of Contents
Key Takeaways #
- Price ranged from a €119.52/MWh low on Tuesday (15:00) to a €312.1/MWh peak on Thursday (19:30) — a €192.58/MWh spread across the week, averaging €172.61/MWh overall.
- Average wind for the week was 12.1% of demand — the usual inverse relationship held — Tuesday’s 20.6% wind coincided with cheaper power, while Saturday’s 4.1% wind ran the tightest.
- Mean price moved up 20.0% week-on-week.
Weekly Price Overview #
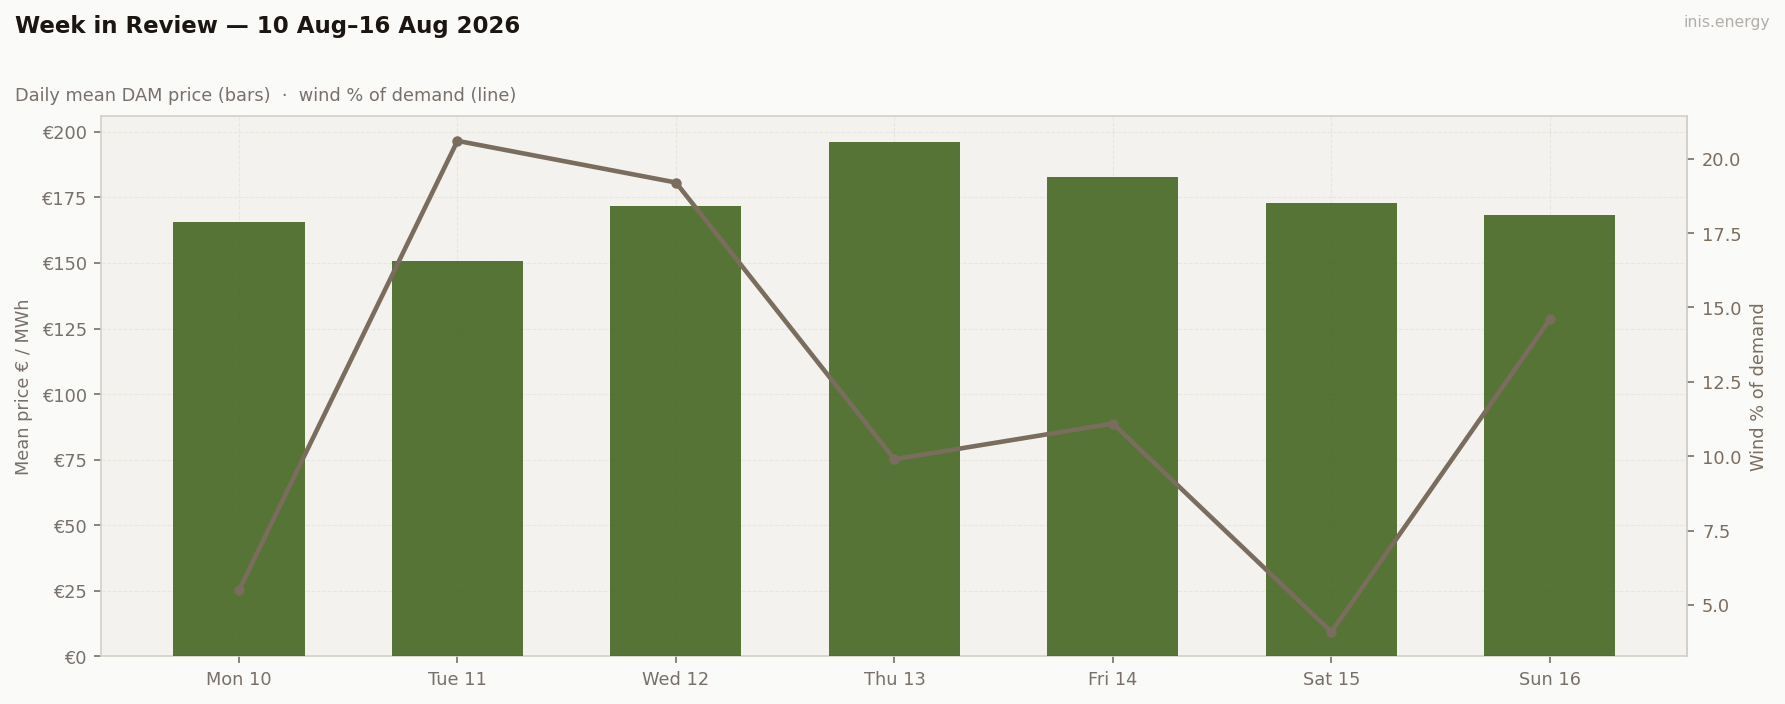
| Day | Mean | Peak | Min | Wind % |
|---|---|---|---|---|
| Monday 10 Aug | €165.78 | €228.21 | €130.99 | 5.5% |
| Tuesday 11 Aug | €150.73 | €190.64 | €119.52 | 20.6% |
| Wednesday 12 Aug | €171.8 | €276.75 | €128.17 | 19.2% |
| Thursday 13 Aug | €196.14 | €312.1 | €138.5 | 9.9% |
| Friday 14 Aug | €182.7 | €273.29 | €138.7 | 11.1% |
| Saturday 15 Aug | €172.72 | €225.18 | €137.6 | 4.1% |
| Sunday 16 Aug | €168.38 | €209.07 | €137.61 | 14.6% |
Analysis #
At €172.61/MWh, this was the highest weekly average since the series began on 4 May 2026 — and it wasn’t close. The previous high was €164.19 (week of 6–12 July). That’s a real number, but the more useful one is the trend comparison below: this week ran 19.5% above the trailing twelve-week average. Low wind did the damage: 12.1% average generation share for the week, against a run of weeks that had mostly sat in the high teens and twenties. Take wind out of the system and the gas floor rises, the evening ceiling opens up, and the spread between the two — which is where storage and flexible demand make their money — widens on every weekday.
The week split cleanly into two regimes. Monday through Friday ran a near-identical evening-scarcity shape: a soft midday trough as demand eased and whatever wind there was peaked, followed by a hard ramp into a scarcity-priced evening as demand returned and wind, more often than not, kept falling. Thursday was the extreme case — wind collapsed to 9.9% for the day (never breaking out of single digits until the afternoon) and the market priced it without mercy: a €312.10 peak at 19:30, the week’s high by a wide margin, with 40% of the day’s periods clearing above €200. Friday repeated the pattern in miniature on slightly better wind (11.1%) and came in €39 lower on the peak. Wednesday, on moderate wind (19.2%), still found a €276.75 evening peak once wind eased off in the last few hours of daylight — the floor stays gas-set through the afternoon regardless of wind; it’s the ceiling that moves.
The weekend broke the pattern entirely, and demand — not wind — was why. Saturday’s wind fell to the week’s lowest point (4.1%) but the day went flat instead of spiking: mean demand dropped to the week’s floor, and with no weekday evening surge to punch through the gas floor, the peak/off-peak spread compressed to essentially zero. Sunday went further — demand fell again, wind recovered to a moderate 14.6%, and the peak/off-peak spread actually went negative (-€8.46): the average price during the 07:00–22:00 window came in below the overnight average, a genuine inversion of the normal shape. Two low-wind days, two of the week’s weakest storage returns (€100 and €74 gross respectively, against a Thursday high of €239) — the reminder here is that storage gets paid for volatility, not for price level, and a flat-but-high day pays worse than a spiky-but-moderate one.
Storage economics moved in lockstep with the wind story, and the range across the week is the clearest illustration of it. The simulated 1MW/2MWh battery cleared €239 gross (85.8% ROI) on Thursday’s low-wind scarcity spread and just €74 gross (26.4% ROI) on Sunday’s flat, wind-recovered day — a more than threefold swing on the same asset, same strategy, seven days apart. The rule holds across every day this week without exception: the wider the trough-to-peak spread, the better storage does, and wind is the single biggest lever on how wide that spread gets. A low-wind week is a bad week to be a variable-rate buyer and a good week to be a battery.
Against the broader run, this week sits well above trend on every horizon. The trailing 4-week average (weeks ending 19 July through 9 August) was €157.14/MWh — this week ran €15.47 above that, a 9.8% premium. Against the trailing 12-week average of €144.49/MWh, the gap widens to €28.12, or 19.5%. Prices have been drifting up since the mid-June low of €116.34 (week of 7 June), but this week is the first clear step-change rather than a gradual climb — a single-week wind shortfall large enough to move the average on its own, not a slow seasonal trend.
If you’re renewing in the next 90 days: the wholesale level you’re being quoted off right now is elevated relative to the summer average — suppliers pricing a fixed-rate offer this week are working from a curve that includes this week’s scarcity pricing, not the calmer weeks either side of it. That doesn’t mean wait; wind is not a controllable variable and next week could just as easily undercut this one. It does mean comparing what’s on the table now against your current rate before signing, rather than assuming this week’s number is representative of what you’ll actually pay over a 12-month contract.
If you’re currently on a rollover or out-of-contract rate: this is the week that costs you the most to be on one. Rollover rates track wholesale movement with none of the smoothing a fixed contract gives you, and a week like this one — nearly 20% above the 12-week average — shows up in full on the next bill. Reviewing your SME supply contract against a fixed offer is worth doing now, not at the next renewal date, if you’ve been meaning to get off a rollover rate.
If you fixed through 2027 already: this week is exactly what that decision was for. A €312 evening peak and a week running 19.5% above the trailing 12-week average is the volatility a fixed rate insulates you from — nothing to do here except note that the contract is doing its job.
Methodology #
Data sourced from SEMO Day-Ahead Market results and EirGrid generation reports. Raw source files are archived and checksum-verified against the published figures — see our provenance record for the manifest and verification method. Analysis performed in Python using pandas and matplotlib.
Compare your business electricity and gas rates in minutes with INIS Energy Brokers.
Compare rates