Weekly Analysis — 28 September–4 October 2026
Table of Contents
4th dearest of the last 14 weeks; last dearer: week of 21 Sep. Against the previous 13 weeks: normal.
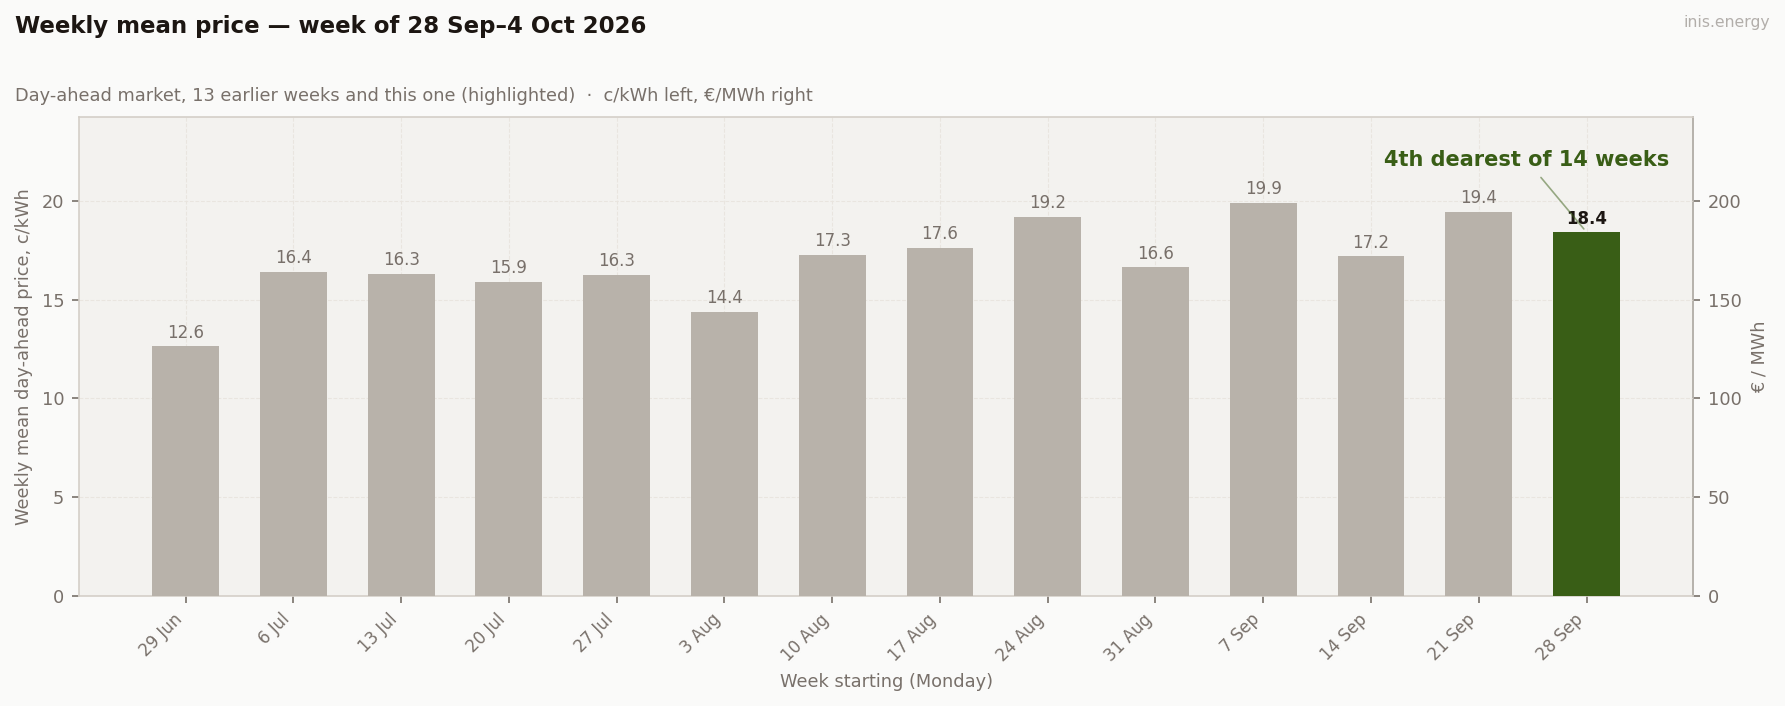
| Measure | Value |
|---|---|
| Week mean (c/kWh) | 18.42 |
| Volatility verdict (trailing) | normal (median daily spread €130.13/MWh) |
Same week last year: not available. Only 1 complete seasonal week in the store (weeks starting 364 days earlier +/- 14 days), need 4.
How this week compares #
| Comparison | Value |
|---|---|
| Rank vs trailing 13 weeks (1 = dearest) | 4 of 14 |
| Dearest since (trailing) | 2026-09-21 |
| Cheapest since (trailing) | 2026-09-14 |
| Price verdict (trailing) | normal |
Daily means #
| Day | Mean (c/kWh) | Mean (€/MWh) |
|---|---|---|
| Mon 28 Sep | 20.91 | 209.05 |
| Tue 29 Sep | 15.84 | 158.37 |
| Wed 30 Sep | 14.25 | 142.52 |
| Thu 1 Oct | 18.89 | 188.95 |
| Fri 2 Oct | 19.66 | 196.56 |
| Sat 3 Oct | 21.58 | 215.83 |
| Sun 4 Oct | 17.79 | 177.92 |
Wind and price spikes #
| Measure | Value |
|---|---|
| Mean wind (MW) | 1743.1 |
| Trailing median wind (MW) | 865.6 |
| Wind coverage | 100% of periods have wind data |
| Periods above €150 | 280 of 336 (trailing median 232) |
| Periods above €200 | 102 of 336 (trailing median 72) |
This is the wholesale day-ahead price, not your bill. Network charges, levies, supplier margin and VAT are on top, and they differ by contract. A cheap week is not a reason to fix your rate, and an expensive one is not a reason to panic.
Commentary #
The week ran dearer than its label suggests. Against the previous 13 weeks the mean ranks 4th of 14, at 18.42 c/kWh. The tails say more: 280 of 336 half-hours cleared above €150, against a typical 232, and 102 cleared above €200, against a typical 72.
Wind moved the days around. Wednesday 30 Sep was the cheapest at 14.25 c/kWh and Saturday 3 Oct the dearest at 21.58. But wind averaged 1743.1 MW against a 13-week median of 865.6 MW, and the week still sat near the top of the range. Wind alone didn’t keep it cheap.
The 13 weeks are mostly summer, so “normal” here means normal for a baseline that has been rising. This is the spot market. Fixed contract prices are set separately, and nothing in this data speaks to them.
Methodology #
Day-ahead prices are SEMOpx market results; wind is EirGrid’s reported wind generation in MW. The comparison uses the previous 13 complete weeks, ranked by mean price, and is reproducible from the stored data.
Compare your business electricity and gas rates in minutes with INIS Energy Brokers.
Compare rates