I-SEM Daily Briefing — 7 May 2026
Table of Contents
Market Snapshot
| Metric | Value |
|---|---|
| Mean DAM Price | €174.4/MWh |
| Median Price | €173.5/MWh |
| Std Dev | €37.85/MWh |
| Peak Price | €241.77/MWh (23:00) |
| Min Price | €119.0/MWh (11:30) |
| Price Range | €122.77/MWh |
| Periods above €150 | 33 of 48 (69%) |
| Periods above €200 | 15 of 48 (31%) |
| Peak Avg (07–22) | €169.3/MWh |
| Off-peak Avg (22–07) | €182.9/MWh |
| Peak/Off-Peak Spread | €-13.6/MWh |
| Wind % of Demand | 11.0% |
| Wind Range | 2.6%–22.6% |
| Mean Demand | 3875 MW |
Price Profile #
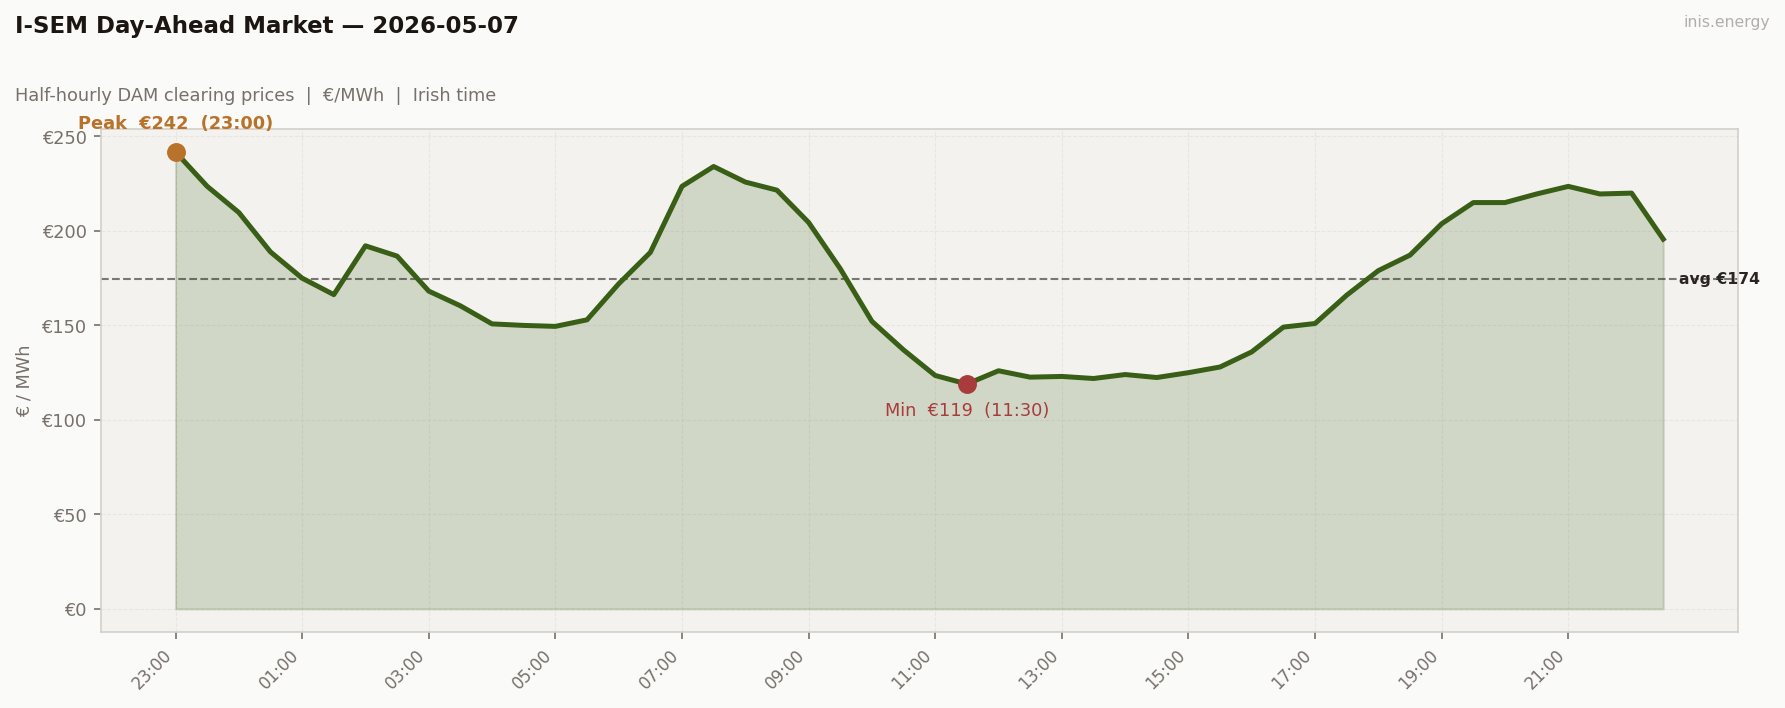
Std dev €37.85/MWh · Median €173.5/MWh · Periods above €150: 33 of 48 (69%)
Price vs Wind #
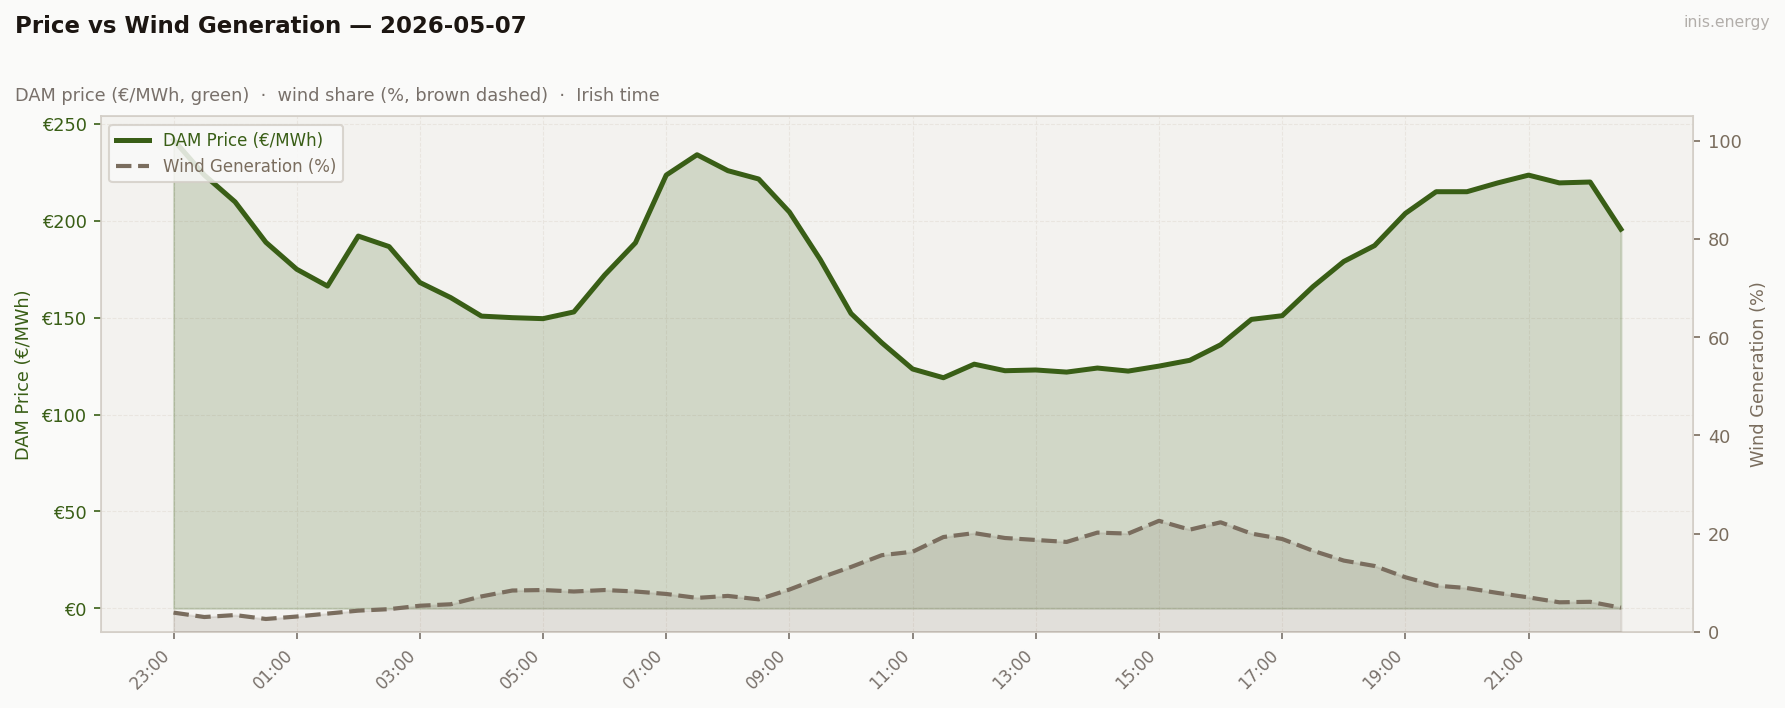
Mean wind: 11.0% · Range: 2.6%–22.6%
Week in Context #
Price Duration Curve #
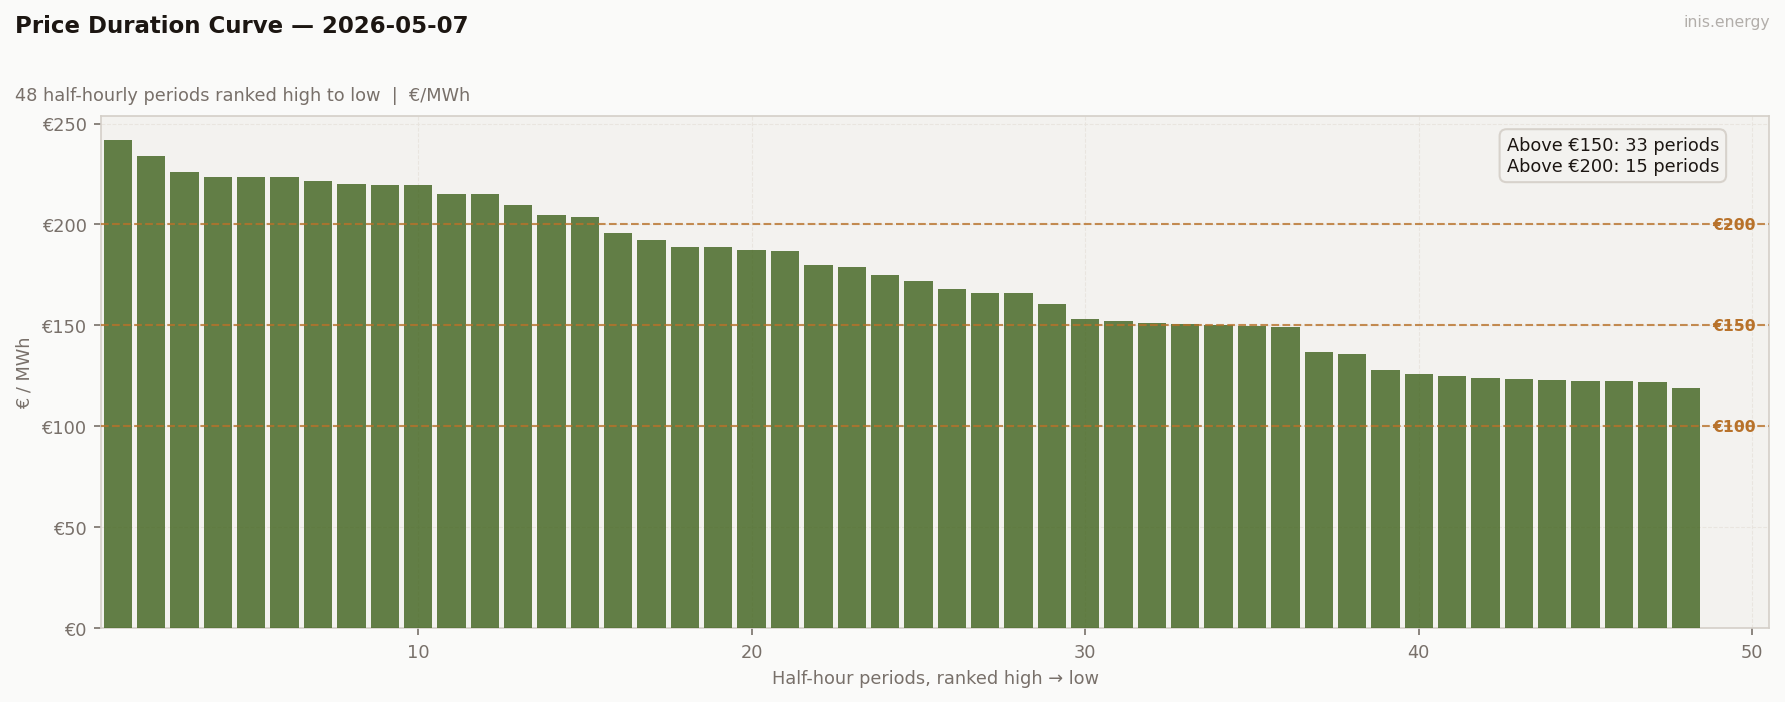
Periods above €150: 33 (69% of day) · Above €200: 15 (31% of day)
Peak / Off-Peak Spread #
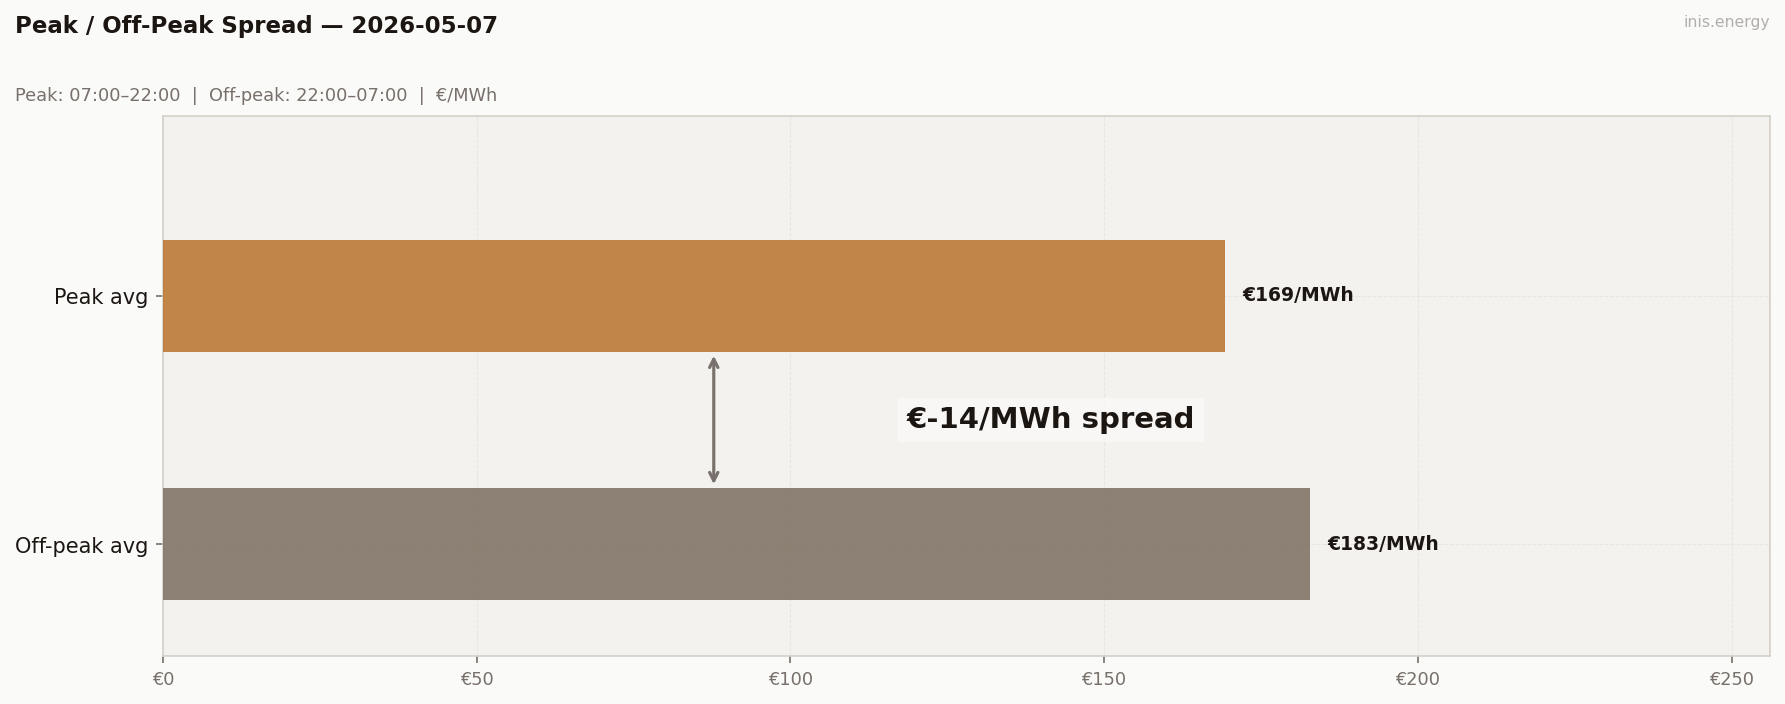
Peak avg (07:00–22:00): €169.3/MWh · Off-peak avg: €182.9/MWh · Spread: €-13.6/MWh
BESS Dispatch Signal #
| Price | Time | Energy | Value | |
|---|---|---|---|---|
| Charge | €123/MWh | 11:30 | 2 MWh | −€245 |
| Discharge | €221/MWh | 20:30 | 1.7 MWh (85% RTE) | +€375 |
| Gross profit | €130 | |||
| Price spread | €98/MWh | ROI: 52.9% |
Updated 2026-08-27: the BESS simulation previously allowed the discharge window to occur before the charge window ended, which is physically impossible for a battery — in this case, by picking the 07:00 morning block, which falls before the 11:30 charge. Recalculated enforcing charge-before-discharge; gross profit corrected from €139 to €130.
Simulated 1MW/2MWh battery, one optimal DAM cycle. Gross before network charges and capacity costs.
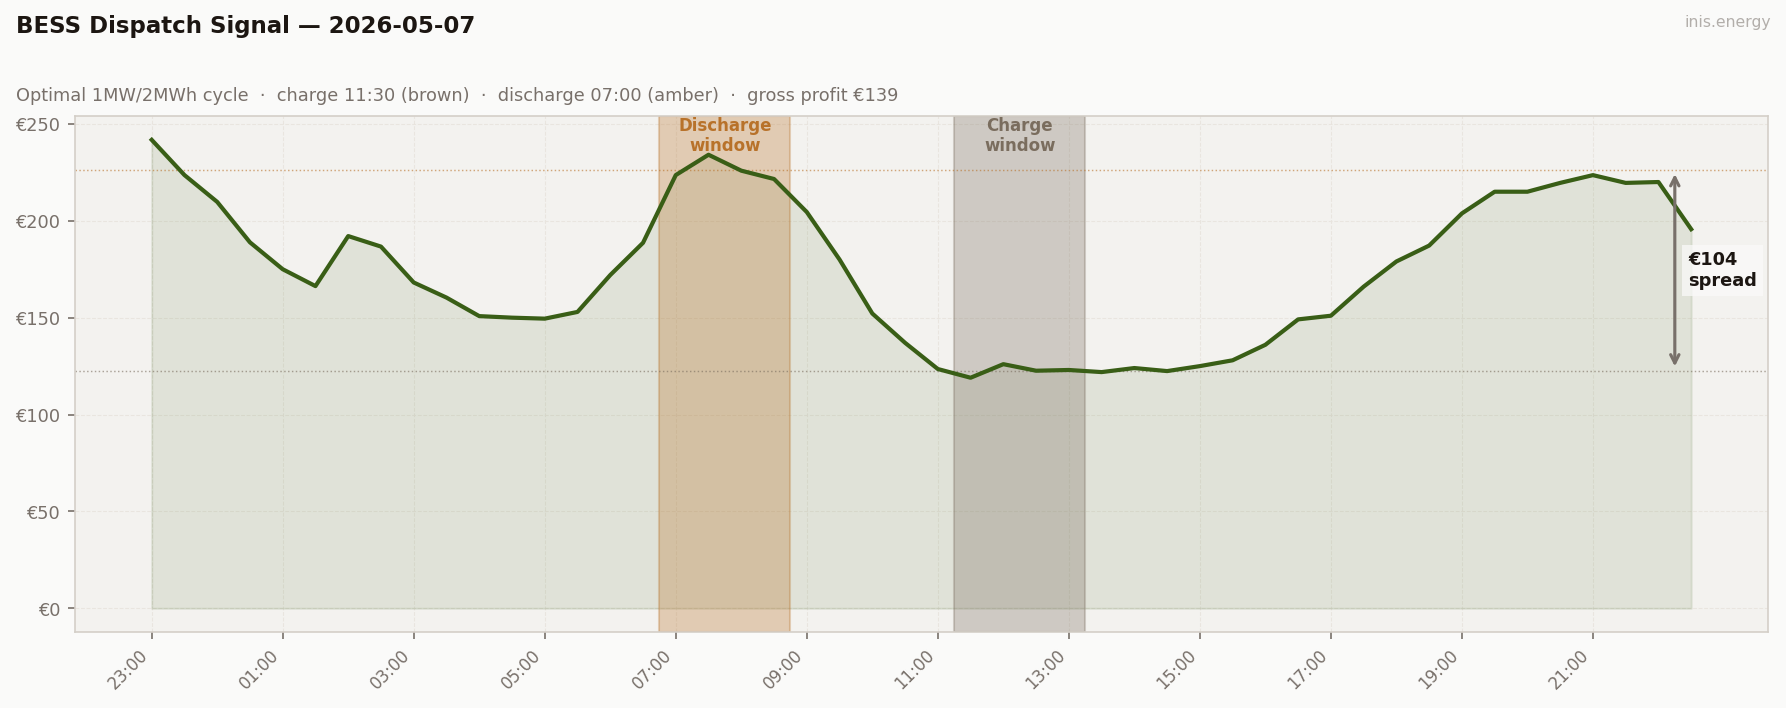
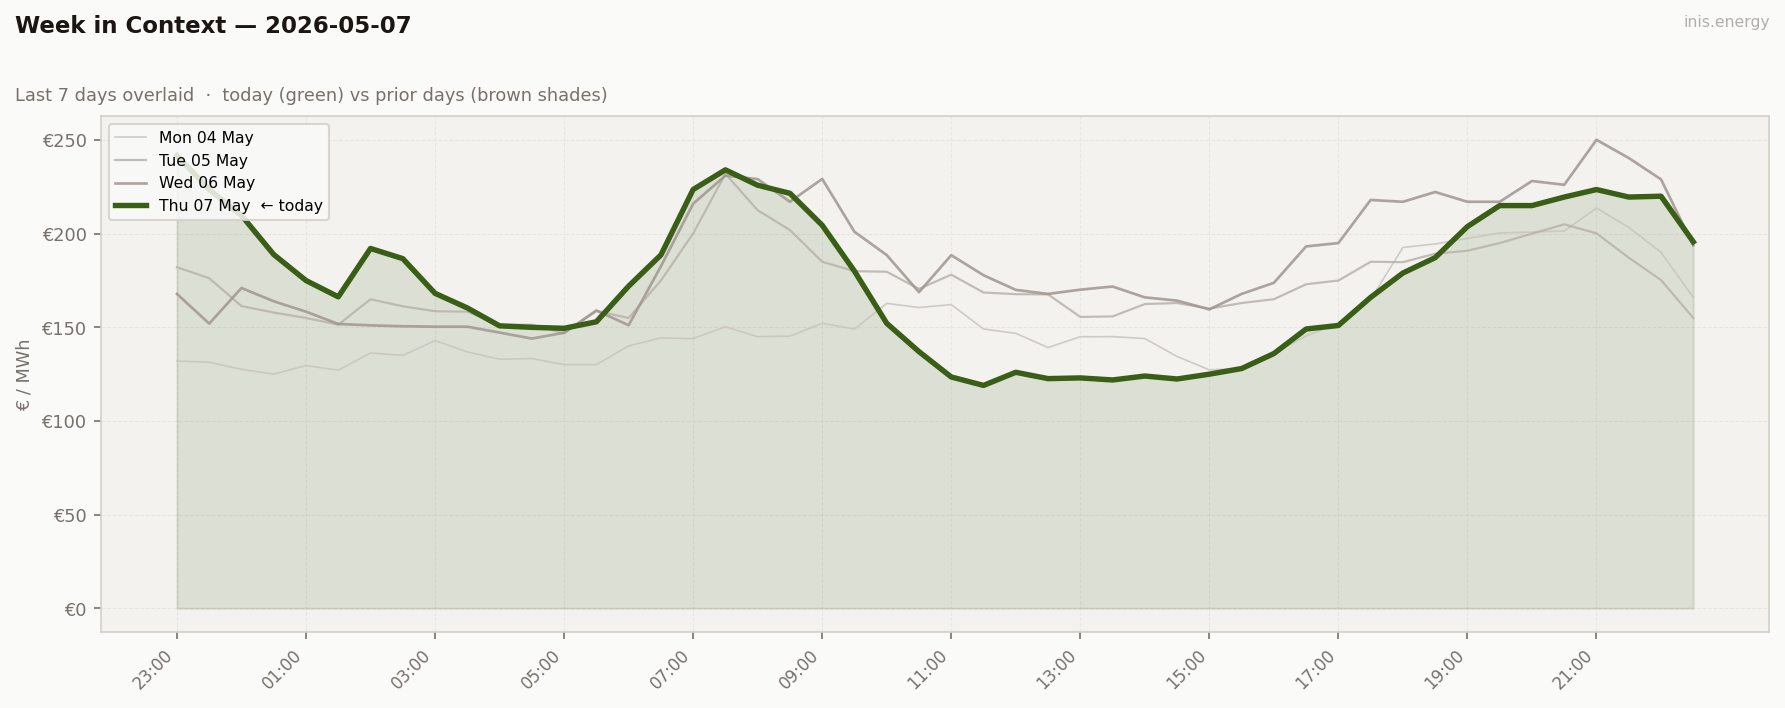
€130 gross — still the week’s best, and wind built it. Charged at €123 (11:30) and discharged into the evening peak at €221 (20:30), capturing €98 of spread. The morning peak (€226 at 07:00) was actually higher, but it fell before the midday charge, so it’s out of reach for a same-day cycle. The charge price was still the cheapest of the week; the midday trough that built it was 22.6% wind at €119.
Commentary #
Wind cannibalisation, compressed into six hours. Wind climbed from 8.6% at 09:00 to 22.6% by 15:00 — a 14-point surge — and price fell in lockstep: €204 → €180 → €152 → €137 → €123 → €119. Seven consecutive half-hours below €130, with the daily minimum (€119) at 11:30. The inverse correlation is tight enough to put a number on: roughly €6 of price suppression per 1% rise in wind penetration through that window.
The consequence for wind farms is the cannibalisation problem in its most legible form. Wind generated heavily in the cheap midday window (16–23% of demand during €119–150 periods) and barely at all through the expensive overnight and morning-peak periods (2–5% during €189–242). Capture price today probably sat around €130–145 against a €174 time-weighted mean — meaningful volume, realised well below the day’s average price.
The peak/off-peak spread went negative: peak hours averaged €169.30, off-peak averaged €182.90. Off-peak more expensive than peak. The midday trough sat inside peak hours; overnight retained Wednesday’s wind-drought tail. Any commercial product banded on conventional peak/off-peak windows misfires on a day like this. Storage, on the other hand, made its best money of the week. €130 gross from a €98 spread — the shape that cannibalises wind revenue is exactly the shape batteries are built for, even though the morning’s sharper peak (€226) fell before the battery could reach it.
Half-hourly data — 2026-05-07
| Period | Time | Price (€/MWh) | Wind % |
|---|---|---|---|
| 1 | 23:00 | 241.77 | 3.9% |
| 2 | 23:30 | 223.60 | 3.0% |
| 3 | 00:00 | 209.74 | 3.4% |
| 4 | 00:30 | 188.88 | 2.6% |
| 5 | 01:00 | 175.00 | 3.1% |
| 6 | 01:30 | 166.29 | 3.7% |
| 7 | 02:00 | 192.11 | 4.3% |
| 8 | 02:30 | 186.68 | 4.6% |
| 9 | 03:00 | 168.15 | 5.3% |
| 10 | 03:30 | 160.36 | 5.6% |
| 11 | 04:00 | 150.80 | 7.2% |
| 12 | 04:30 | 150.00 | 8.4% |
| 13 | 05:00 | 149.49 | 8.5% |
| 14 | 05:30 | 152.96 | 8.2% |
| 15 | 06:00 | 172.00 | 8.5% |
| 16 | 06:30 | 188.63 | 8.2% |
| 17 | 07:00 | 223.59 | 7.7% |
| 18 | 07:30 | 234.08 | 6.9% |
| 19 | 08:00 | 225.86 | 7.3% |
| 20 | 08:30 | 221.56 | 6.6% |
| 21 | 09:00 | 204.50 | 8.6% |
| 22 | 09:30 | 180.00 | 11.0% |
| 23 | 10:00 | 152.15 | 13.2% |
| 24 | 10:30 | 137.03 | 15.6% |
| 25 | 11:00 | 123.50 | 16.3% |
| 26 | 11:30 | 119.00 | 19.3% |
| 27 | 12:00 | 126.00 | 20.1% |
| 28 | 12:30 | 122.62 | 19.1% |
| 29 | 13:00 | 123.00 | 18.7% |
| 30 | 13:30 | 121.91 | 18.3% |
| 31 | 14:00 | 124.00 | 20.2% |
| 32 | 14:30 | 122.43 | 20.0% |
| 33 | 15:00 | 125.00 | 22.6% |
| 34 | 15:30 | 128.00 | 20.8% |
| 35 | 16:00 | 136.00 | 22.3% |
| 36 | 16:30 | 149.11 | 20.0% |
| 37 | 17:00 | 151.00 | 18.9% |
| 38 | 17:30 | 166.00 | 16.5% |
| 39 | 18:00 | 179.00 | 14.5% |
| 40 | 18:30 | 187.20 | 13.4% |
| 41 | 19:00 | 203.80 | 11.1% |
| 42 | 19:30 | 215.00 | 9.4% |
| 43 | 20:00 | 215.00 | 8.9% |
| 44 | 20:30 | 219.55 | 7.9% |
| 45 | 21:00 | 223.56 | 7.0% |
| 46 | 21:30 | 219.55 | 6.0% |
| 47 | 22:00 | 220.00 | 6.1% |
| 48 | 22:30 | 195.65 | 4.9% |
Compare your business electricity and gas rates in minutes with INIS Energy Brokers.
Compare rates