I-SEM Daily Briefing — 8 May 2026
Table of Contents
Market Snapshot
| Metric | Value |
|---|---|
| Mean DAM Price | €163.87/MWh |
| Median Price | €159.43/MWh |
| Std Dev | €21.31/MWh |
| Peak Price | €216.19/MWh (07:30) |
| Min Price | €127.34/MWh (22:30) |
| Price Range | €88.85/MWh |
| Periods above €150 | 35 of 48 (73%) |
| Periods above €200 | 5 of 48 (10%) |
| Peak Avg (07–22) | €168.6/MWh |
| Off-peak Avg (22–07) | €155.98/MWh |
| Peak/Off-Peak Spread | €12.62/MWh |
Price Profile #
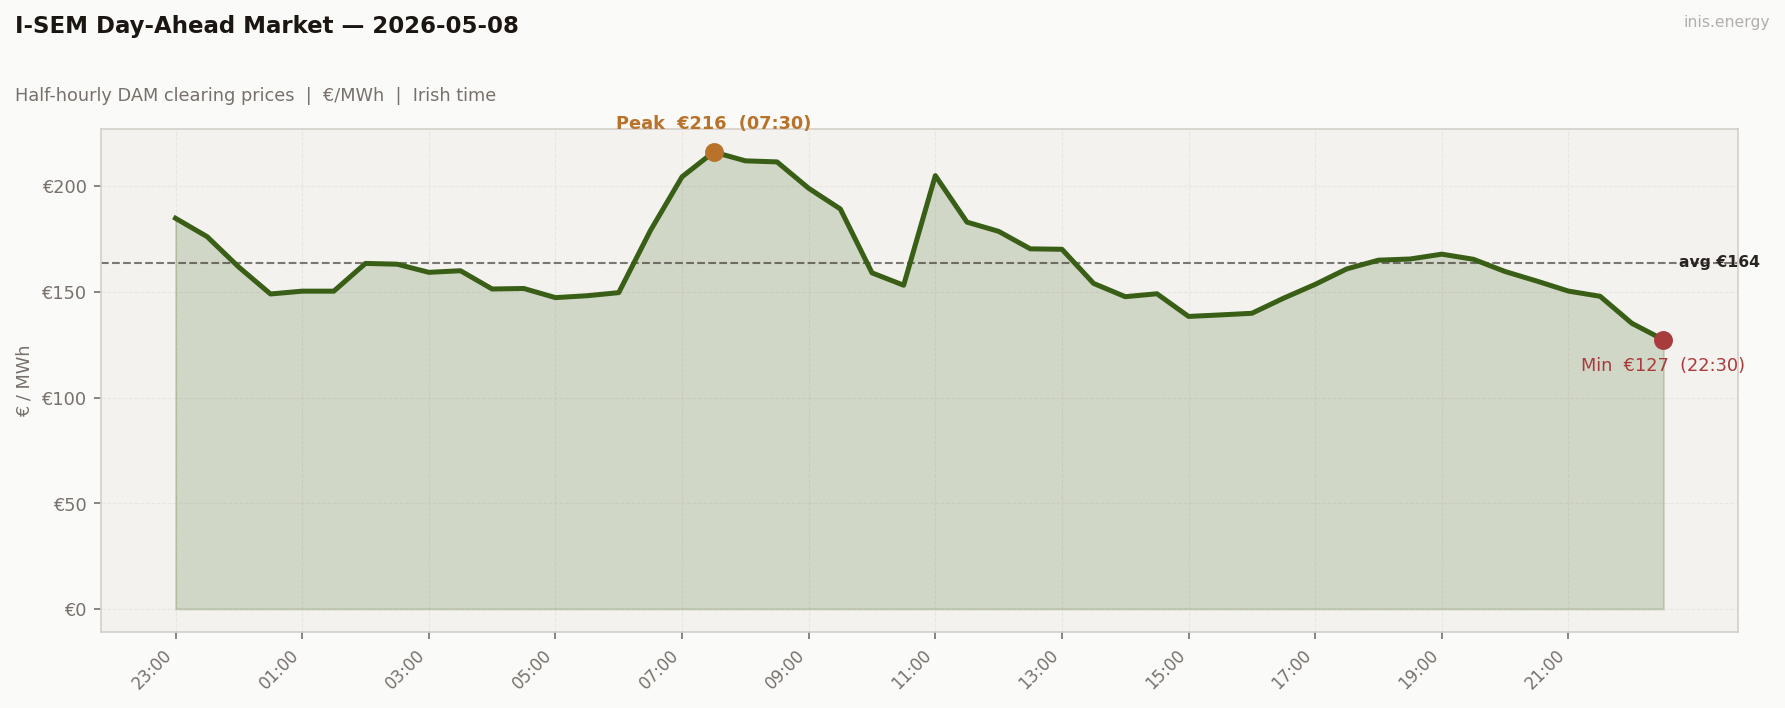
Std dev €21.31/MWh · Median €159.43/MWh · Periods above €150: 35 of 48 (73%)
Week in Context #
Price Duration Curve #
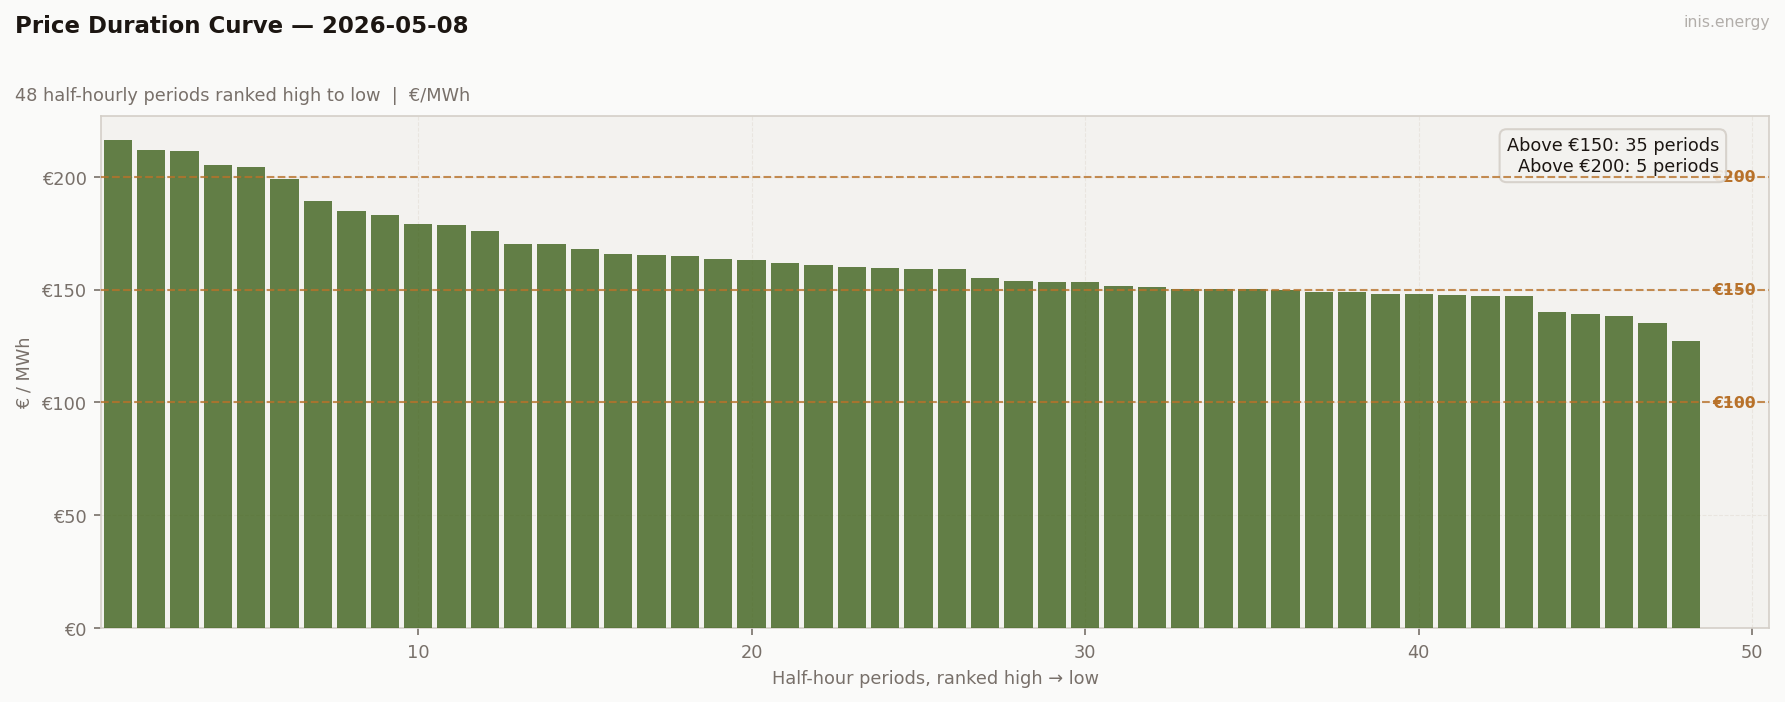
Periods above €150: 35 (73% of day) · Above €200: 5 (10% of day)
Peak / Off-Peak Spread #
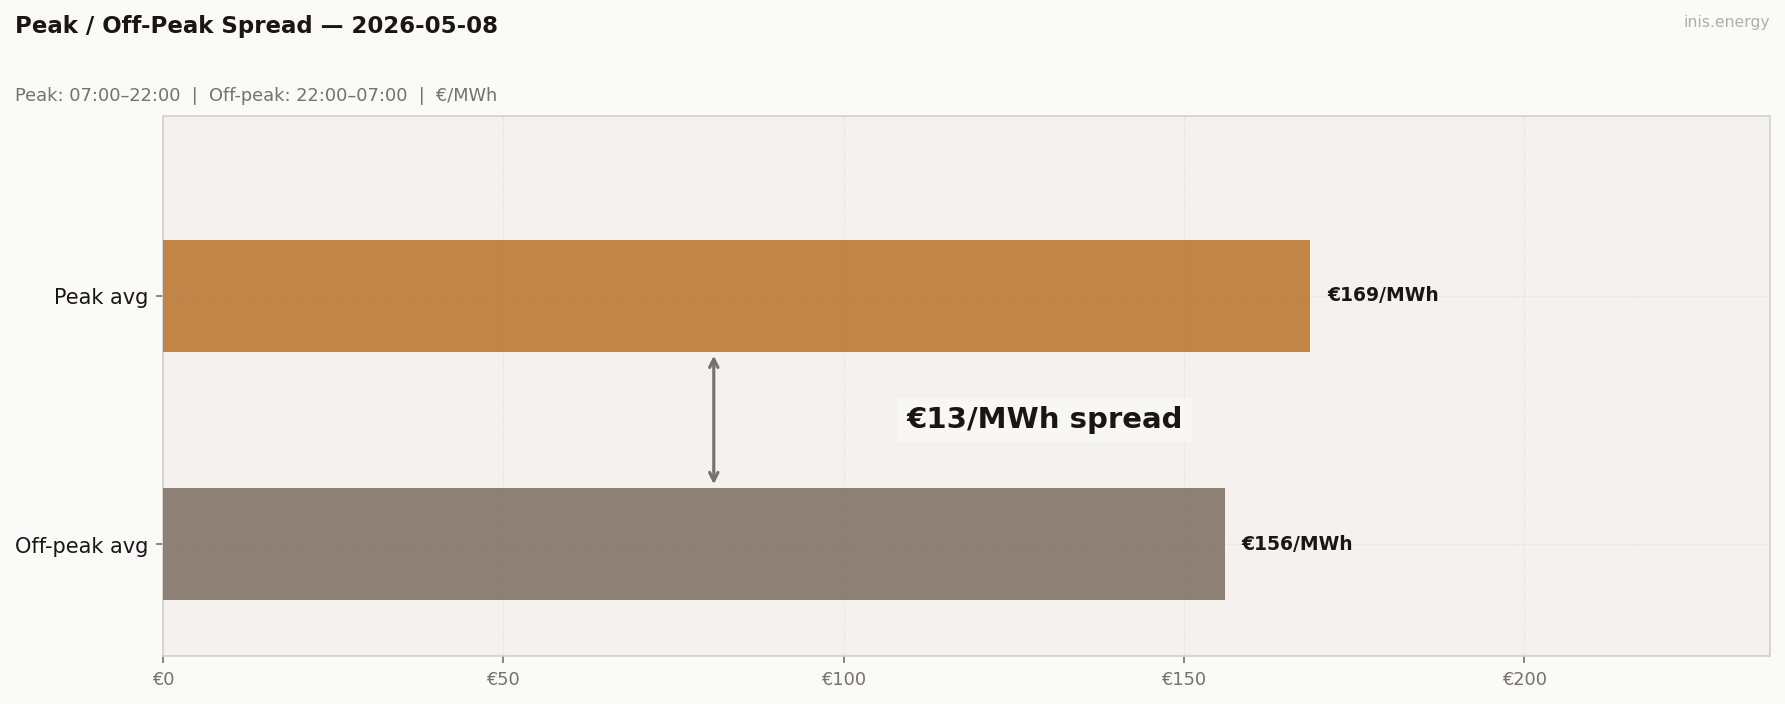
Peak avg (07:00–22:00): €168.6/MWh · Off-peak avg: €155.98/MWh · Spread: €12.62/MWh
BESS Dispatch Signal #
Updated 2026-08-27: the BESS simulation previously allowed the discharge window to occur before the charge window ended, which is physically impossible for a battery. Recalculated enforcing charge-before-discharge — see below.
No profitable single-cycle trade today. The day’s cheapest four-period block sits at 21:00 (€140/MWh avg) — the late-evening fade. But the day’s priciest block, €211/MWh, falls at 07:00, earlier in the same delivery day. A battery can’t discharge into a peak that already happened before it charged, so with only one cycle allowed per day, there’s no causally valid pairing left: by the time the evening trough opens up, the morning’s opportunity is already behind it.
Commentary #
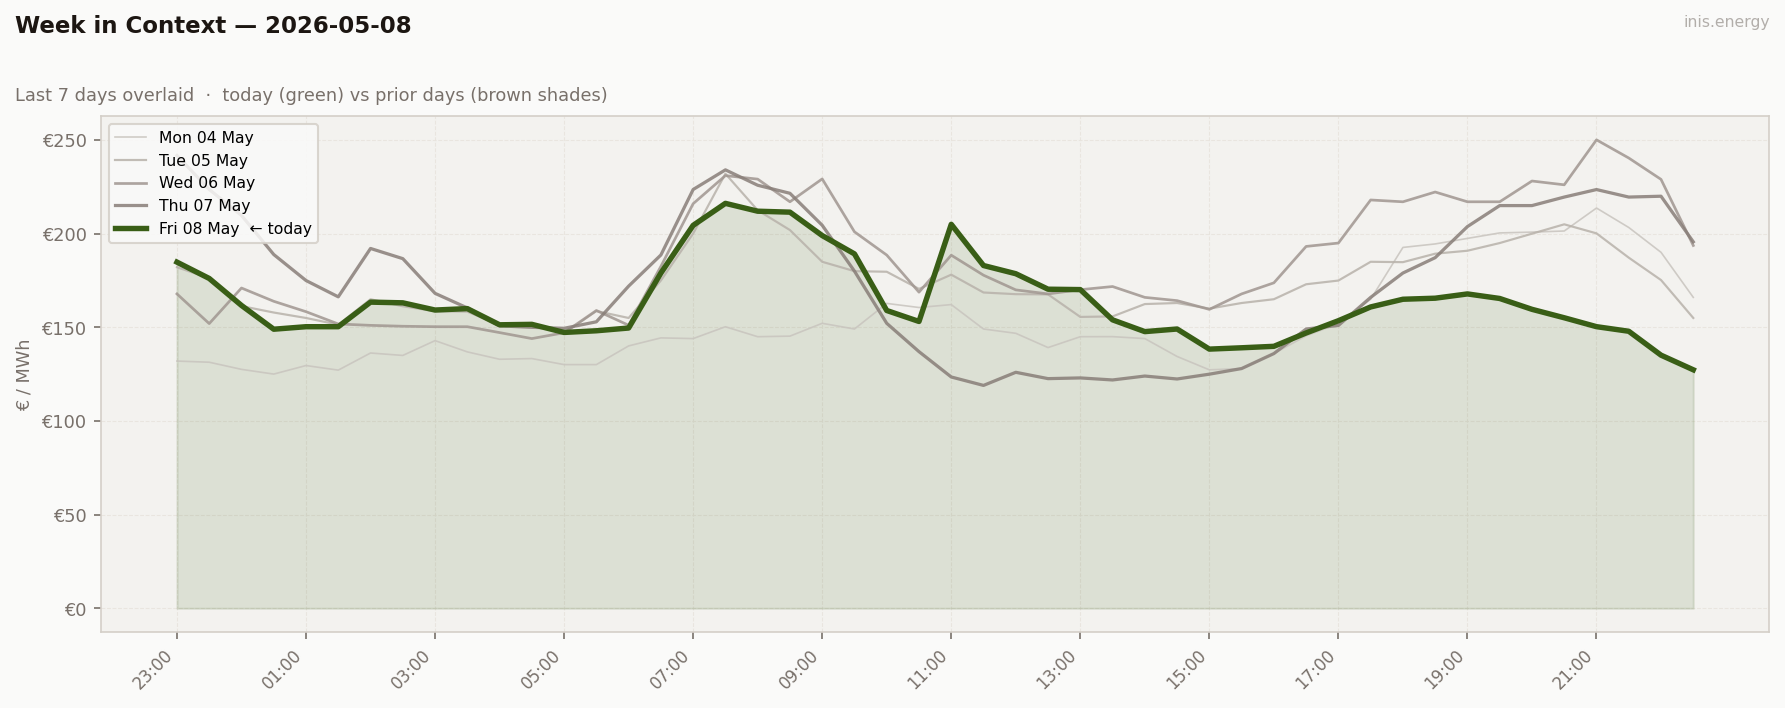
Friday softened. Mean dropped to €163.87/MWh — the lowest of the working week — and the signature of the day was the evening that never arrived. Price peaked at €216 at 07:30 and then decayed: through the afternoon, through the evening, reaching a daily minimum of €127.34 at 22:30. Every other weekday this run produced an evening peak above €200. Friday’s topped at €168.
The morning ramp held, as it has every working day this week. 06:00 to 07:30 moved €66/MWh — slightly softer than the €80+ ramps of Tue–Thu, but the same thermal signature in the same window. One exception worth flagging: a single spike to €205 at 11:00, €50 above its neighbours on either side. A single half-hour jumping that far above its neighbourhood is an operational event — a forecast error, short outage, or interconnector swing — the kind of thing visible next day in EirGrid’s system reports.
For storage, no trade today — the run’s first no-cycle day. The day’s real opportunity (charge into the evening fade, discharge into the morning peak) needs a cycle that spans two calendar days, which a same-day model can’t take. It’s a reminder that the single-cycle model understates real BESS revenue on exactly the days when the shape is this lopsided: a rolling 24-hour optimiser would have captured this one.
Half-hourly data — 2026-05-08
| Period | Time | Price (€/MWh) |
|---|---|---|
| 1 | 23:00 | 184.82 |
| 2 | 23:30 | 176.10 |
| 3 | 00:00 | 161.70 |
| 4 | 00:30 | 149.00 |
| 5 | 01:00 | 150.34 |
| 6 | 01:30 | 150.34 |
| 7 | 02:00 | 163.46 |
| 8 | 02:30 | 163.09 |
| 9 | 03:00 | 159.24 |
| 10 | 03:30 | 160.00 |
| 11 | 04:00 | 151.36 |
| 12 | 04:30 | 151.60 |
| 13 | 05:00 | 147.28 |
| 14 | 05:30 | 148.17 |
| 15 | 06:00 | 149.64 |
| 16 | 06:30 | 179.00 |
| 17 | 07:00 | 204.45 |
| 18 | 07:30 | 216.19 |
| 19 | 08:00 | 212.00 |
| 20 | 08:30 | 211.49 |
| 21 | 09:00 | 199.00 |
| 22 | 09:30 | 189.22 |
| 23 | 10:00 | 159.00 |
| 24 | 10:30 | 153.14 |
| 25 | 11:00 | 205.00 |
| 26 | 11:30 | 183.00 |
| 27 | 12:00 | 178.63 |
| 28 | 12:30 | 170.36 |
| 29 | 13:00 | 170.15 |
| 30 | 13:30 | 154.00 |
| 31 | 14:00 | 147.72 |
| 32 | 14:30 | 149.11 |
| 33 | 15:00 | 138.38 |
| 34 | 15:30 | 139.09 |
| 35 | 16:00 | 139.87 |
| 36 | 16:30 | 147.00 |
| 37 | 17:00 | 153.55 |
| 38 | 17:30 | 160.89 |
| 39 | 18:00 | 165.00 |
| 40 | 18:30 | 165.56 |
| 41 | 19:00 | 167.84 |
| 42 | 19:30 | 165.41 |
| 43 | 20:00 | 159.62 |
| 44 | 20:30 | 155.11 |
| 45 | 21:00 | 150.36 |
| 46 | 21:30 | 147.91 |
| 47 | 22:00 | 135.15 |
| 48 | 22:30 | 127.34 |
Compare your business electricity and gas rates in minutes with INIS Energy Brokers.
Compare rates