I-SEM Daily Briefing — 9 May 2026
Table of Contents
Market Snapshot
| Metric | Value |
|---|---|
| Mean DAM Price | €113.41/MWh |
| Median Price | €117.29/MWh |
| Std Dev | €16.77/MWh |
| Peak Price | €139.0/MWh (19:30) |
| Min Price | €84.69/MWh (15:00) |
| Price Range | €54.31/MWh |
| Periods above €150 | 0 of 48 (0%) |
| Periods above €200 | 0 of 48 (0%) |
| Peak Avg (07–22) | €108.38/MWh |
| Off-peak Avg (22–07) | €121.8/MWh |
| Peak/Off-Peak Spread | €-13.42/MWh |
| Wind % of Demand | 56.7% |
| Wind Range | 39.1%–67.4% |
| Mean Demand | 3503 MW |
Price Profile #
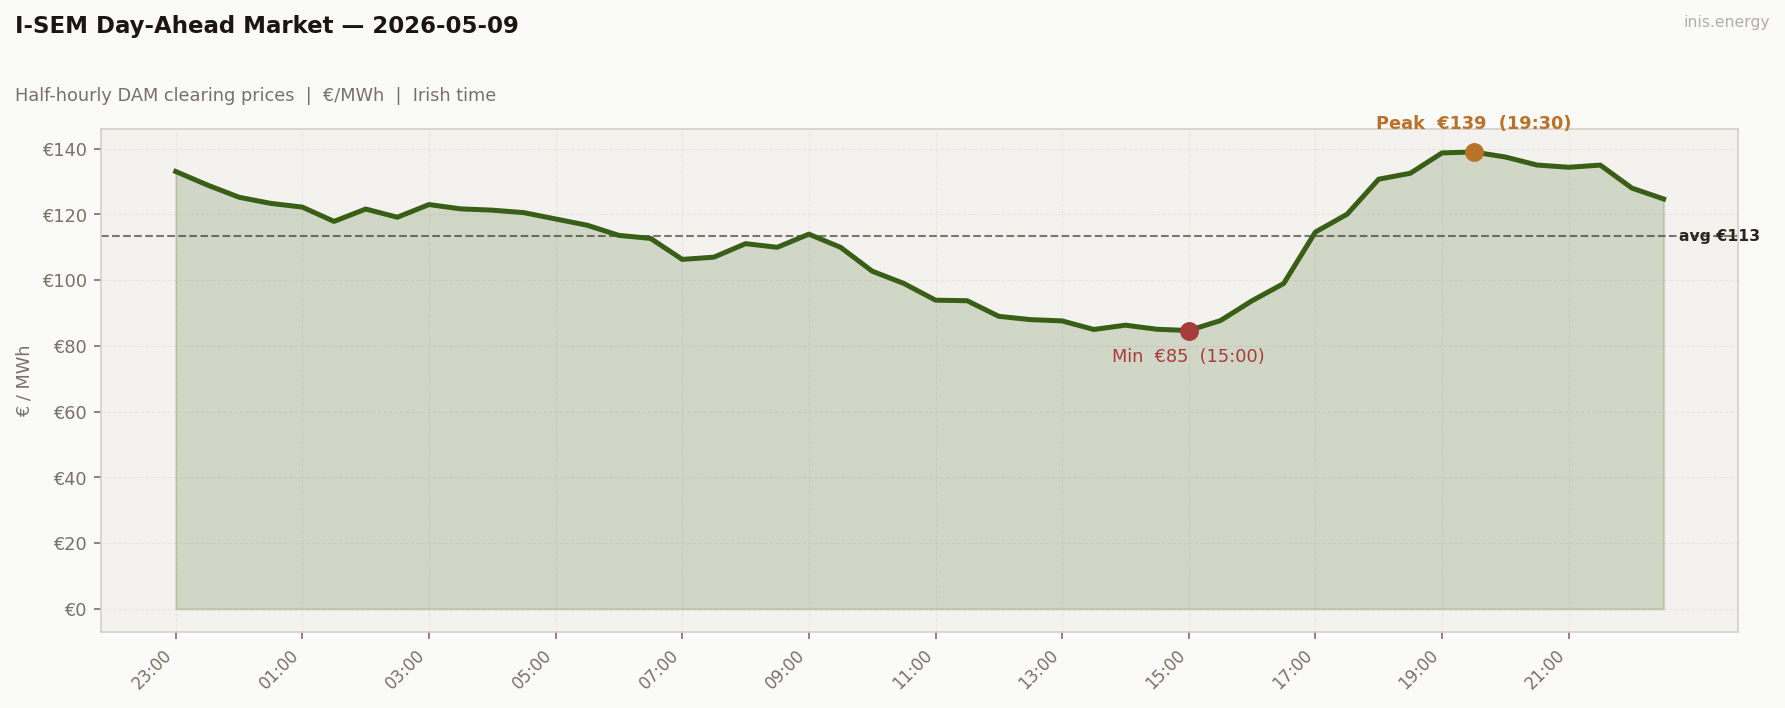
Std dev €16.77/MWh · Median €117.29/MWh · Periods above €150: 0 of 48 (0%)
No morning ramp. From 05:00 to 07:30, every working day this run added €60–85; today gave back €12 in the same window (€118.62 → €106.32). Weekend demand doesn’t wake up — commercial and industrial load is absent, and the thermal ramp never fires.
The shape is a U-curve: prices fell through the morning, bottomed in the early afternoon, and climbed through the evening. The day’s minimum landed at 15:00 (€84.69) — the first midday trough of the run. With wind at 55–57% all afternoon and demand at its weekly low, the system was structurally long: 11 consecutive half-hours between 10:30 and 15:30 cleared below €100.
The evening peak at 19:30 (€139) is real but contained. Residential demand returned and gas plants picked up, but with wind still at 60% through the evening the merit order never had to climb to scarcity. A capped peak on top of a collapsed floor.
Price vs Wind #
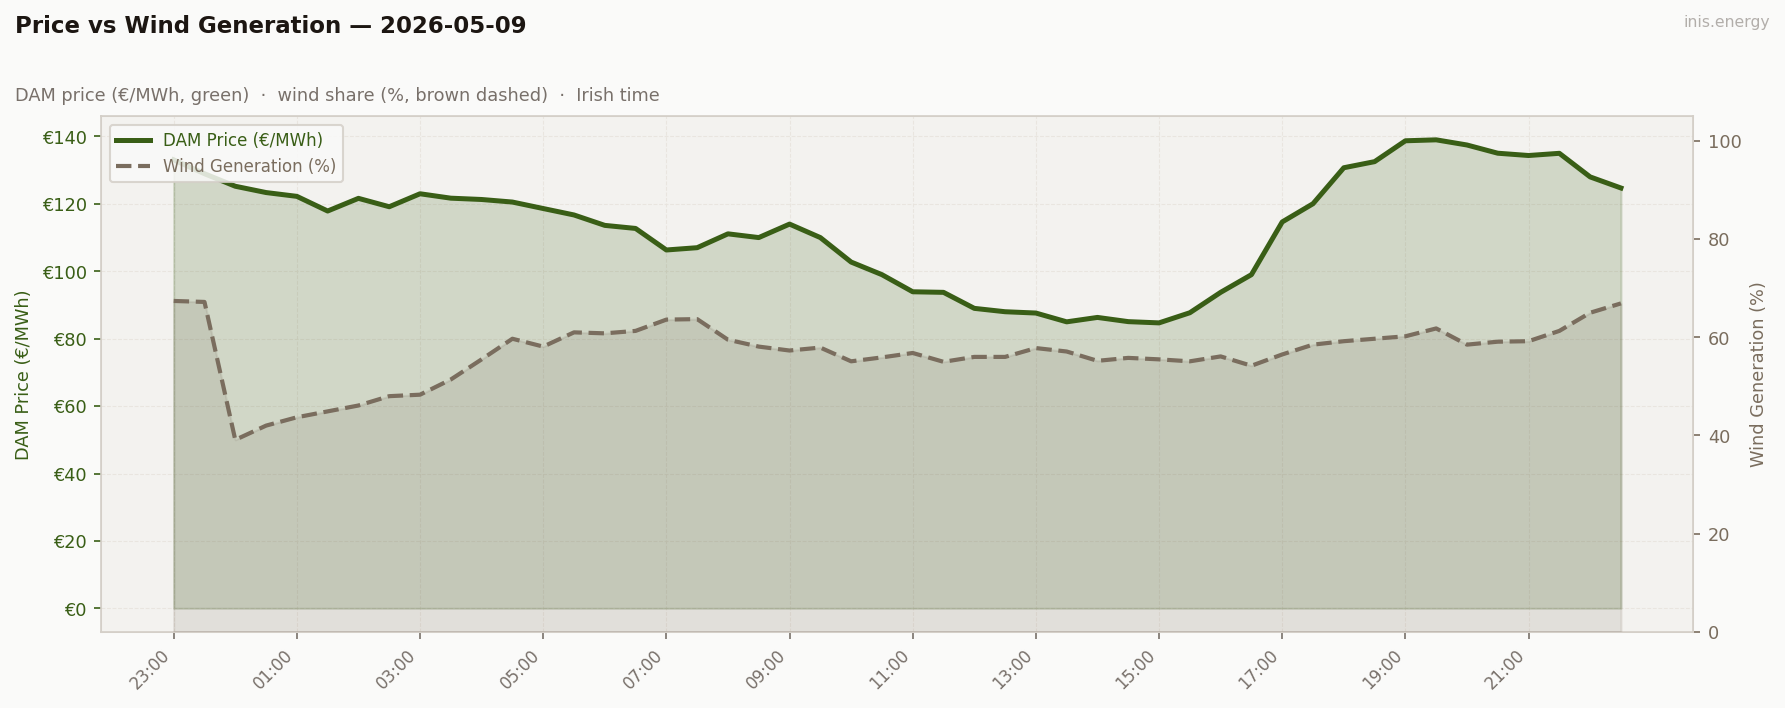
Mean wind: 56.7% · Range: 39.1%–67.4%
Wind stayed high all day — never below 39%, rarely below 55% during working hours. The midday collapse (€84.69 at 15:00 with 55.5% wind) is the merit order functioning exactly as intended: ample cheap supply, insufficient demand to push the clearing price up the curve.
The evening recovery to €139 with wind still at 60% illustrates the floor that always exists. Even at 60% renewable penetration, gas must run to cover residual demand — and that residual gas plant sets the clearing price. The midday-to-evening spread of €55 is what 60% wind allows: a soft peak, not a scarcity one.
Today’s capture price for wind will sit modestly below the daily mean. Wind generated steadily across all price bands — the high wind was present in cheap and modestly-priced hours alike. No dramatic cannibalisation, no unusual premium. A structurally normal high-wind day.
Week in Context #
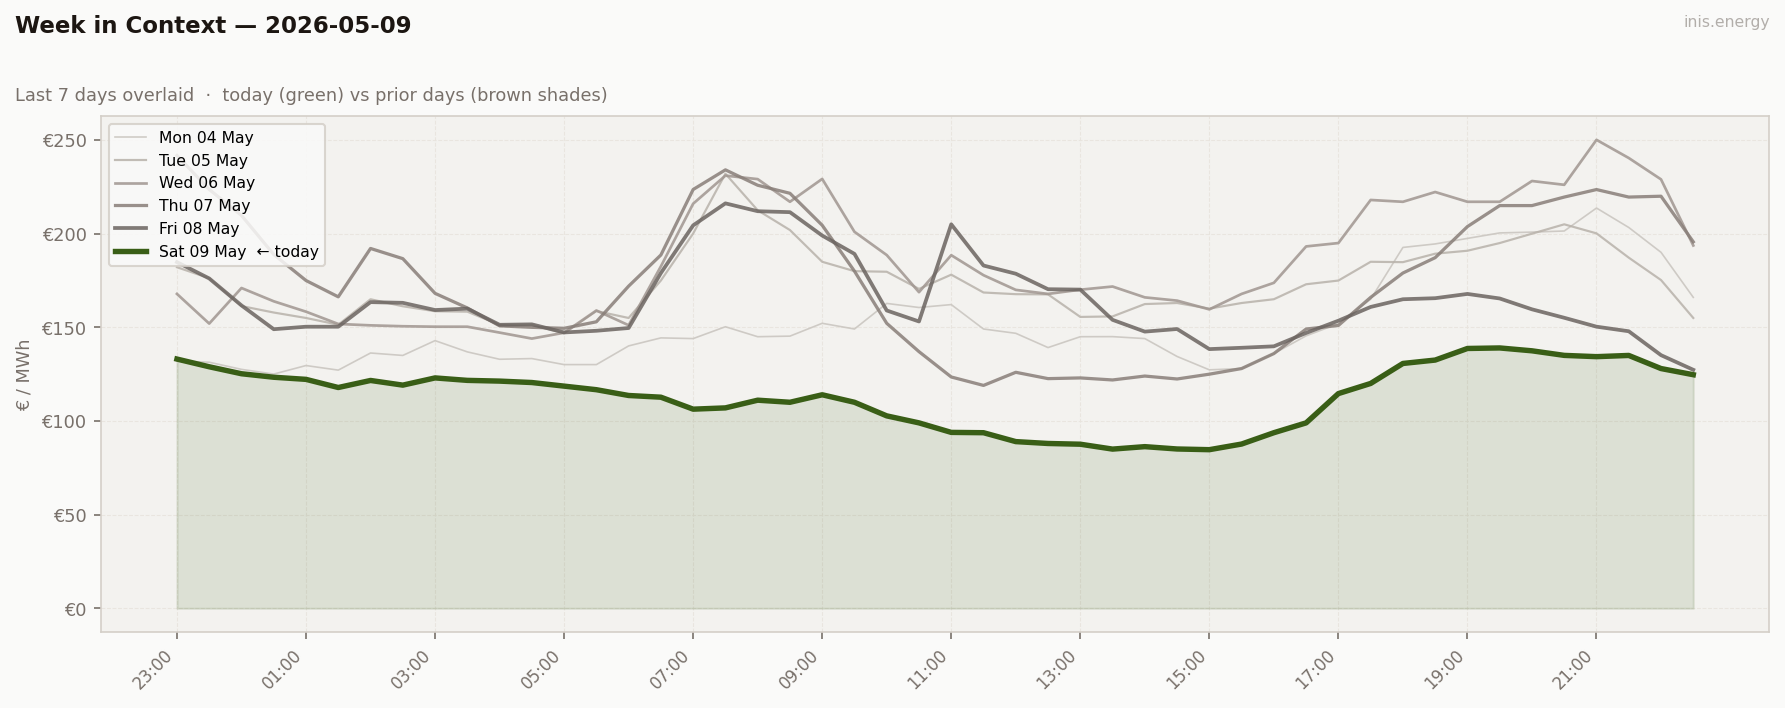
The first departure from the elevated band that defined Mon–Fri. All five working days cleared between €113 and €185; today’s chart sits a clear step below them. The step-down is structural and immediate — weekend demand, not a gradual drift.
Price Duration Curve #
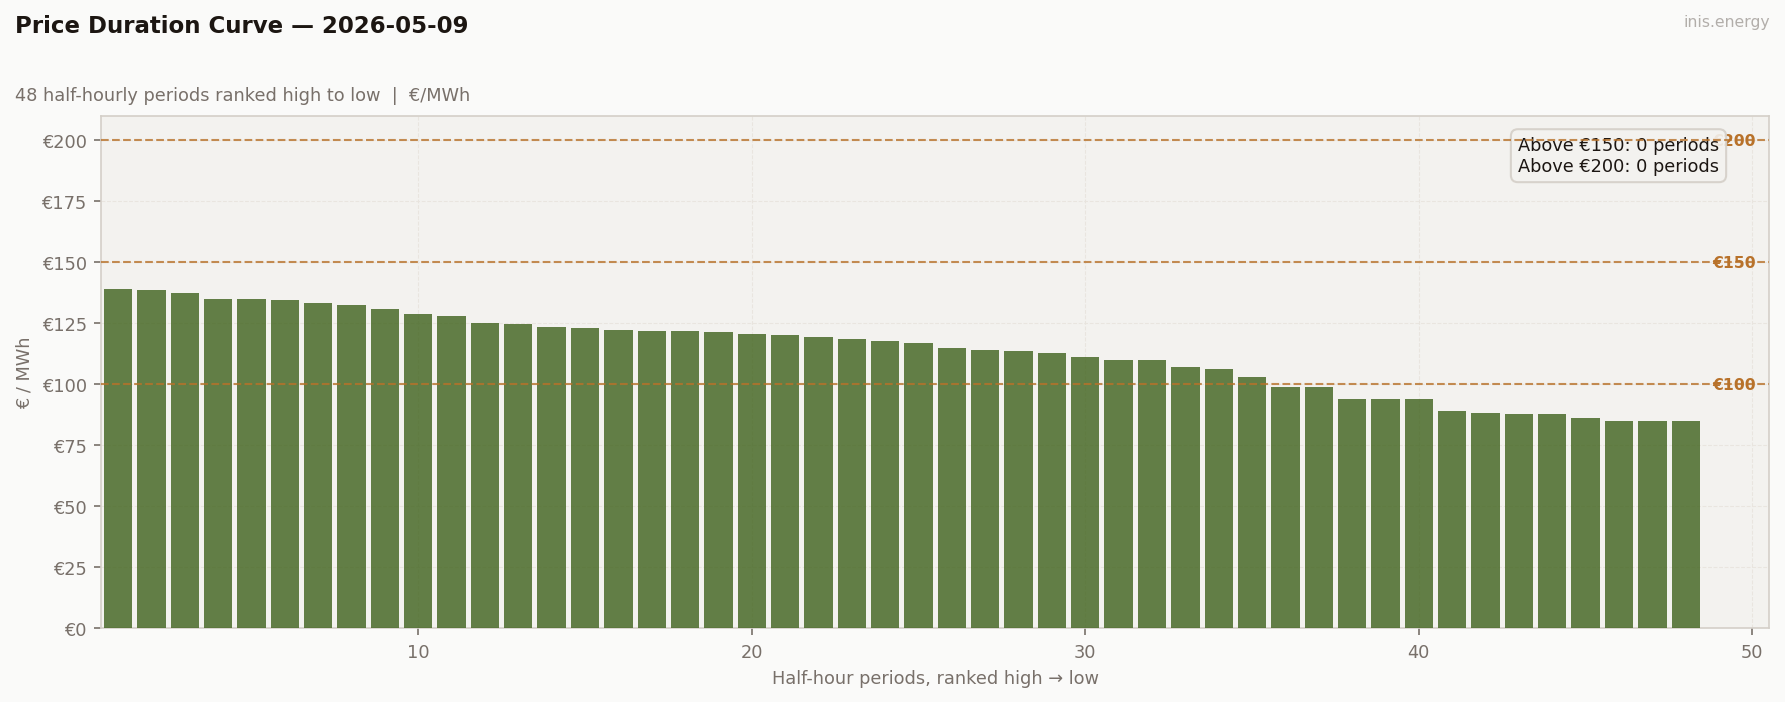
Periods above €150: 0 (0% of day) · Above €200: 0 (0% of day)
Zero above €150. Zero above €200. The flattest, lowest PDC of the run.
The curve spans just €54 (€84.69–€139), compared to Wednesday’s €106 range on a mean nearly double today’s. There are no scarcity hours — a peaker plant that needed €200+ to run earned nothing today. The mid-merit gas clearing at €125 overnight was the expensive end of the market.
Both the top and the bottom of the curve are contained. No cheap floor driven by renewables at zero, but no expensive ceiling either. A uniform, wind-suppressed band.
Peak / Off-Peak Spread #
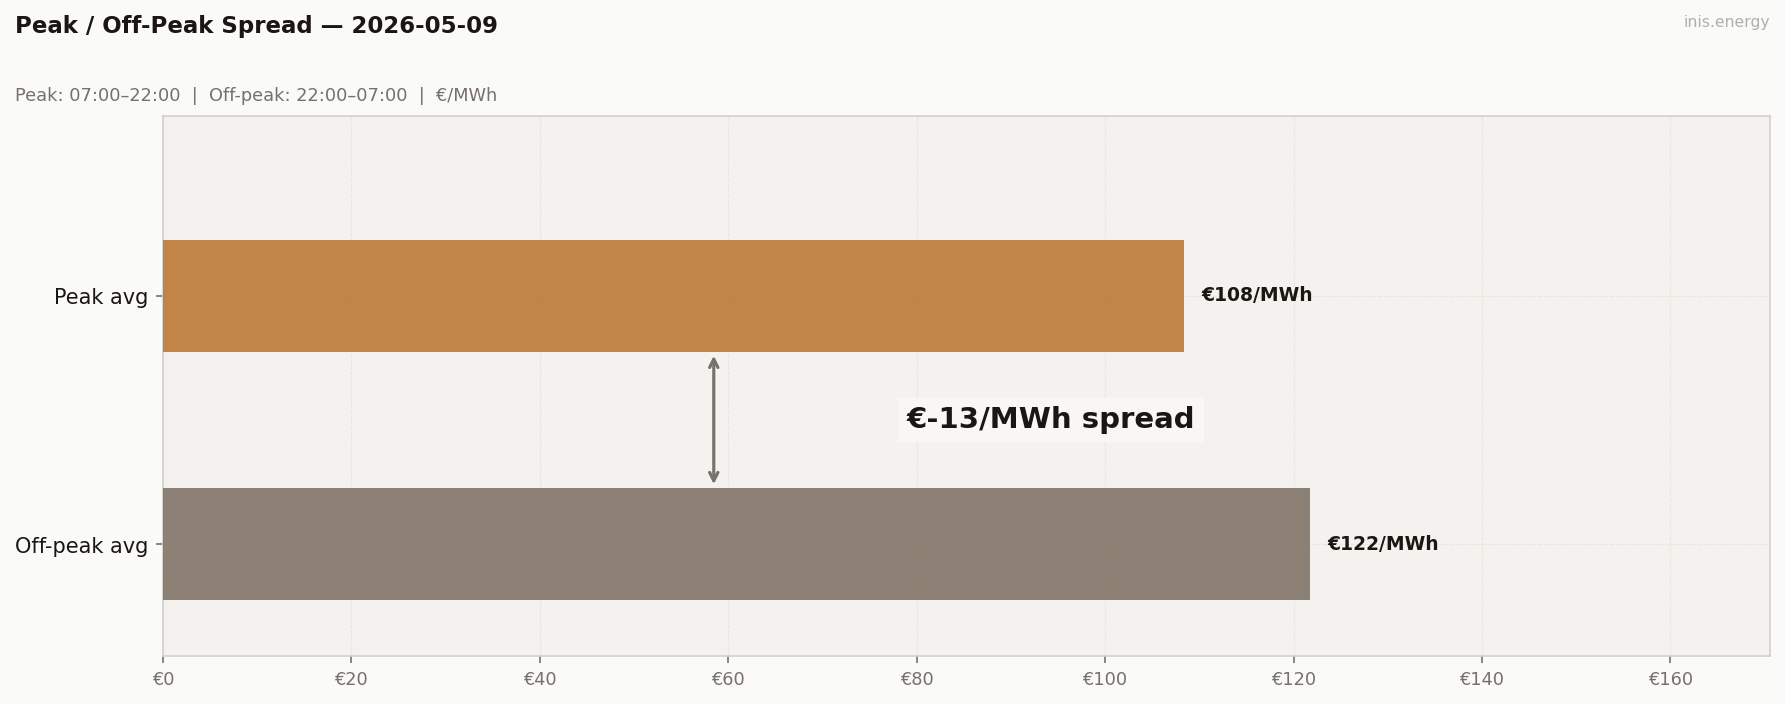
Peak avg (07:00–22:00): €108.38/MWh · Off-peak avg: €121.8/MWh · Spread: €-13.42/MWh
The peak window averaged €108.38; the off-peak window averaged €121.80. Peak cheaper than off-peak.
The inversion is structural, not a data anomaly. The 07:00–22:00 peak window, on a Saturday with 57% wind and low demand, contains all the cheap midday hours — 11 half-hours below €100, sitting squarely inside the “peak” band. The 22:00–07:00 off-peak window holds the overnight gas-marginal periods, where wind was a shade lower and prices settled at €115–125.
The peak/off-peak window is drawn on weekday logic. On a weekend, the market ignores it. A flat scheduling strategy — bid peak, avoid off-peak — would have mispriced both sides.
BESS Dispatch Signal #
| Price | Time | Energy | Value | |
|---|---|---|---|---|
| Charge | €85/MWh | 13:30 | 2 MWh | −€171 |
| Discharge | €138/MWh | 19:00 | 1.7 MWh (85% RTE) | +€234 |
| Gross profit | €63 | |||
| Price spread | €52/MWh | ROI: 37.1% |
Simulated 1MW/2MWh battery, one optimal DAM cycle. Gross before network charges and capacity costs.
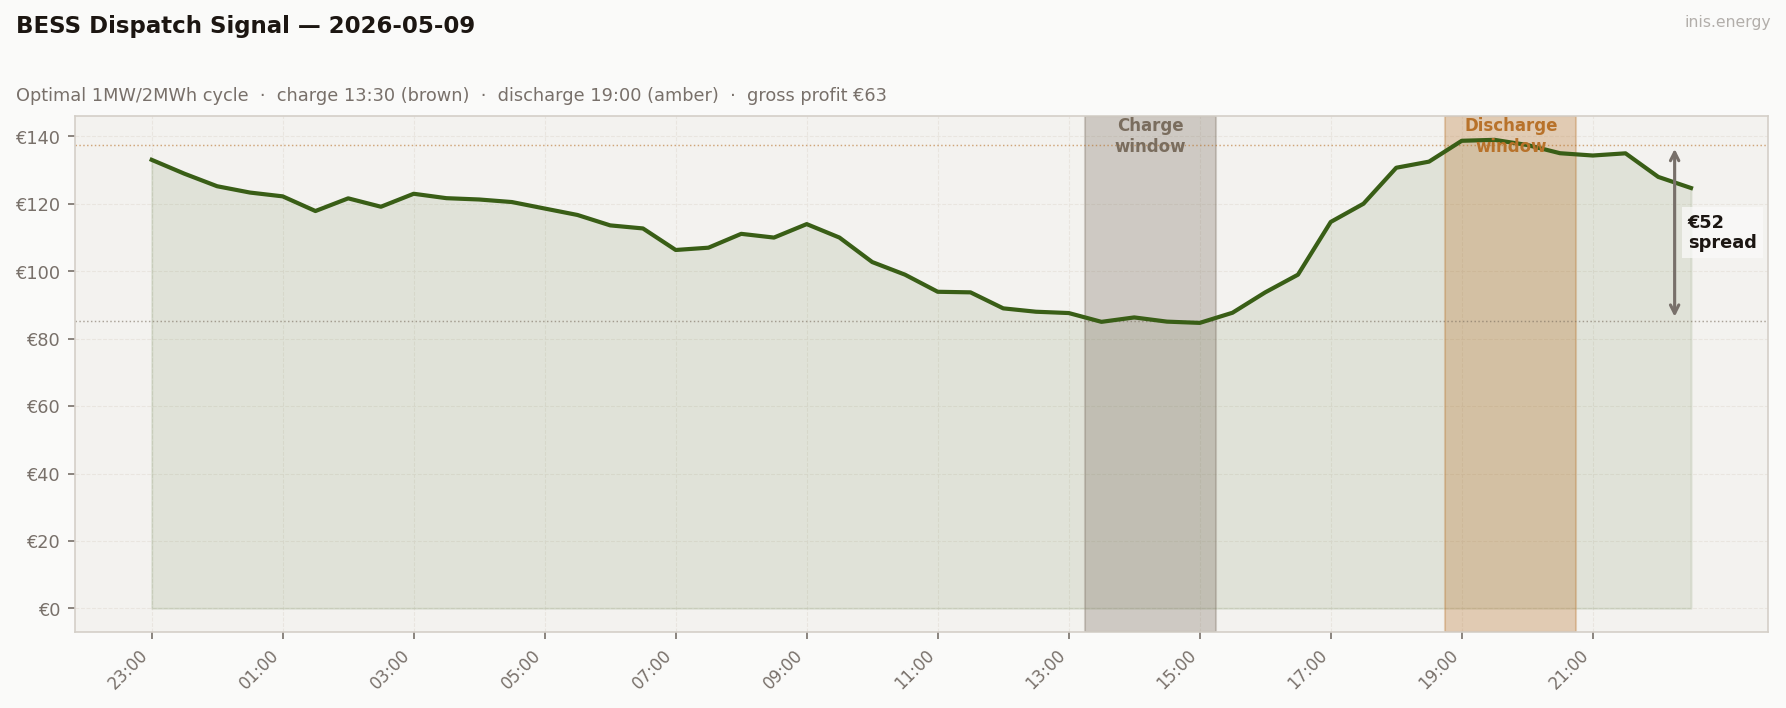
€63 gross, but the charge window is the story. Charged at 13:30 in the midday trough (€85), discharged into the 19:00 evening peak (€138). Every working day this run has charged overnight; the first weekend day charged midday. With 55–57% wind and weak demand, the cheap window moved from 03:00 to 13:30 — and the optimiser followed it. That’s not an anomaly; it’s a grid-state signal.
Commentary #
The first weekend of the run and the floor fell out. Mean dropped €50 from Friday to €113.41/MWh, no period cleared above €150 all day, and the peak/off-peak spread went negative for the first time in this series. The inversion is structural: the peak window is a calendar convention, not a price detection algorithm. On a Saturday with 57% wind and low demand, 07:00–22:00 catches the cheap midday hours instead of the expensive working ones; the off-peak overnight stays gas-marginal at €115–125 and ends up pricier.
Wind drove the price shape, as it has every day of this run. At 57% mean penetration and never below 39%, it was never going to be a working-week day. The morning ramp didn’t fire. The day’s minimum (€84.69) landed at 15:00 rather than at dawn — a midday trough rather than the overnight trough that has defined every weekday shape. With the system structurally long through the afternoon, 11 consecutive half-hours cleared below €100. This is the duck curve in preview: high renewable midday output, weak demand, a floor that simply gives way.
For storage, a moderate day with an important signal. A simulated 1MW/2MWh battery earned €63 gross — charged at 13:30 (midday, not 03:00), discharged at 19:00 (€138). On every working day this run the optimiser has charged overnight; today it charged midday, because that’s where the structurally long window moved to. As renewable share grows, that shift becomes the norm, not the exception.
The evening peak held but was contained at €139 — a capped peak on top of a collapsed floor. Tomorrow brings the same mean on a completely different shape.
Half-hourly data — 2026-05-09
| Period | Time | Price (€/MWh) | Wind % |
|---|---|---|---|
| 1 | 23:00 | 133.07 | 67.4% |
| 2 | 23:30 | 128.95 | 67.2% |
| 3 | 00:00 | 125.23 | 39.1% |
| 4 | 00:30 | 123.36 | 42.0% |
| 5 | 01:00 | 122.23 | 43.7% |
| 6 | 01:30 | 117.88 | 44.9% |
| 7 | 02:00 | 121.64 | 46.1% |
| 8 | 02:30 | 119.15 | 48.0% |
| 9 | 03:00 | 123.00 | 48.3% |
| 10 | 03:30 | 121.69 | 51.4% |
| 11 | 04:00 | 121.30 | 55.5% |
| 12 | 04:30 | 120.54 | 59.7% |
| 13 | 05:00 | 118.62 | 58.1% |
| 14 | 05:30 | 116.71 | 61.0% |
| 15 | 06:00 | 113.62 | 60.8% |
| 16 | 06:30 | 112.71 | 61.3% |
| 17 | 07:00 | 106.32 | 63.6% |
| 18 | 07:30 | 107.00 | 63.7% |
| 19 | 08:00 | 111.11 | 59.5% |
| 20 | 08:30 | 110.00 | 58.1% |
| 21 | 09:00 | 114.00 | 57.3% |
| 22 | 09:30 | 110.00 | 57.9% |
| 23 | 10:00 | 102.74 | 55.1% |
| 24 | 10:30 | 99.00 | 55.9% |
| 25 | 11:00 | 93.92 | 56.8% |
| 26 | 11:30 | 93.75 | 55.0% |
| 27 | 12:00 | 89.00 | 56.0% |
| 28 | 12:30 | 88.00 | 56.0% |
| 29 | 13:00 | 87.61 | 57.8% |
| 30 | 13:30 | 85.00 | 57.1% |
| 31 | 14:00 | 86.31 | 55.2% |
| 32 | 14:30 | 85.06 | 55.8% |
| 33 | 15:00 | 84.69 | 55.5% |
| 34 | 15:30 | 87.70 | 55.1% |
| 35 | 16:00 | 93.75 | 56.1% |
| 36 | 16:30 | 99.00 | 54.2% |
| 37 | 17:00 | 114.64 | 56.5% |
| 38 | 17:30 | 120.05 | 58.5% |
| 39 | 18:00 | 130.72 | 59.2% |
| 40 | 18:30 | 132.53 | 59.7% |
| 41 | 19:00 | 138.72 | 60.2% |
| 42 | 19:30 | 139.00 | 61.8% |
| 43 | 20:00 | 137.47 | 58.5% |
| 44 | 20:30 | 135.03 | 59.1% |
| 45 | 21:00 | 134.35 | 59.2% |
| 46 | 21:30 | 135.00 | 61.3% |
| 47 | 22:00 | 128.00 | 65.0% |
| 48 | 22:30 | 124.71 | 66.9% |
Compare your business electricity and gas rates in minutes with INIS Energy Brokers.
Compare rates