I-SEM Daily Briefing — 10 May 2026
Table of Contents
Market Snapshot
| Metric | Value |
|---|---|
| Mean DAM Price | €111.62/MWh |
| Median Price | €108.58/MWh |
| Std Dev | €23.63/MWh |
| Peak Price | €172.18/MWh (21:00) |
| Min Price | €81.09/MWh (14:30) |
| Price Range | €91.09/MWh |
| Periods above €150 | 3 of 48 (6%) |
| Periods above €200 | 0 of 48 (0%) |
| Peak Avg (07–22) | €107.94/MWh |
| Off-peak Avg (22–07) | €117.75/MWh |
| Peak/Off-Peak Spread | €-9.81/MWh |
| Wind % of Demand | 42.6% |
| Wind Range | 24.0%–73.9% |
| Mean Demand | 3444 MW |
Price Profile #
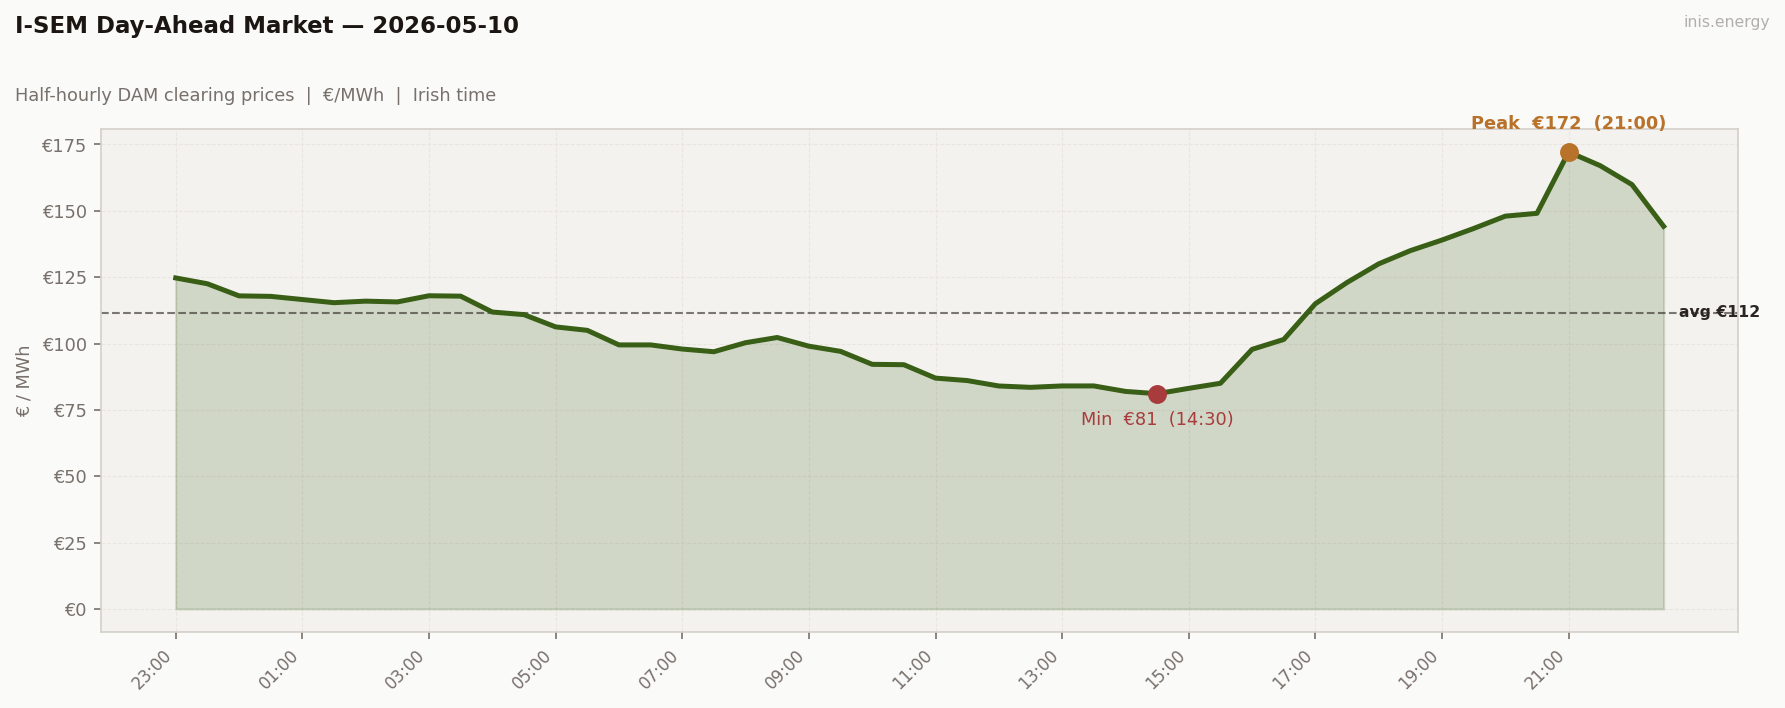
Std dev €23.63/MWh · Median €108.58/MWh · Periods above €150: 3 of 48 (6%)
Std dev €23.63 — 41% higher than Saturday’s €16.77, on a mean €2 lower. The number that separates the two weekend days isn’t the mean; it’s the distribution.
No morning ramp for the second straight day. 06:00 (€99.48) to 07:30 (€96.91): flat, barely moving. Weekend demand is absent again.
The shape splits into two halves. The first half (00:00–14:30) is all decline: wind at 67–74% overnight with minimal demand, prices drifting from €118 to €81 — a broad soft floor with nothing to lift it. The second half (14:30–21:00) is all recovery: wind decaying from 28% to 25%, demand climbing, prices stepping from €81 to €172 in six and a half hours. The evening build is €98 → €115 → €130 → €148 → €172 — a ramp, not a step.
Unlike any weekday this run, the day’s entire price range lives in the second half.
Price vs Wind #
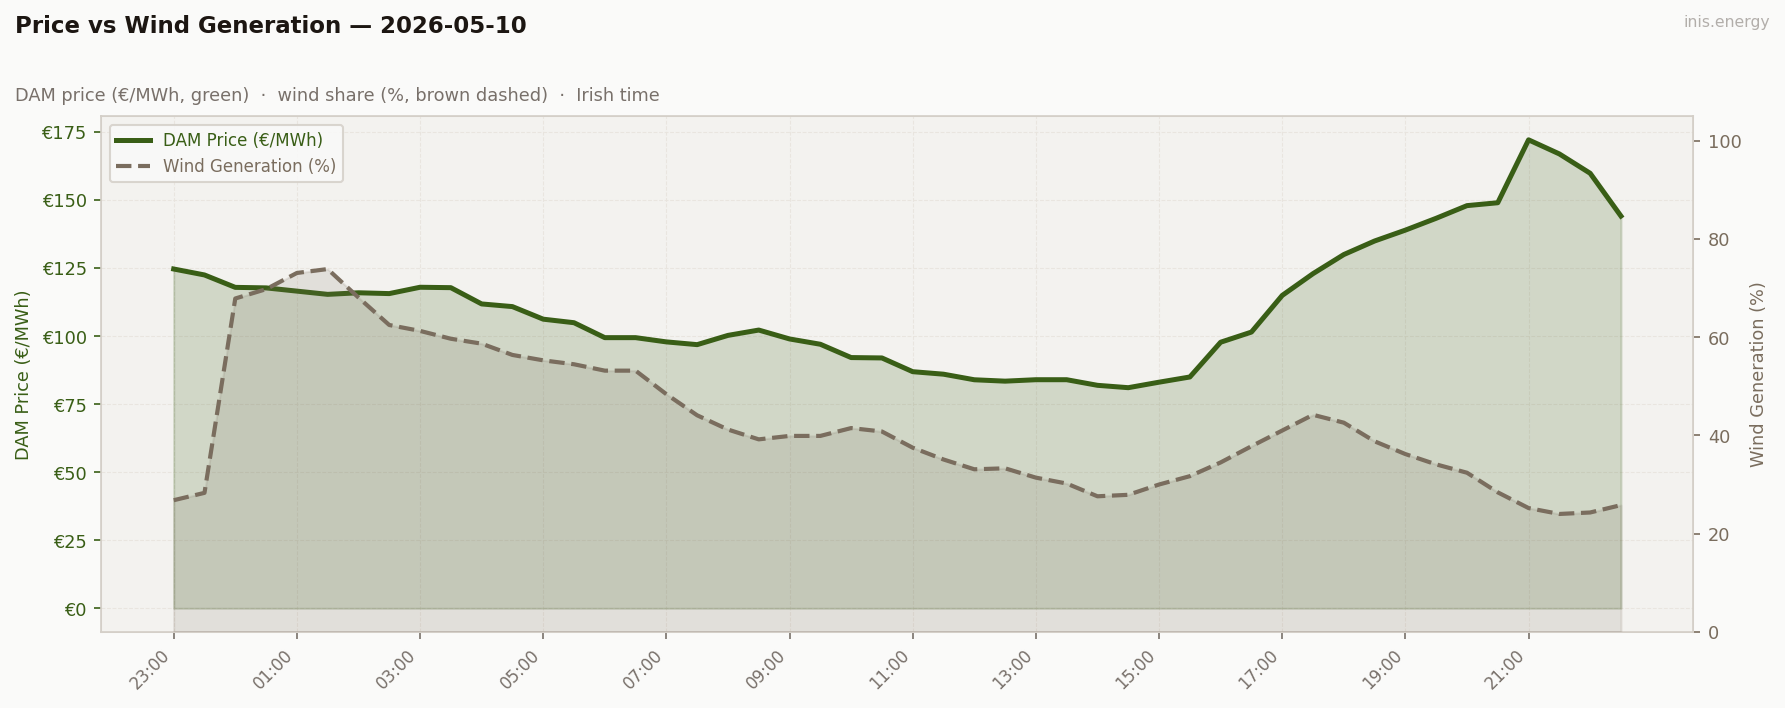
Mean wind: 42.6% · Range: 24.0%–73.9%
Range 24.0%–73.9% — the widest of the run. Two distinct wind regimes: overnight (67–74% at €115–125) and evening (24–28% at €148–172). The decay between them is steady and one-directional, and the price chart mirrors it exactly.
The inverse correlation here is as clean as May 7’s cannibalisation story, but running in the opposite temporal direction. On May 7, wind climbed during the day and prices fell. Today, wind fell during the day and prices rose. Same merit-order mechanic — as renewable supply contracts, the marginal plant moves up the curve. Same physics, different direction of travel.
For wind generators, today is the structural problem in its most legible form. Wind generated heavily at 67–74% when prices cleared at €115–125. Wind generated minimally at 24–28% when prices cleared at €148–172. Capture price today will sit well below the daily mean. Not because the market is broken — because the wind blew at the wrong time.
Week in Context #
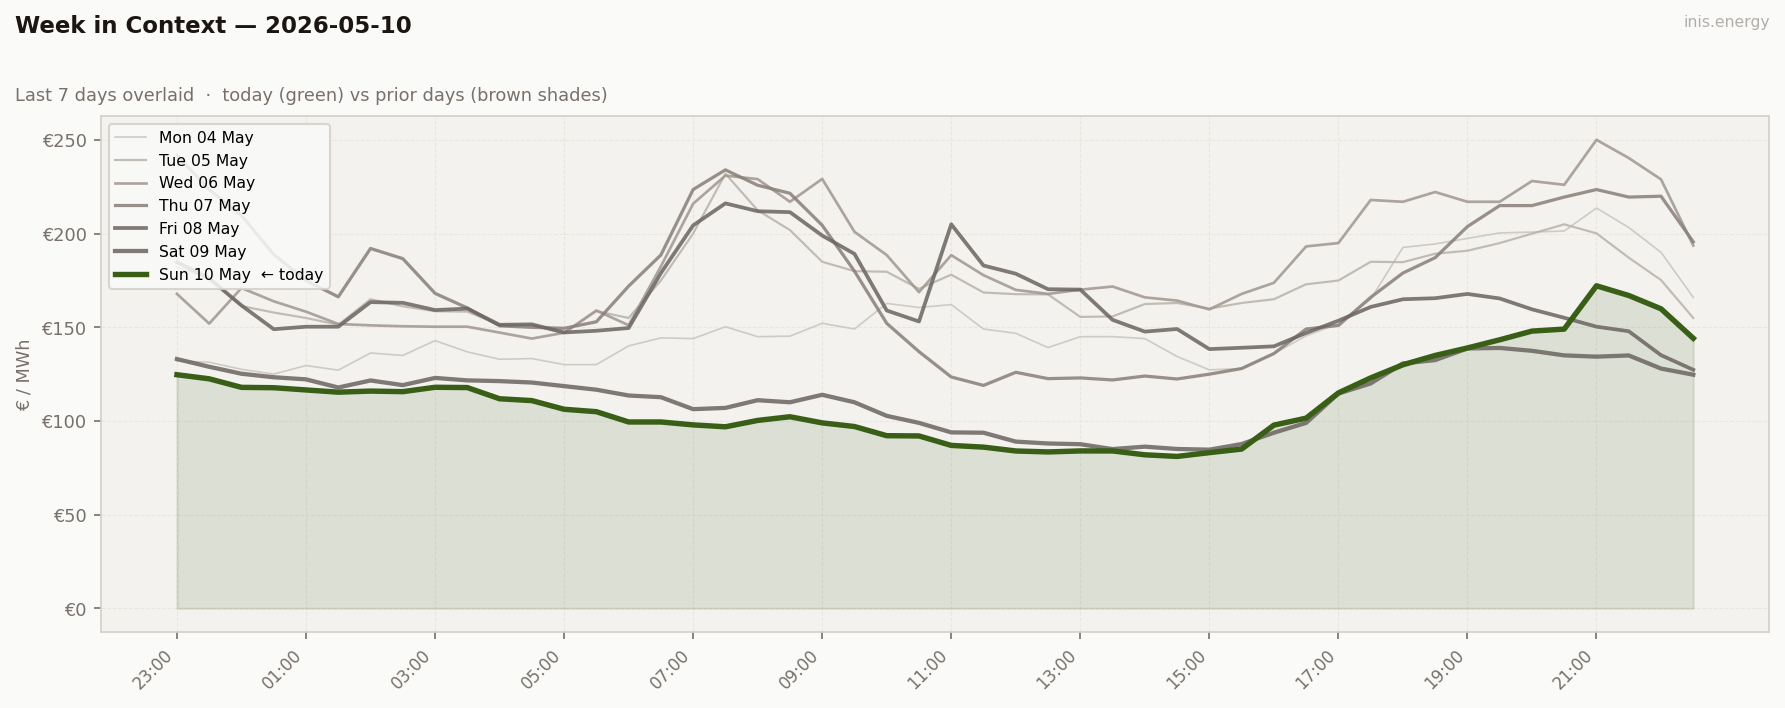
The second consecutive weekend day below €120 mean. The working week band (Mon–Fri, €113–185) and the weekend band (€81–172) are now both visible on the chart — the step-down from Friday is clear. Today’s range is wider than Saturday’s despite the similar mean; the evening recovery pulls the top end up while the midday trough holds the bottom down.
Price Duration Curve #
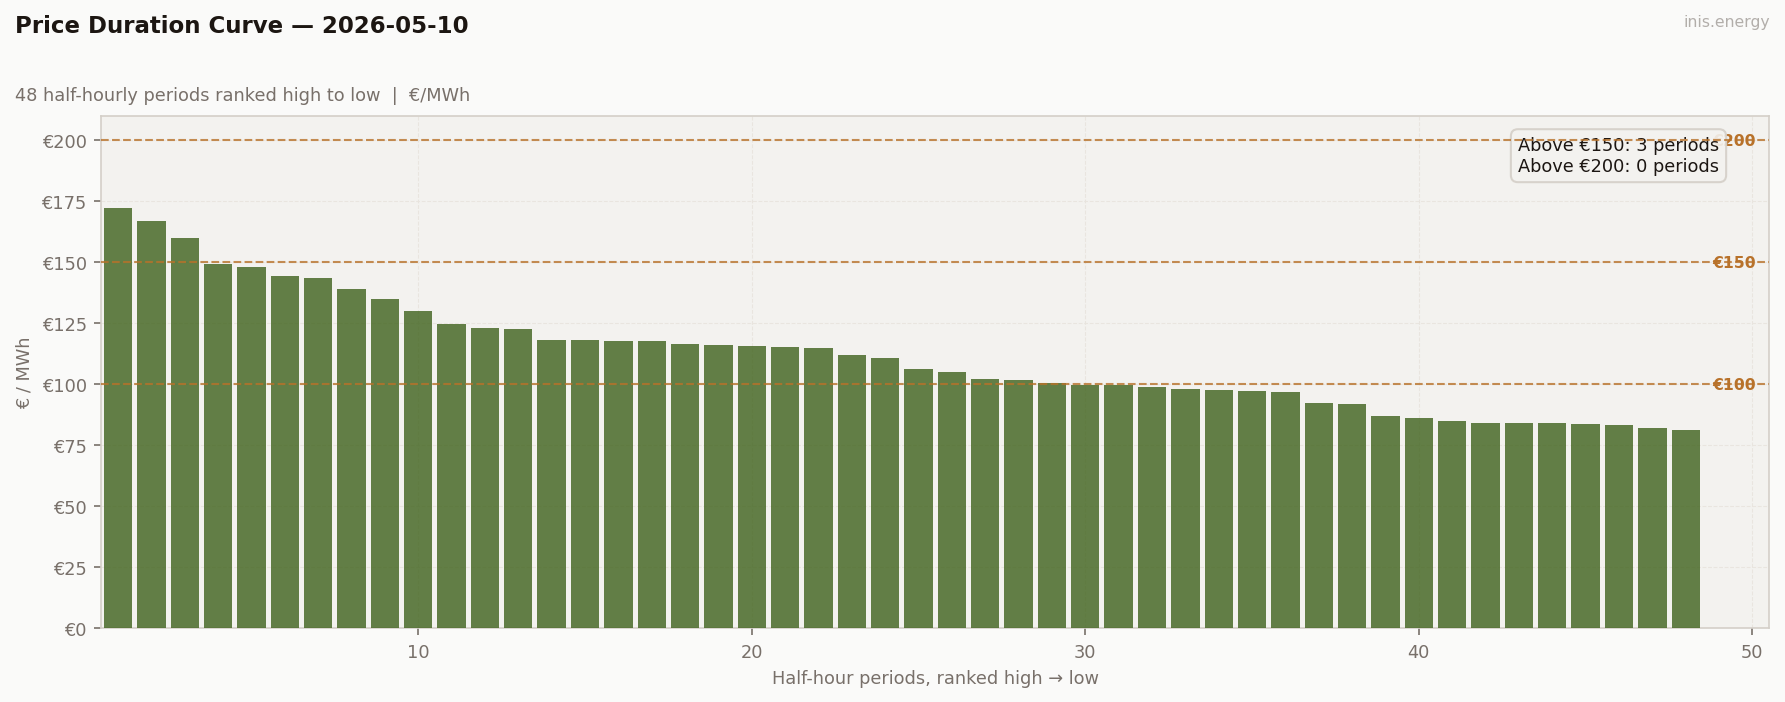
Periods above €150: 3 (6% of day) · Above €200: 0 (0% of day)
3 above €150 (the 21:00–22:00 evening cluster), 0 above €200. The curve has a top shoulder Saturday’s didn’t — three genuine evening-peak periods sitting above the main distribution.
Below that, a broad cheap belly: 18 half-hours below €100, spanning the morning and midday. Range €91 against Saturday’s €54, on a mean €2 lower. The same low average but a much wider spread — this is what the std dev difference (€16.77 → €23.63) looks like on a PDC.
Peak / Off-Peak Spread #
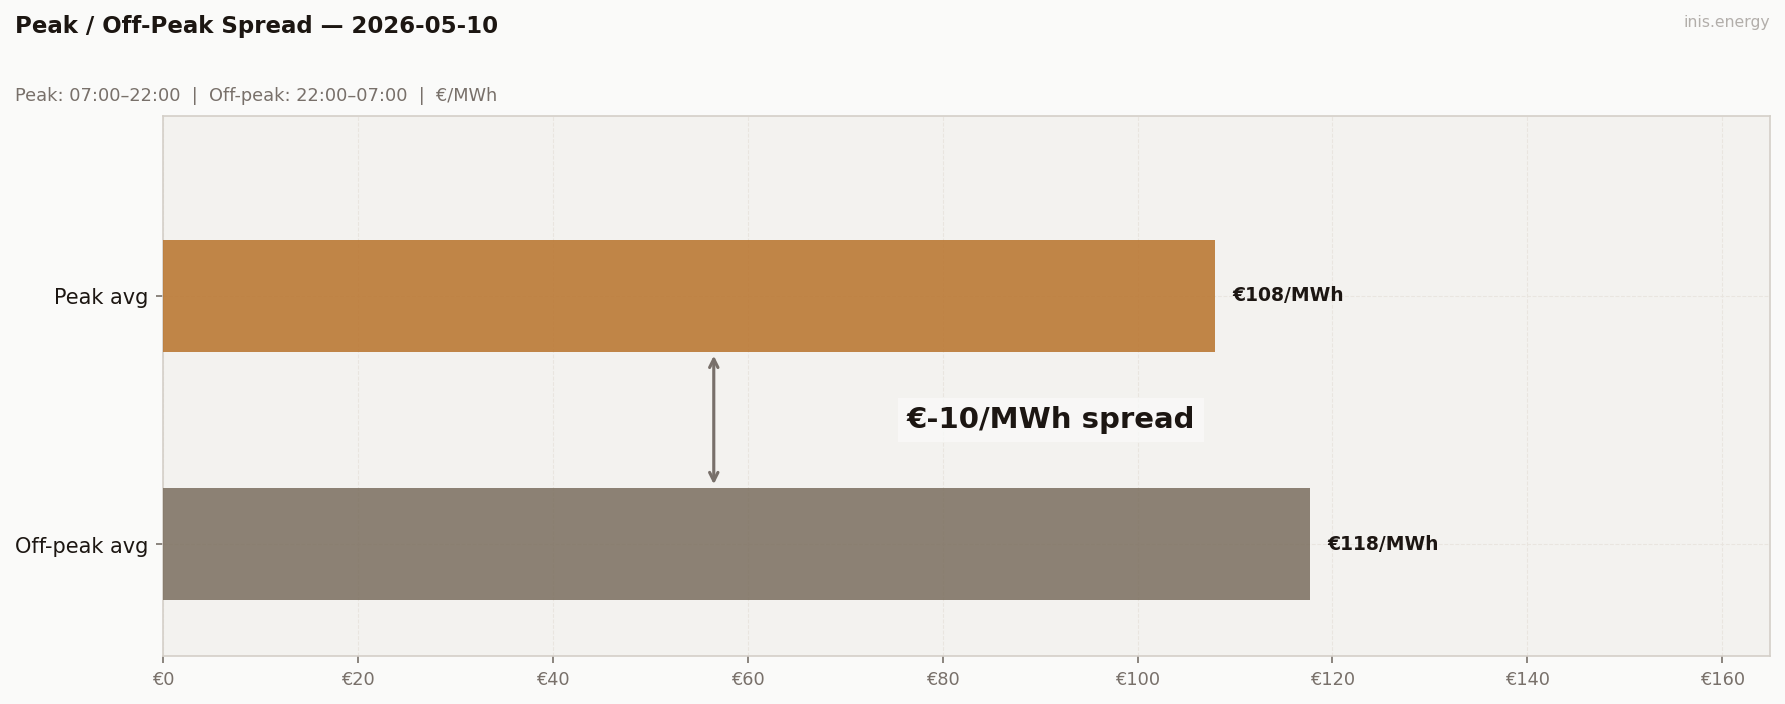
Peak avg (07:00–22:00): €107.94/MWh · Off-peak avg: €117.75/MWh · Spread: €-9.81/MWh
Second straight negative spread: peak €107.94, off-peak €117.75. The mechanics repeat from Saturday — the peak window catches the cheap morning and midday belly, the off-peak overnight holds at gas-marginal.
The margin is narrower than yesterday (€-9.81 vs €-13.42). The reason: three periods above €150 in the 21:00–22:00 window all sit inside the peak band and partly rescue the peak average. Without those three, today’s spread would have been more negative than Saturday’s.
Two consecutive negative spreads are a weekend pattern. A commercial product banded on peak/off-peak timing would have mispriced both days.
BESS Dispatch Signal #
| Price | Time | Energy | Value | |
|---|---|---|---|---|
| Charge | €83/MWh | 13:30 | 2 MWh | −€165 |
| Discharge | €162/MWh | 20:30 | 1.7 MWh (85% RTE) | +€275 |
| Gross profit | €110 | |||
| Price spread | €79/MWh | ROI: 66.9% |
Simulated 1MW/2MWh battery, one optimal DAM cycle. Gross before network charges and capacity costs.
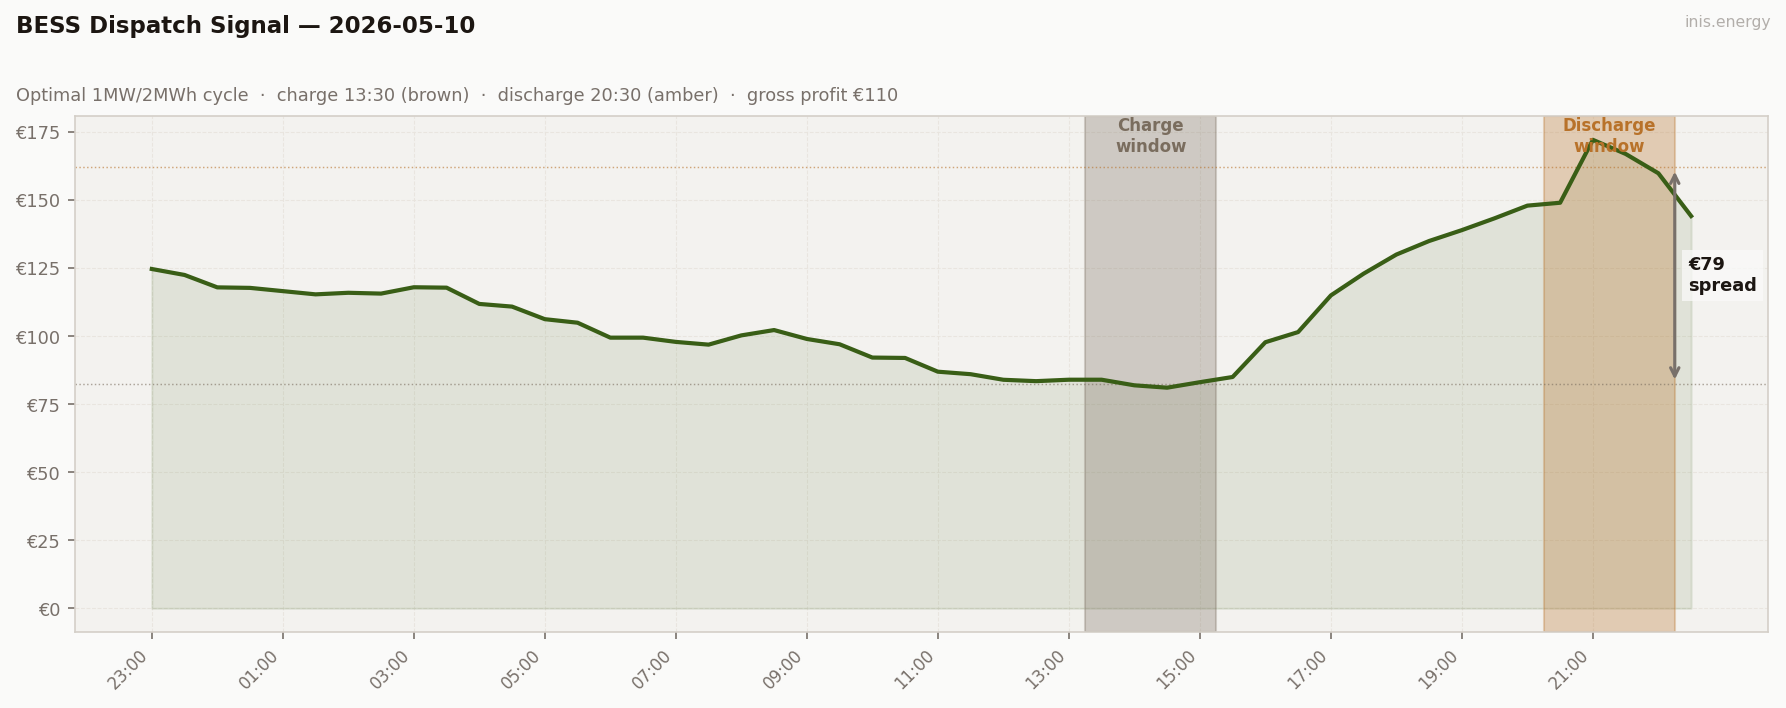
€110 gross — second best of the run, and the wind ramp-down built it. Charged at 13:30 in the midday trough (€83), discharged at 20:30 into the evening peak (€162). Same charge window as Saturday, later discharge to catch the deeper evening build. Captured spread €79. Yesterday’s mean was €2 higher than today’s; yesterday’s BESS gross was €47 lower. That’s the storage lesson in one line.
Commentary #
Sunday’s mean of €111.62/MWh was within €2 of Saturday’s — but it was a completely different market. Wind decayed from 73.9% at 01:30 to 24.0% by 21:30, and as it disappeared through the evening the peak rebuilt itself to €172 at 21:00. Range doubled to €91, std dev rose 41%, and a simulated battery earned €110 gross — 75% more than Saturday on a nearly identical mean.
Wind is the entire story, only the direction changed. Overnight, 67–74% wind with minimal demand kept prices at €115–125 — gas still marginal even with abundant renewables, because there wasn’t enough demand to move the clearing price up the curve. By 14:30 wind had fallen to 28% and the daily minimum landed at €81.09. From there, wind continued to decay exactly as residential demand climbed. The €97 → €172 evening ramp between 07:30 and 21:00 is the mirror of a weekday morning ramp, but driven by disappearing supply rather than rising demand. Same chart shape, different physics. A morning ramp is predictable from the calendar; an evening wind-ramp comes from the numerical weather prediction. For wind generators, cannibalisation at maximum bite — heavy generation at €115–125 overnight, minimal generation into the €150–172 evening peak. Capture price well below the daily mean.
For storage, the best day since Thursday. A simulated 1MW/2MWh battery earned €110 gross by exploiting exactly the trough-to-peak shape that wind’s misaligned output built — charged at 13:30 (€83), discharged at 20:30 (€162). Yesterday’s mean was €2 higher. Yesterday’s BESS gross was €47 lower. Storage doesn’t reward price levels; it rewards price shape.
Half-hourly data — 2026-05-10
| Period | Time | Price (€/MWh) | Wind % |
|---|---|---|---|
| 1 | 23:00 | 124.71 | 26.8% |
| 2 | 23:30 | 122.52 | 28.3% |
| 3 | 00:00 | 117.96 | 67.9% |
| 4 | 00:30 | 117.77 | 69.8% |
| 5 | 01:00 | 116.58 | 73.1% |
| 6 | 01:30 | 115.39 | 73.9% |
| 7 | 02:00 | 115.97 | 68.1% |
| 8 | 02:30 | 115.67 | 62.5% |
| 9 | 03:00 | 118.00 | 61.3% |
| 10 | 03:30 | 117.85 | 59.7% |
| 11 | 04:00 | 111.87 | 58.7% |
| 12 | 04:30 | 110.89 | 56.4% |
| 13 | 05:00 | 106.27 | 55.3% |
| 14 | 05:30 | 104.97 | 54.5% |
| 15 | 06:00 | 99.48 | 53.2% |
| 16 | 06:30 | 99.48 | 53.2% |
| 17 | 07:00 | 97.92 | 48.4% |
| 18 | 07:30 | 96.91 | 44.1% |
| 19 | 08:00 | 100.31 | 41.2% |
| 20 | 08:30 | 102.27 | 39.2% |
| 21 | 09:00 | 99.00 | 39.9% |
| 22 | 09:30 | 97.05 | 39.9% |
| 23 | 10:00 | 92.16 | 41.5% |
| 24 | 10:30 | 92.02 | 40.8% |
| 25 | 11:00 | 86.97 | 37.5% |
| 26 | 11:30 | 86.05 | 35.1% |
| 27 | 12:00 | 84.00 | 33.1% |
| 28 | 12:30 | 83.49 | 33.3% |
| 29 | 13:00 | 84.02 | 31.4% |
| 30 | 13:30 | 84.02 | 30.2% |
| 31 | 14:00 | 81.96 | 27.6% |
| 32 | 14:30 | 81.09 | 27.9% |
| 33 | 15:00 | 83.11 | 30.0% |
| 34 | 15:30 | 85.02 | 31.7% |
| 35 | 16:00 | 97.80 | 34.5% |
| 36 | 16:30 | 101.53 | 37.8% |
| 37 | 17:00 | 115.00 | 41.0% |
| 38 | 17:30 | 123.00 | 44.2% |
| 39 | 18:00 | 130.02 | 42.6% |
| 40 | 18:30 | 135.00 | 38.8% |
| 41 | 19:00 | 139.00 | 36.2% |
| 42 | 19:30 | 143.35 | 34.1% |
| 43 | 20:00 | 148.00 | 32.4% |
| 44 | 20:30 | 149.06 | 28.4% |
| 45 | 21:00 | 172.18 | 25.2% |
| 46 | 21:30 | 167.00 | 24.0% |
| 47 | 22:00 | 159.89 | 24.3% |
| 48 | 22:30 | 144.17 | 25.8% |
Compare your business electricity and gas rates in minutes with INIS Energy Brokers.
Compare rates