I-SEM Daily Briefing — 11 May 2026
Table of Contents
Market Snapshot
| Metric | Value |
|---|---|
| Mean DAM Price | €137.93/MWh |
| Median Price | €125.84/MWh |
| Std Dev | €27.7/MWh |
| Peak Price | €195.39/MWh (21:00) |
| Min Price | €112.0/MWh (03:30) |
| Price Range | €83.39/MWh |
| Periods above €150 | 12 of 48 (25%) |
| Periods above €200 | 0 of 48 (0%) |
| Peak Avg (07–22) | €146.79/MWh |
| Off-peak Avg (22–07) | €123.17/MWh |
| Peak/Off-Peak Spread | €23.62/MWh |
| Wind % of Demand | 23.2% |
| Wind Range | 17.4%–32.1% |
| Mean Demand | 3810 MW |
Price Profile #
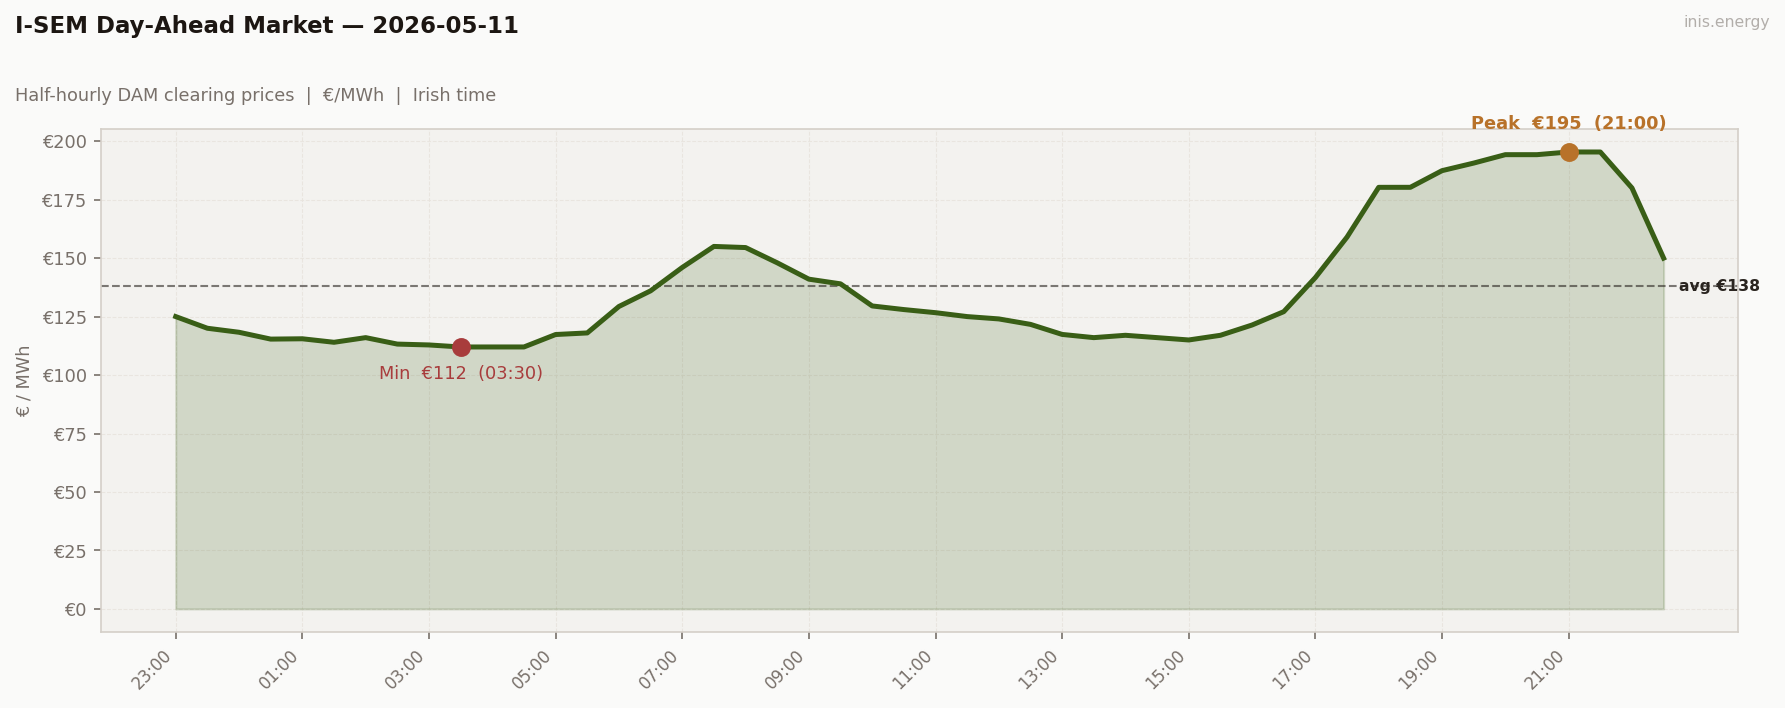
Std dev €27.7/MWh · Median €125.84/MWh · Periods above €150: 12 of 48 (25%)
The working week restored the shape on day one. Overnight trough (03:00–04:30 at €112) → morning ramp (06:00 €129 → 07:30 €155, +€26 in 90 minutes) → midday softness (12:00–15:00 at €115–124) → evening build (17:30 €159 → 18:00 €180 → 21:00 €195). The double-peak structure is back.
The morning ramp is smaller than earlier in the week — May 5 added €85, May 6 added €80, today added €26. Wind held flat at 22–25% through the ramp window, so this is demand-driven rather than wind-driven: commercial and industrial load coming online, not a wind collapse.
The evening build is steep and sustained: €127 at 16:30 to €195 at 21:00, with the sharpest single move between 17:00 (€142) and 18:00 (€180) — €38 in one half-hour pair. Wind was falling through this window (24% → 18%), so supply and demand were compounding simultaneously.
Zero periods above €200. The day was expensive but not scarce. Mid-merit gas was sufficient in every period.
Price vs Wind #
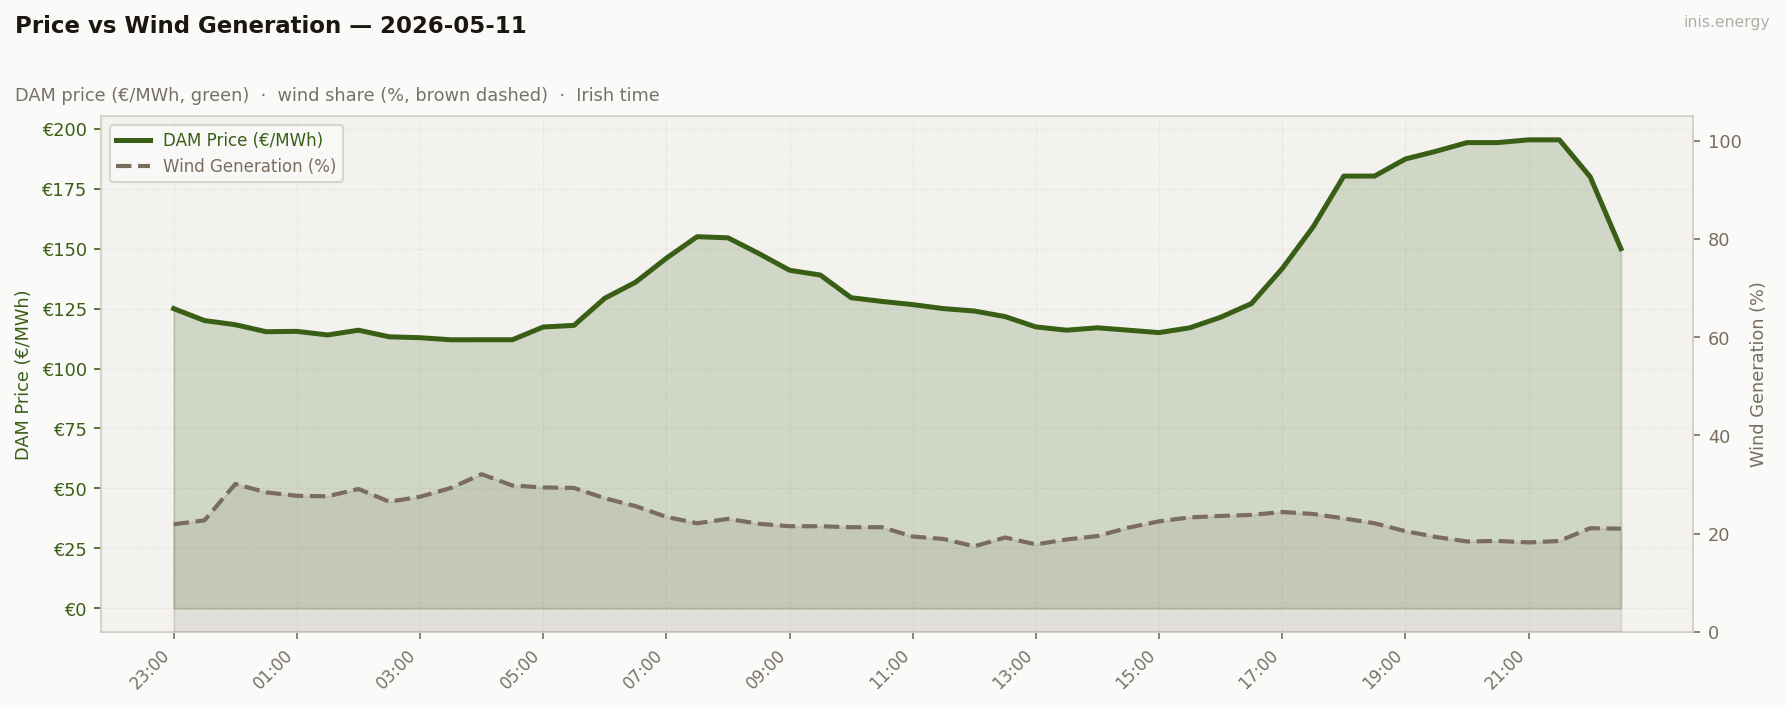
Mean wind: 23.2% · Range: 17.4%–32.1%
Range 17.4%–32.1% — the narrowest of the run by a significant margin. Wind was low and stable all day: no cannibalisation story, no wind-driven trough, no capture price anomaly. Gas sets the clearing price in every period.
This is the thermal-marginal regime. With wind locked in a 15-point band and gas marginal across all 48 half-hours, price movements track demand directly: up with the morning, soft at midday, up with the evening. The wind line barely registers as a chart feature — it moves slightly but drives nothing. In the thermal-marginal regime, fuel cost flows straight to the clearing price across the whole day.
The contrast with the two preceding days is sharp. Saturday had wind ranging 39–67% with prices suppressed flat. Sunday had wind ranging 24–74% and a dramatic evening build. Today had wind ranging 17–32% and a conventional working-day shape. In each case, the wind chart is the explanation.
Week in Context #
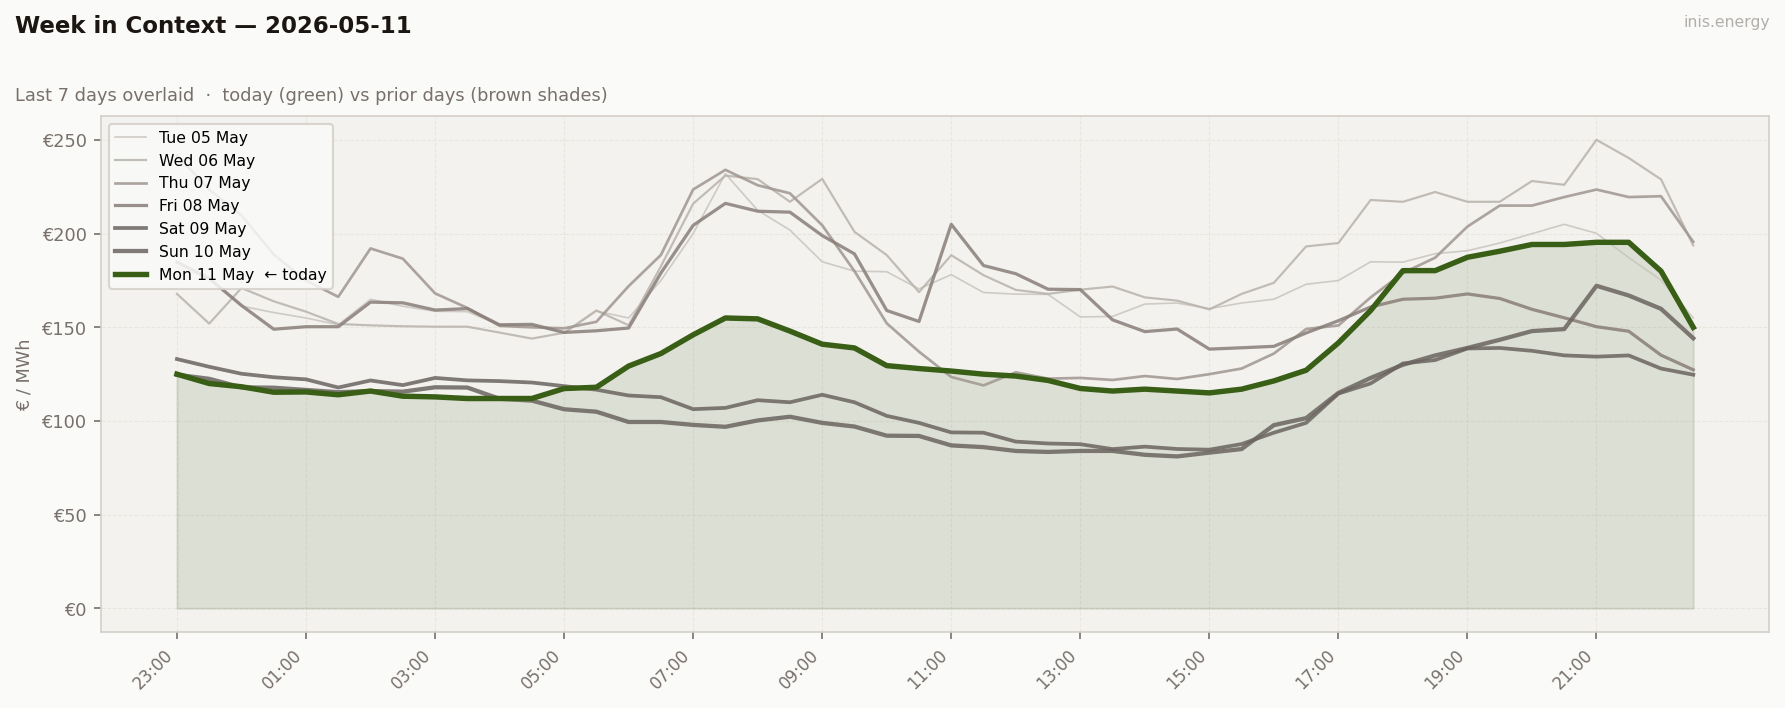
A full week of data now in view. The chart should show the arc: Mon 4 elevated (€152), the midweek peak (Wed €185), the working-week decline (Thu–Fri), the weekend collapse (€111–113), and today’s recovery to €138. The Mon-to-Mon comparison is directly readable — today’s line should sit roughly €15 below May 4’s across all hours, with a notably softer morning ramp.
Price Duration Curve #
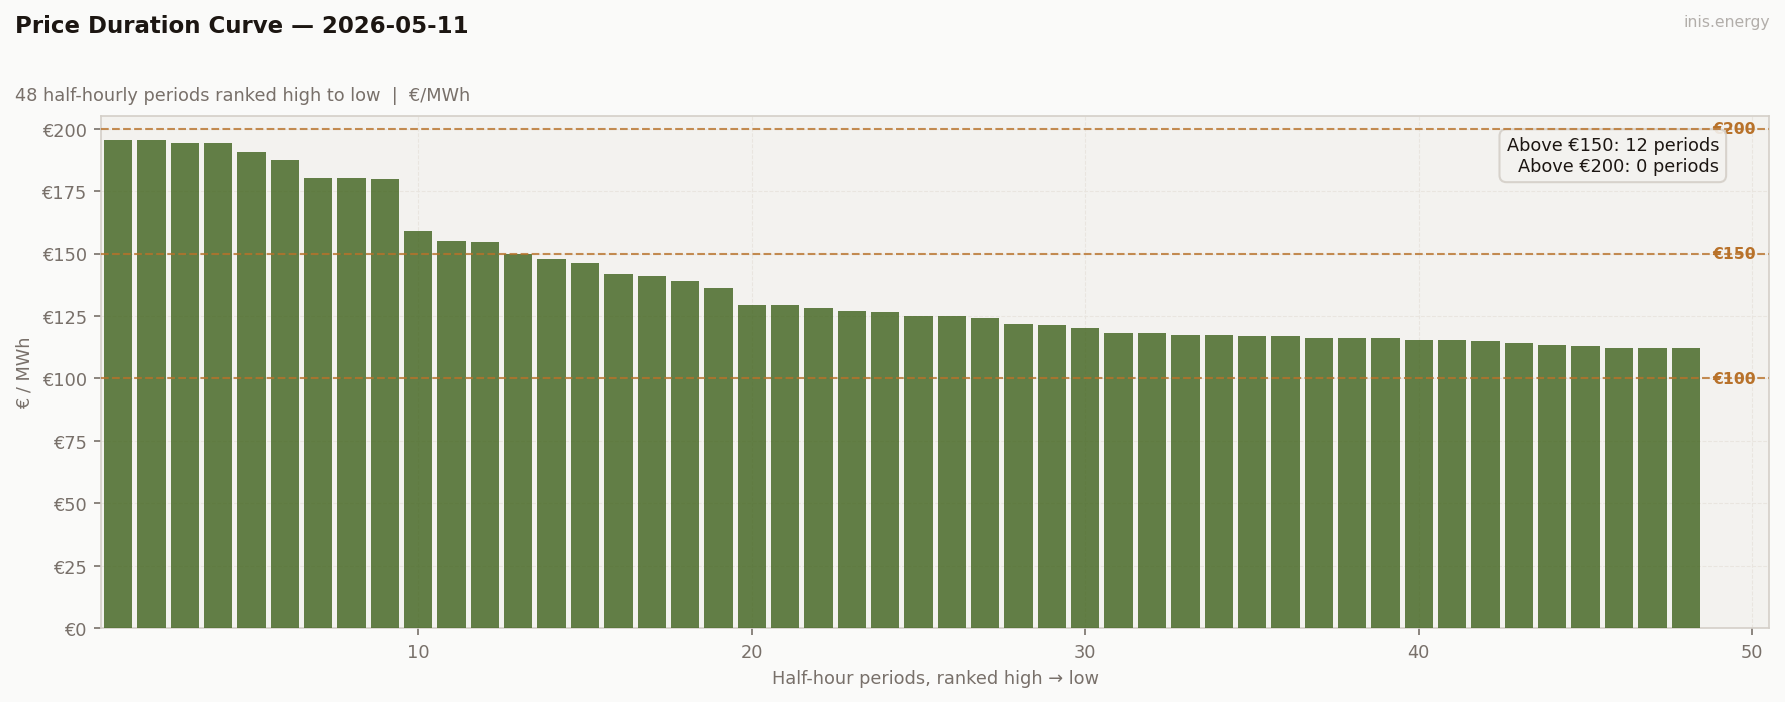
Periods above €150: 12 (25% of day) · Above €200: 0 (0% of day)
12 above €150 (25% of the day), 0 above €200. The curve has a clean top shoulder — the 17:30–22:30 evening peak block — sitting above a broad mid-section.
25% of the day above €150 puts today in the middle of the run: more expensive than the weekend, less than Wed–Thu. The absence of any €200+ periods is the telling number. The day was uniformly elevated but never tight; mid-merit gas was sufficient in every period. Compare to May 4 (bank holiday Monday), which had roughly 30 periods above €150 — a wind difference of 10 percentage points accounts for the gap.
Peak / Off-Peak Spread #
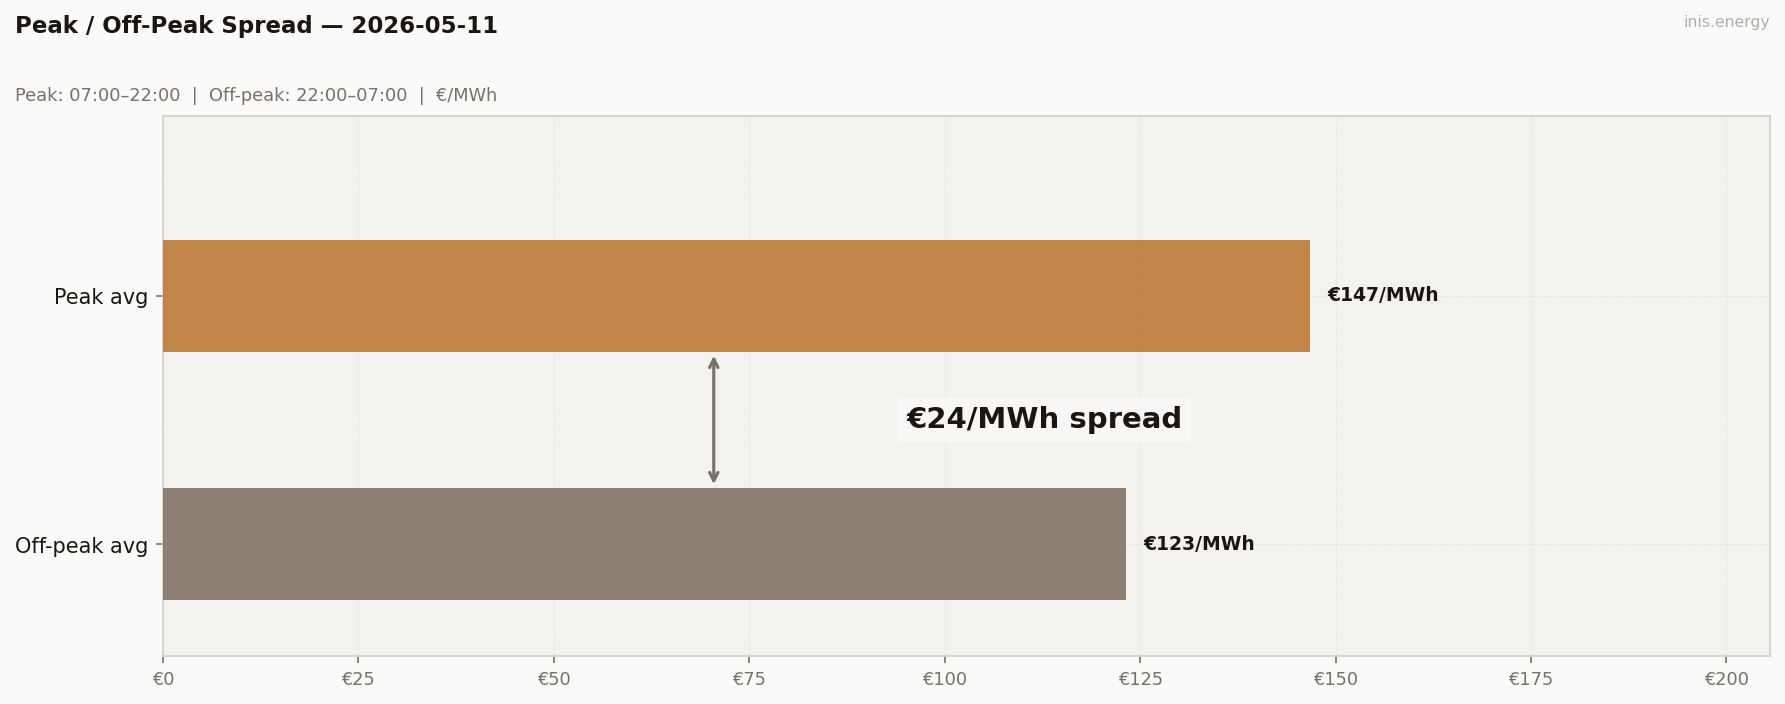
Peak avg (07:00–22:00): €146.79/MWh · Off-peak avg: €123.17/MWh · Spread: €23.62/MWh
Back to positive after two negative weekend days: peak €146.79, off-peak €123.17. The conventional weekday structure returns.
The spread is modest — a good working-day spread is €60–100+. The reason: the off-peak window is dragged up by sustained gas-marginal overnight (€112–125 from 00:00–05:30), while the peak window contains plenty of soft midday hours (€115–130 from 10:00–16:30) alongside the genuine evening peak.
Like May 5’s €20.93, today’s true arbitrage spread is €23.62, not the €83.39 headline range. The range is what the chart shows; the window-average spread is what the economics allow.
BESS Dispatch Signal #
| Price | Time | Energy | Value | |
|---|---|---|---|---|
| Charge | €112/MWh | 03:00 | 2 MWh | −€224 |
| Discharge | €195/MWh | 20:00 | 1.7 MWh (85% RTE) | +€331 |
| Gross profit | €107 | |||
| Price spread | €83/MWh | ROI: 47.6% |
Simulated 1MW/2MWh battery, one optimal DAM cycle. Gross before network charges and capacity costs.
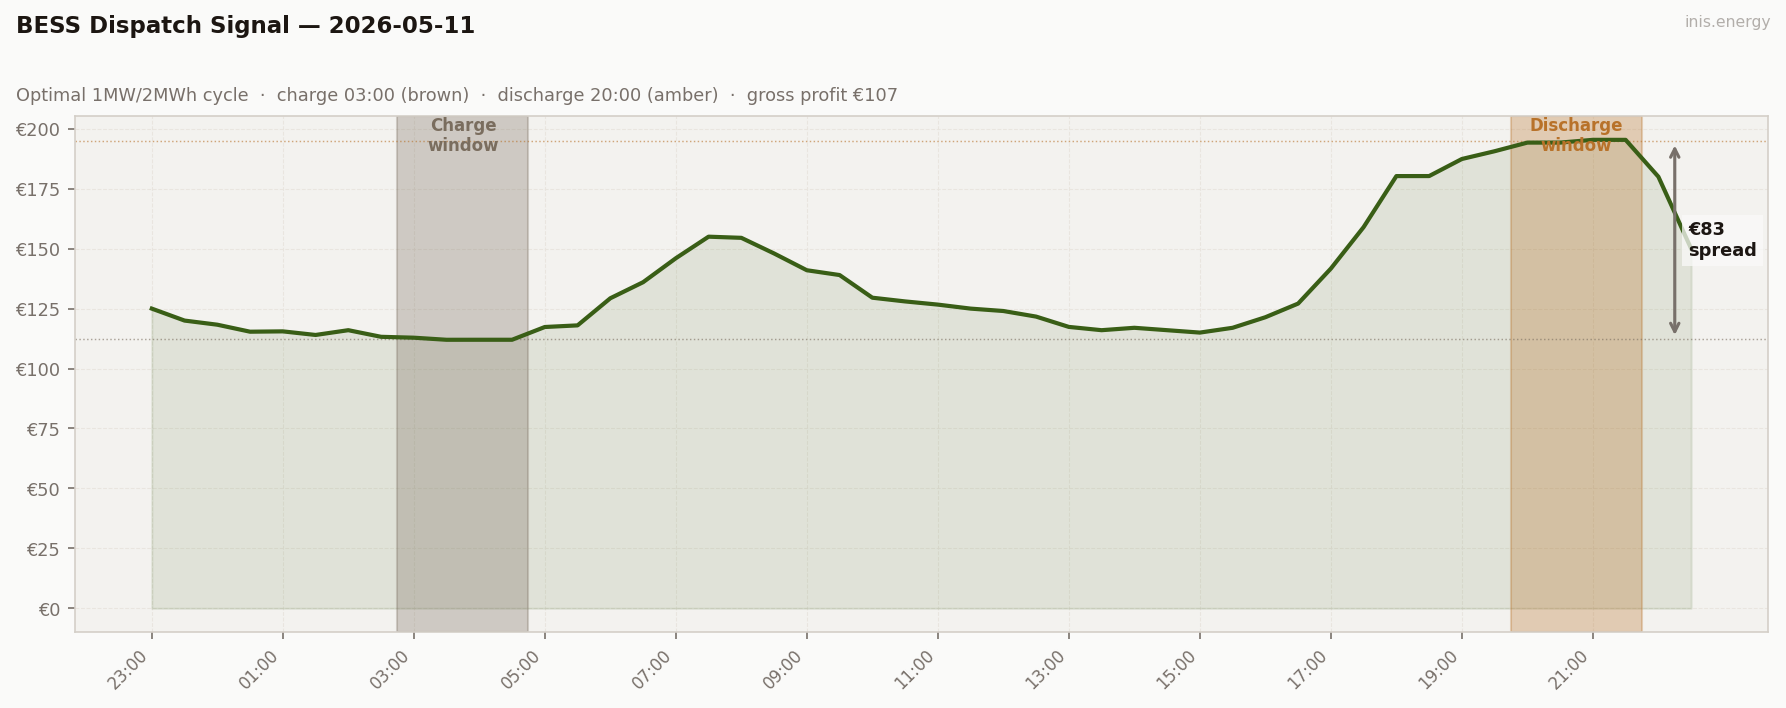
€107 gross. Charged at 03:00 (€112), discharged at 20:00 (€195), capturing €83 of spread. The charge window returned overnight — the first time since Friday. With working-day demand back and wind at only 23%, the midday wasn’t cheap enough to displace the overnight trough. In three consecutive days: 13:30 (Saturday), 13:30 (Sunday), 03:00 (Monday). The optimiser didn’t change strategy; the grid changed market state.
Commentary #
The working week returned and immediately restored the conventional shape. Demand climbed 11% to 3,810 MW, wind dropped to 23.2%, and the result was the first classic working-day double-peak since Friday: overnight trough at 03:30 (€112), morning ramp to €155 at 07:30, evening peak at €195 at 21:00. Peak/off-peak spread came back to positive €23.62 after two negative weekend days. The structure is familiar; the level is lower than you might expect.
The Monday-to-Monday comparison is the sharpest single illustration of what wind does to price level in this market. May 4, bank holiday Monday: 13% wind, 3,633 MW demand, €152.58 mean. May 11, working Monday: 23.2% wind, 3,810 MW demand, €137.93 mean. A working day with 177 MW more demand cleared €15/MWh cheaper — because in the thermal-marginal regime, wind determines which plants set the clearing price. The gap between 13% and 23% wind is the gap between peakers and mid-merit gas holding the floor. May 4 paid a low-wind premium that higher working-day demand couldn’t close.
For storage, €107 gross — practically identical to Sunday’s €110 on a €26 higher mean. The captured spread was €83 today versus €79 yesterday; almost the same number. The dispatch swing is the structural signal: in three consecutive days the optimal charge window moved 13:30 → 13:30 → 03:00. The optimiser didn’t change strategy; the grid changed market state. A renewable-rich weekend is structurally long at midday; a thermal-marginal working week is structurally long overnight. A real BESS operator needs both in their book, and a forecast layer that picks between them.
Half-hourly data — 2026-05-11
| Period | Time | Price (€/MWh) | Wind % |
|---|---|---|---|
| 1 | 23:00 | 125.00 | 21.9% |
| 2 | 23:30 | 120.01 | 22.7% |
| 3 | 00:00 | 118.29 | 30.1% |
| 4 | 00:30 | 115.37 | 28.4% |
| 5 | 01:00 | 115.51 | 27.7% |
| 6 | 01:30 | 114.01 | 27.6% |
| 7 | 02:00 | 116.00 | 29.1% |
| 8 | 02:30 | 113.24 | 26.5% |
| 9 | 03:00 | 112.87 | 27.5% |
| 10 | 03:30 | 112.00 | 29.3% |
| 11 | 04:00 | 112.01 | 32.1% |
| 12 | 04:30 | 112.01 | 29.8% |
| 13 | 05:00 | 117.33 | 29.4% |
| 14 | 05:30 | 118.01 | 29.3% |
| 15 | 06:00 | 129.32 | 27.2% |
| 16 | 06:30 | 136.01 | 25.6% |
| 17 | 07:00 | 146.01 | 23.4% |
| 18 | 07:30 | 155.00 | 22.1% |
| 19 | 08:00 | 154.52 | 23.0% |
| 20 | 08:30 | 148.00 | 22.0% |
| 21 | 09:00 | 141.00 | 21.5% |
| 22 | 09:30 | 139.00 | 21.5% |
| 23 | 10:00 | 129.55 | 21.3% |
| 24 | 10:30 | 128.00 | 21.3% |
| 25 | 11:00 | 126.67 | 19.4% |
| 26 | 11:30 | 125.00 | 18.9% |
| 27 | 12:00 | 124.00 | 17.4% |
| 28 | 12:30 | 121.67 | 19.2% |
| 29 | 13:00 | 117.37 | 17.8% |
| 30 | 13:30 | 116.00 | 18.8% |
| 31 | 14:00 | 117.00 | 19.5% |
| 32 | 14:30 | 116.00 | 21.2% |
| 33 | 15:00 | 115.00 | 22.5% |
| 34 | 15:30 | 117.00 | 23.3% |
| 35 | 16:00 | 121.40 | 23.6% |
| 36 | 16:30 | 127.10 | 23.8% |
| 37 | 17:00 | 141.70 | 24.4% |
| 38 | 17:30 | 159.00 | 24.0% |
| 39 | 18:00 | 180.27 | 23.1% |
| 40 | 18:30 | 180.28 | 22.1% |
| 41 | 19:00 | 187.40 | 20.5% |
| 42 | 19:30 | 190.64 | 19.3% |
| 43 | 20:00 | 194.24 | 18.4% |
| 44 | 20:30 | 194.24 | 18.5% |
| 45 | 21:00 | 195.39 | 18.2% |
| 46 | 21:30 | 195.38 | 18.5% |
| 47 | 22:00 | 180.00 | 21.1% |
| 48 | 22:30 | 150.00 | 21.0% |
Compare your business electricity and gas rates in minutes with INIS Energy Brokers.
Compare rates