I-SEM Daily Briefing — 12 May 2026
Table of Contents
Market Snapshot
| Metric | Value |
|---|---|
| Mean DAM Price | €112.48/MWh |
| Median Price | €112.28/MWh |
| Std Dev | €20.34/MWh |
| Peak Price | €161.7/MWh (23:00) |
| Min Price | €79.4/MWh (15:00) |
| Price Range | €82.3/MWh |
| Periods above €150 | 1 of 48 (2%) |
| Periods above €200 | 0 of 48 (0%) |
| Peak Avg (07–22) | €107.69/MWh |
| Off-peak Avg (22–07) | €120.47/MWh |
| Peak/Off-Peak Spread | €-12.78/MWh |
| Wind % of Demand | 47.4% |
| Wind Range | 22.9%–65.6% |
| Mean Demand | 3767 MW |
Price Profile #
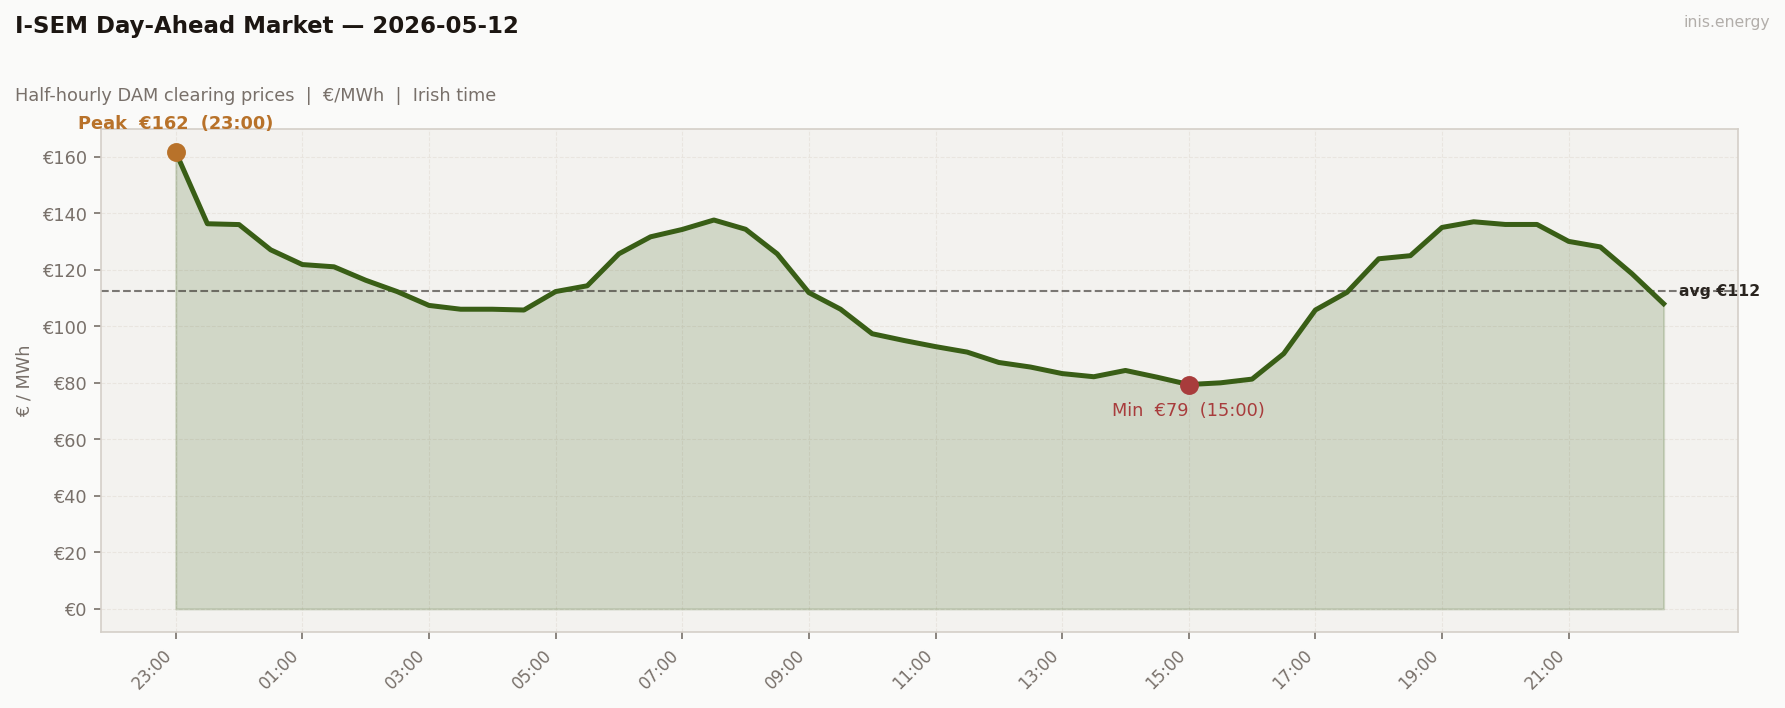
Std dev €20.34/MWh · Median €112.28/MWh · Periods above €150: 1 of 48 (2%)
The headline stat is misleading. The peak of €161.70 prints at 23:00 — period 1 of the delivery day — which is the tail of Monday’s evening, already fading from €195 by the time this file opens. The I-SEM delivery day runs from 23:00 the prior evening to 22:30 of the named date: eight borrowed half-hours of yesterday’s evening, then forty half-hours of the named date. Worth understanding once and noting here; from here it won’t come up every post.
The actual May 12 shape is conventional and wind-heavy. Morning ramp: 05:00 (€112) → 07:30 (€138), +€26 in 2.5 hours — the softest working-day ramp of the run. Wind held 35–44% through that window; the marginal plant didn’t have to climb far. Then the floor fell away. €100 arrived at 09:30, €85 by noon, €79.40 at 15:00. 13 consecutive half-hours below €100 from 10:00 to 16:30, sustained 54–56% wind pushing mid-merit gas down the dispatch stack. The cheapest working-day window of the run.
The evening peak proper — the actual May 12 evening — ran €130–137 from 19:00 to 20:30. Contained, no scarcity, wind still at 55–57%. Three features, three reads: the 23:00 spike is yesterday’s residue, the morning ramp is wind-muted, and the evening peak is unremarkable. Take the headline stat with the boundary footnote.
Price vs Wind #
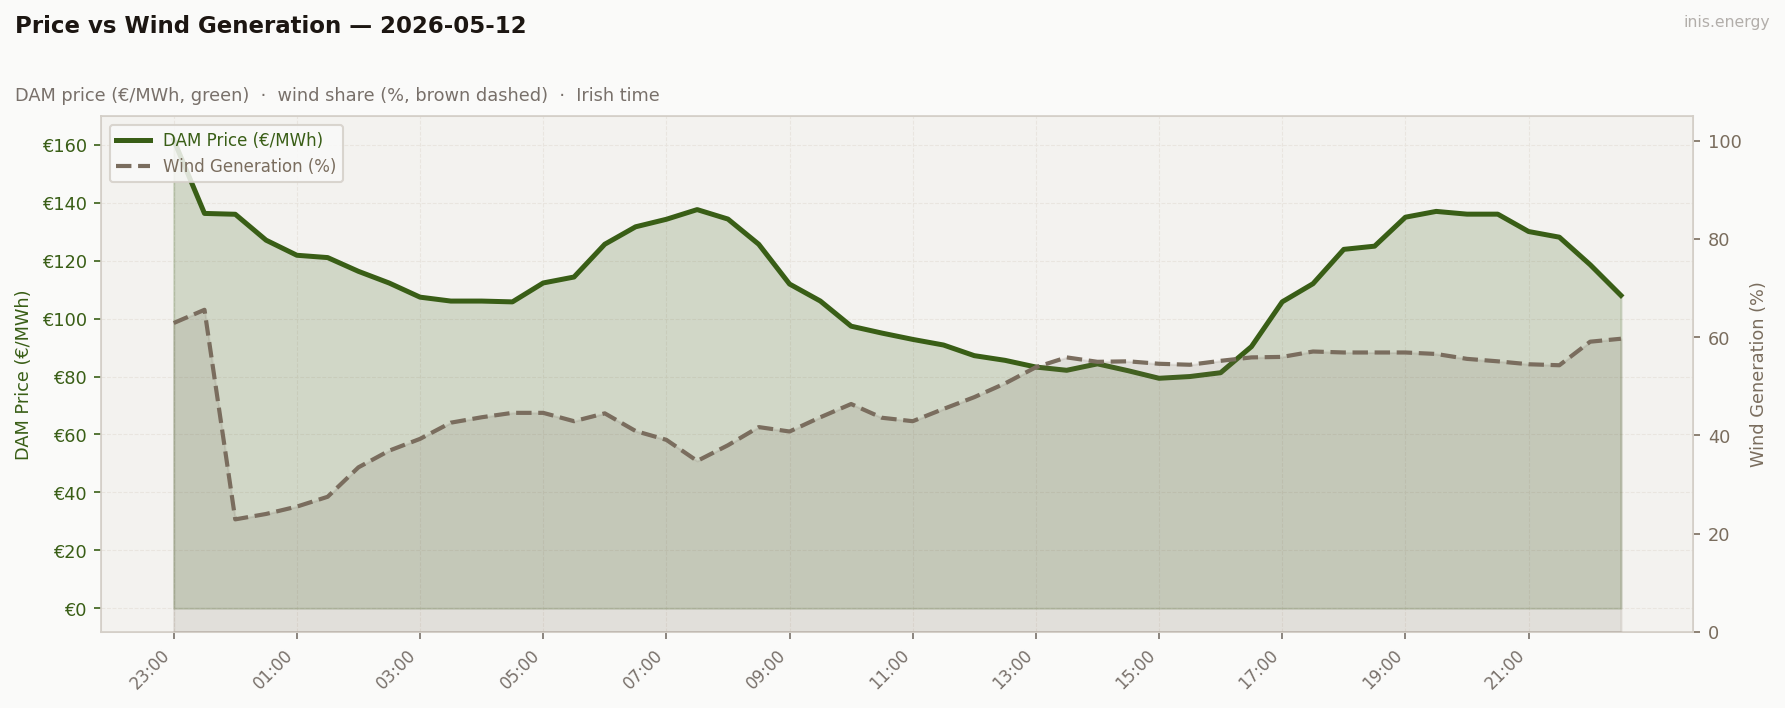
Mean wind: 47.4% · Range: 22.9%–65.6%
Wind drove the day, with one anomaly worth flagging. The official range is 22.9%–65.6%, but the 22.9% reading at 00:00 is almost certainly a data artefact: period 2 (23:30) shows 65.6%, period 3 (00:00) shows 22.9%, period 4 (00:30) shows 24.0%. A 43-point system-level collapse in a single half-hour doesn’t happen physically. Treat any cannibalisation arithmetic for that hour with caution; the rest of the day’s wind series is internally consistent.
Through the actual working day, wind was strong and well-timed: 35–44% during the morning ramp (prices €112–138), 54–56% through the midday trough (prices €79–95), 55–57% through the evening build (prices €112–137). Wind generated heavily during both the cheap midday and around the 23:00 boundary spike — those two periods roughly cancel each other for capture-price purposes. Wind’s capture rate today sits close to the daily mean, marginally below. A neutral cannibalisation day.
Week in Context #
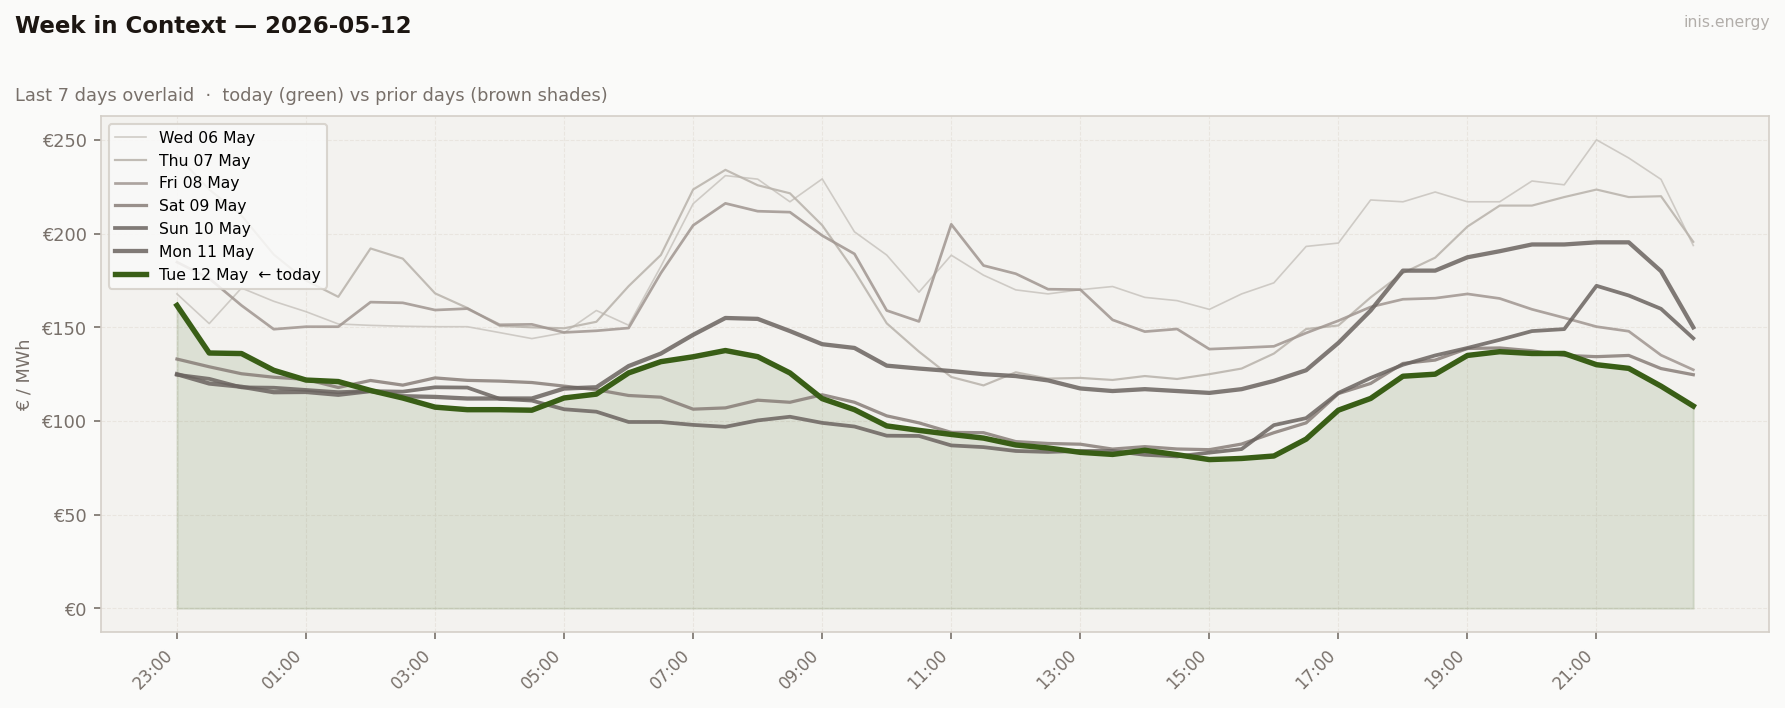
The arc sharpens. Monday-to-Tuesday: demand essentially unchanged (3,810 → 3,767 MW), wind doubled (23% → 47%), mean fell €25. As close to a controlled experiment as the I-SEM gives you in live data. Tuesday’s line should sit materially below Monday’s across every working hour, with the one exception at the 23:00 open where Tuesday inherits Monday’s elevated close.
Price Duration Curve #
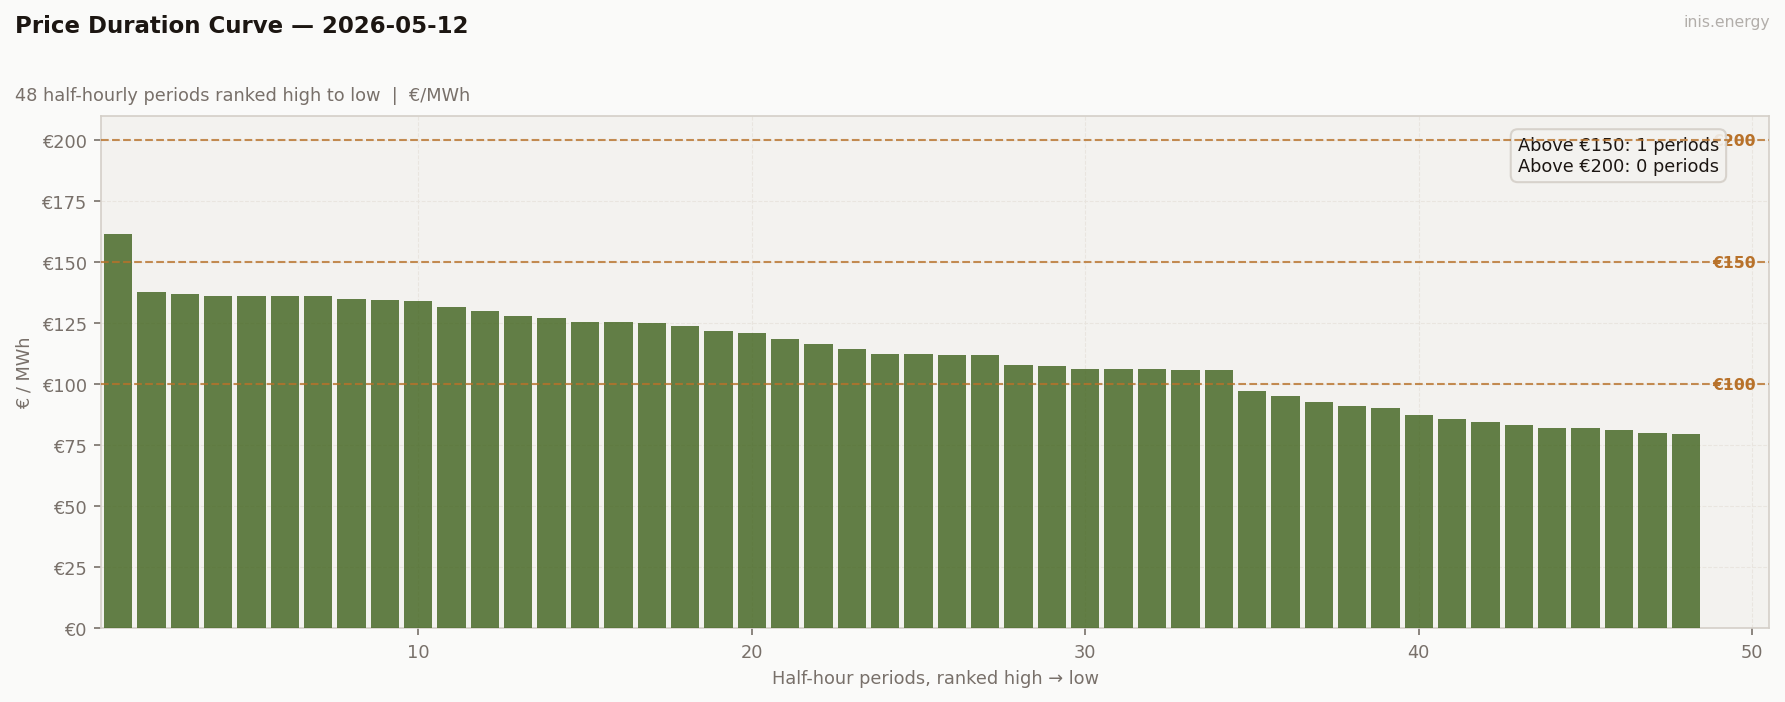
Periods above €150: 1 (2% of day) · Above €200: 0 (0% of day)
1 period above €150 (the 23:00 boundary carryover), 0 above €200. Drop that first period and the entire day clears below €150 — the lowest working-day PDC of the run, structurally identical to last Saturday’s shape.
The parallel is worth stating: weekday demand at 3,767 MW with 47% wind produces the same PDC archetype as weekend demand at 3,503 MW with 57% wind. Wind closes the weekday demand premium entirely. The market doesn’t know it’s a Tuesday.
Peak / Off-Peak Spread #
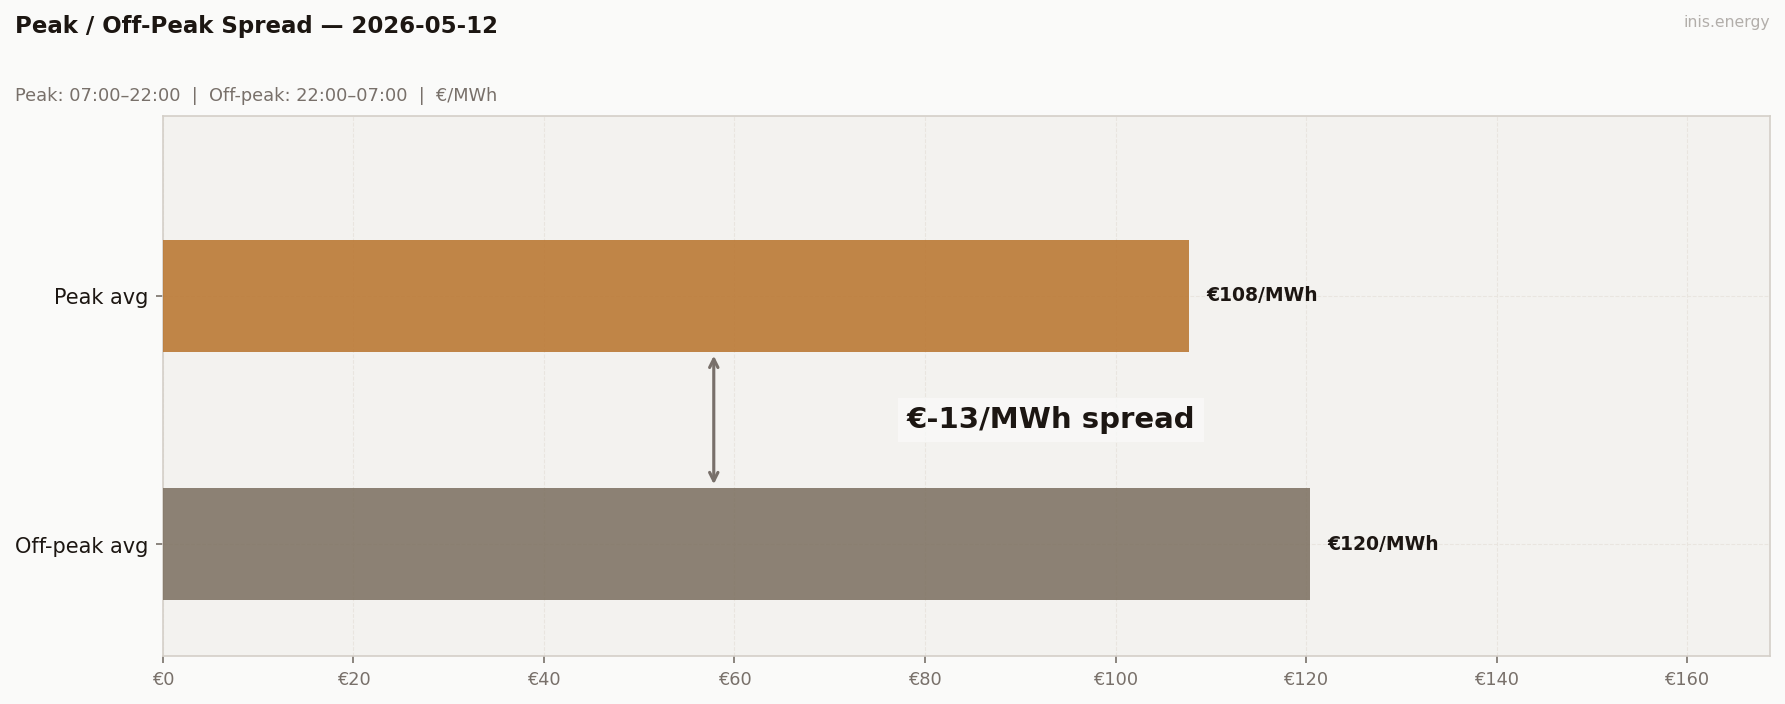
Peak avg (07:00–22:00): €107.69/MWh · Off-peak avg: €120.47/MWh · Spread: €-12.78/MWh
Off-peak (22:00–07:00) averaged €120.47; peak (07:00–22:00) averaged €107.69. Nights more expensive than days. The inversion is partly a boundary effect, not purely a structural signal.
The off-peak window opens with the carryover half-hours from Monday’s evening: 23:00 (€162), 23:30 (€136), then €121–136 through 01:30 — Monday dragging the off-peak average up. The peak window sits on top of a 13-period midday slab below €100 (10:00–16:30), dragging the peak average down.
Strip the carryover hours: the genuine May 12 off-peak (02:00–07:00) runs around €110, the peak window around €108. Essentially flat. The -€12.78 is real for any algorithm bidding the standard windows. But the underlying shape of May 12 isn’t an inverted day — it’s a flat day with a boundary artefact at the open. Flat is a structurally different read from genuinely inverted.
BESS Dispatch Signal #
| Price | Time | Energy | Value | |
|---|---|---|---|---|
| Charge | €81/MWh | 14:30 | 2 MWh | −€161 |
| Discharge | €136/MWh | 19:00 | 1.7 MWh (85% RTE) | +€231 |
| Gross profit | €70 | |||
| Price spread | €55/MWh | ROI: 43.3% |
Updated 2026-08-27: the BESS simulation previously allowed the discharge window to occur before the charge window ended, which is physically impossible for a battery — in this case, by picking periods 1–4 (23:00–00:30), which are Monday’s evening peak crossing the SEM day boundary and sit before Tuesday’s own 14:30 charge. Recalculated enforcing charge-before-discharge; gross profit corrected from €77 to €70.
Simulated 1MW/2MWh battery, one optimal DAM cycle. Gross before network charges and capacity costs.
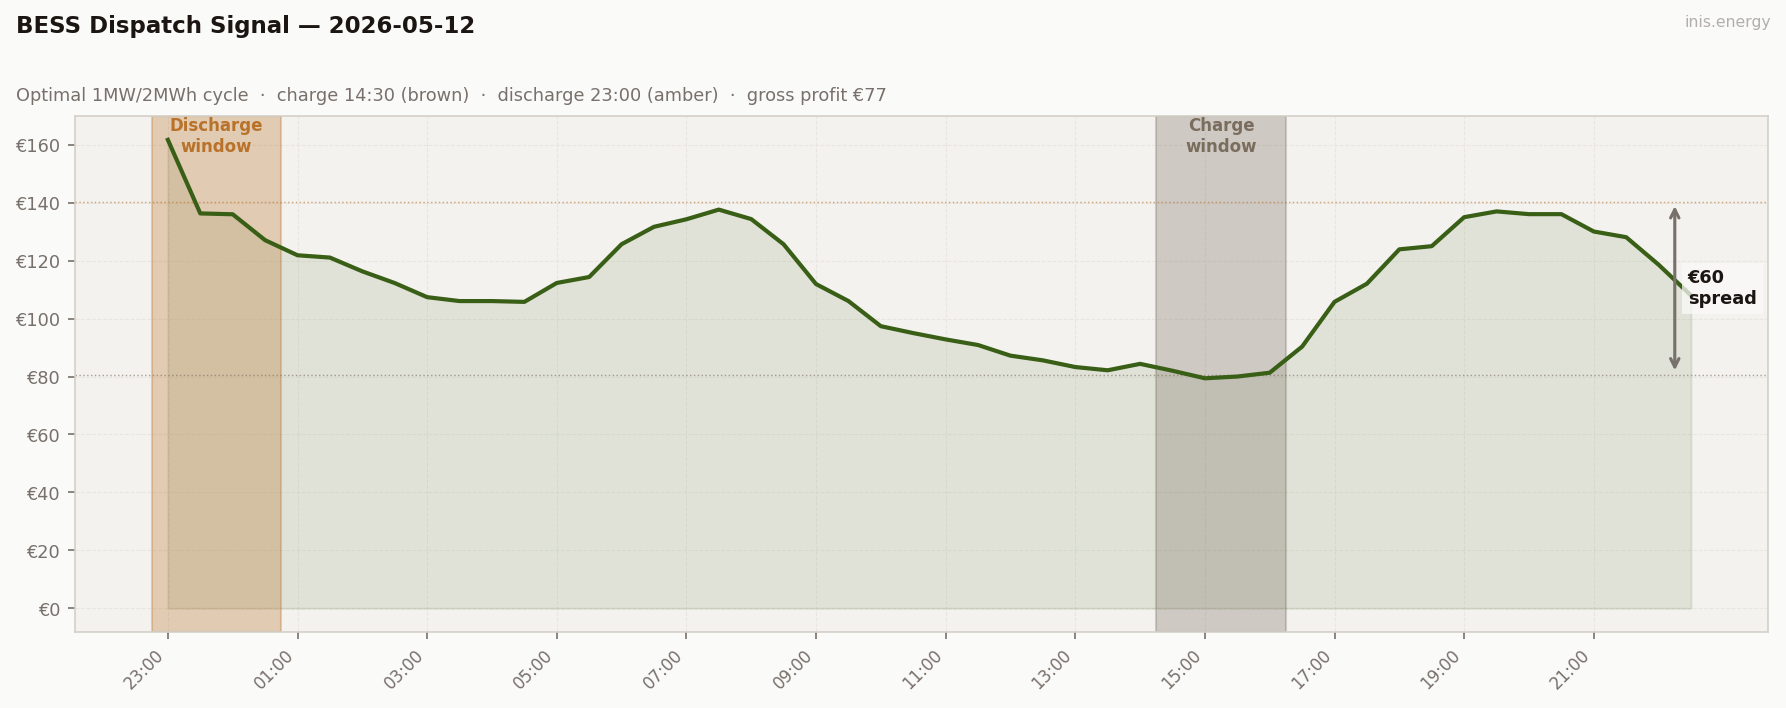
The model charges at 14:30 (€81, midday wind surplus) and, correctly excluding the Monday-evening-spillover block (periods 1–4, which precede the charge), discharges into Tuesday’s own evening peak at 19:00 (€136). Captured spread €55, gross €70. The genuine BESS signal today is still the charge floor: €81 at 14:30 is the first sub-€85 charge window of the working week — the wind-rich midday is shifting the optimal charge slot firmly to the afternoon.
Commentary #
Tuesday cleared at €112.48 — €25 below Monday on essentially unchanged demand (3,767 MW vs 3,810). Wind was the entire difference: 47.4% today, 23.2% yesterday. Same load, different wind, different market. As close to a controlled experiment as the I-SEM gives you in live data.
The €161.70 peak at 23:00 needs a footnote. The I-SEM delivery day runs from 23:00 the prior evening to 22:30 of the named date — so today’s first period is the tail of Monday’s evening peak (which closed at €195 at 21:00 in yesterday’s file). The actual May 12 profile is softer: a morning ramp to €138, a deep wind-suppressed midday belly with 13 periods below €100 between 10:00 and 16:30, and an evening peak that capped at €137. Zero scarcity hours on the day itself. The reported negative spread (-€12.78) is the same effect — strip the carryover hours and the underlying shape is flat, not inverted.
The floor at 15:00 (€79.40) is the real signal: the lowest working-day price of the run. Seven consecutive half-hours below €85, wind at 54–56%, full working-day demand on the system, and the market still couldn’t clear above €85. That’s the mark of 12 May. Not the borrowed evening peak at the top — the wind-suppressed trough at the bottom. For storage, €70 gross, discharging into Tuesday’s own evening peak once the Monday-spillover block is correctly excluded. Sub-€85 midday charging is the new working-day norm in a wind-rich week.
Half-hourly data — 2026-05-12
| Period | Time | Price (€/MWh) | Wind % |
|---|---|---|---|
| 1 | 23:00 | 161.70 | 62.9% |
| 2 | 23:30 | 136.30 | 65.6% |
| 3 | 00:00 | 136.01 | 22.9% |
| 4 | 00:30 | 127.07 | 24.0% |
| 5 | 01:00 | 121.86 | 25.5% |
| 6 | 01:30 | 121.06 | 27.5% |
| 7 | 02:00 | 116.31 | 33.5% |
| 8 | 02:30 | 112.27 | 36.9% |
| 9 | 03:00 | 107.40 | 39.3% |
| 10 | 03:30 | 106.05 | 42.6% |
| 11 | 04:00 | 106.05 | 43.7% |
| 12 | 04:30 | 105.77 | 44.6% |
| 13 | 05:00 | 112.30 | 44.6% |
| 14 | 05:30 | 114.35 | 42.9% |
| 15 | 06:00 | 125.67 | 44.5% |
| 16 | 06:30 | 131.68 | 40.9% |
| 17 | 07:00 | 134.28 | 39.1% |
| 18 | 07:30 | 137.62 | 34.8% |
| 19 | 08:00 | 134.35 | 38.0% |
| 20 | 08:30 | 125.65 | 41.7% |
| 21 | 09:00 | 111.93 | 40.8% |
| 22 | 09:30 | 106.06 | 43.7% |
| 23 | 10:00 | 97.38 | 46.4% |
| 24 | 10:30 | 95.00 | 43.6% |
| 25 | 11:00 | 92.82 | 42.9% |
| 26 | 11:30 | 90.88 | 45.4% |
| 27 | 12:00 | 87.21 | 47.8% |
| 28 | 12:30 | 85.59 | 50.6% |
| 29 | 13:00 | 83.28 | 53.9% |
| 30 | 13:30 | 82.16 | 55.9% |
| 31 | 14:00 | 84.38 | 55.0% |
| 32 | 14:30 | 82.00 | 55.1% |
| 33 | 15:00 | 79.40 | 54.6% |
| 34 | 15:30 | 80.00 | 54.4% |
| 35 | 16:00 | 81.32 | 55.2% |
| 36 | 16:30 | 90.33 | 55.9% |
| 37 | 17:00 | 105.78 | 56.0% |
| 38 | 17:30 | 112.05 | 57.1% |
| 39 | 18:00 | 123.90 | 56.9% |
| 40 | 18:30 | 125.00 | 56.9% |
| 41 | 19:00 | 135.00 | 56.9% |
| 42 | 19:30 | 137.00 | 56.6% |
| 43 | 20:00 | 136.05 | 55.6% |
| 44 | 20:30 | 136.05 | 55.1% |
| 45 | 21:00 | 130.06 | 54.5% |
| 46 | 21:30 | 128.10 | 54.3% |
| 47 | 22:00 | 118.61 | 59.1% |
| 48 | 22:30 | 108.00 | 59.7% |
Compare your business electricity and gas rates in minutes with INIS Energy Brokers.
Compare rates