I-SEM Daily Briefing — 13 May 2026
Table of Contents
Market Snapshot
| Metric | Value |
|---|---|
| Mean DAM Price | €109.94/MWh |
| Median Price | €103.81/MWh |
| Std Dev | €17.33/MWh |
| Peak Price | €145.0/MWh (19:30) |
| Min Price | €90.5/MWh (14:30) |
| Price Range | €54.5/MWh |
| Periods above €150 | 0 of 48 (0%) |
| Periods above €200 | 0 of 48 (0%) |
| Peak Avg (07–22) | €113.26/MWh |
| Off-peak Avg (22–07) | €104.4/MWh |
| Peak/Off-Peak Spread | €8.86/MWh |
| Wind % of Demand | 60.1% |
| Wind Range | 50.4%–71.9% |
| Mean Demand | 3792 MW |
Price Profile #
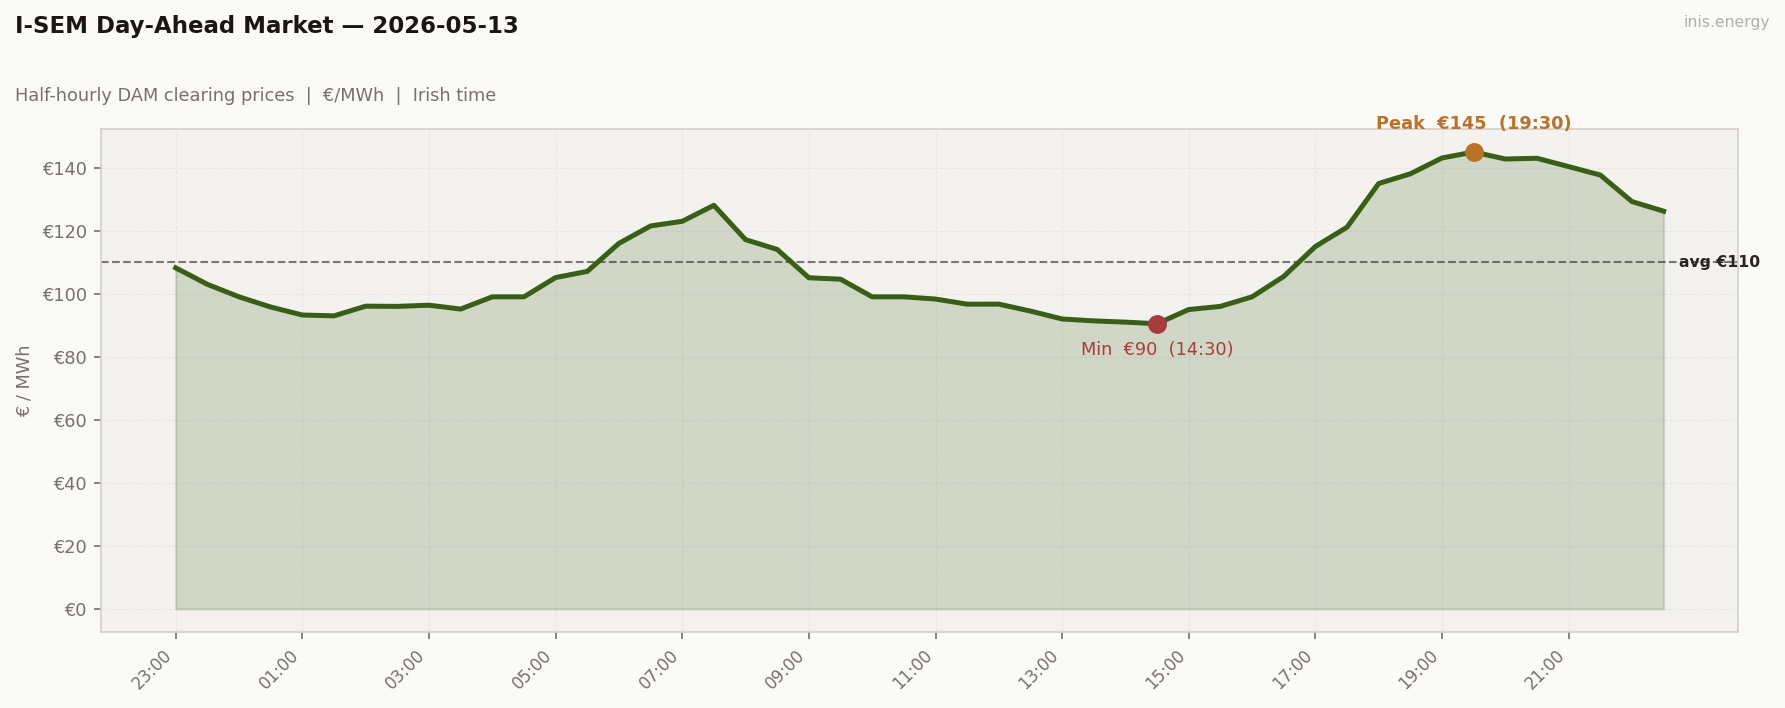
Std dev €17.33/MWh · Median €103.81/MWh · Periods above €150: 0 of 48 (0%)
Three numbers define the day before the chart does: std dev €17.33, range €54.50, zero periods above €150.
Overnight ran €93–108 (wind 65–71%, gas at the low end of mid-merit). Morning ramp: 05:00 (€105) → 07:30 (€128), +€23 in 2.5 hours — the gentlest working-day ramp of the run. Then the midday belly: €92–99 from 10:00 to 16:00, wind holding 54–58% all the way through. Six consecutive hours where the market couldn’t clear above €100. Evening climbed from 16:30 (€106) to 19:30 (€145), then faded to €126 by 22:30.
€145 is the lowest evening peak of the working week. May 5: €232. May 11: €195. May 12 (actual evening): €137. Today: €145. The working-week evening peak has been compressed in lockstep with wind penetration. €91 floor, €145 ceiling, 48 periods, no exceptions. The shape exists but the amplitude is gone.
Price vs Wind #
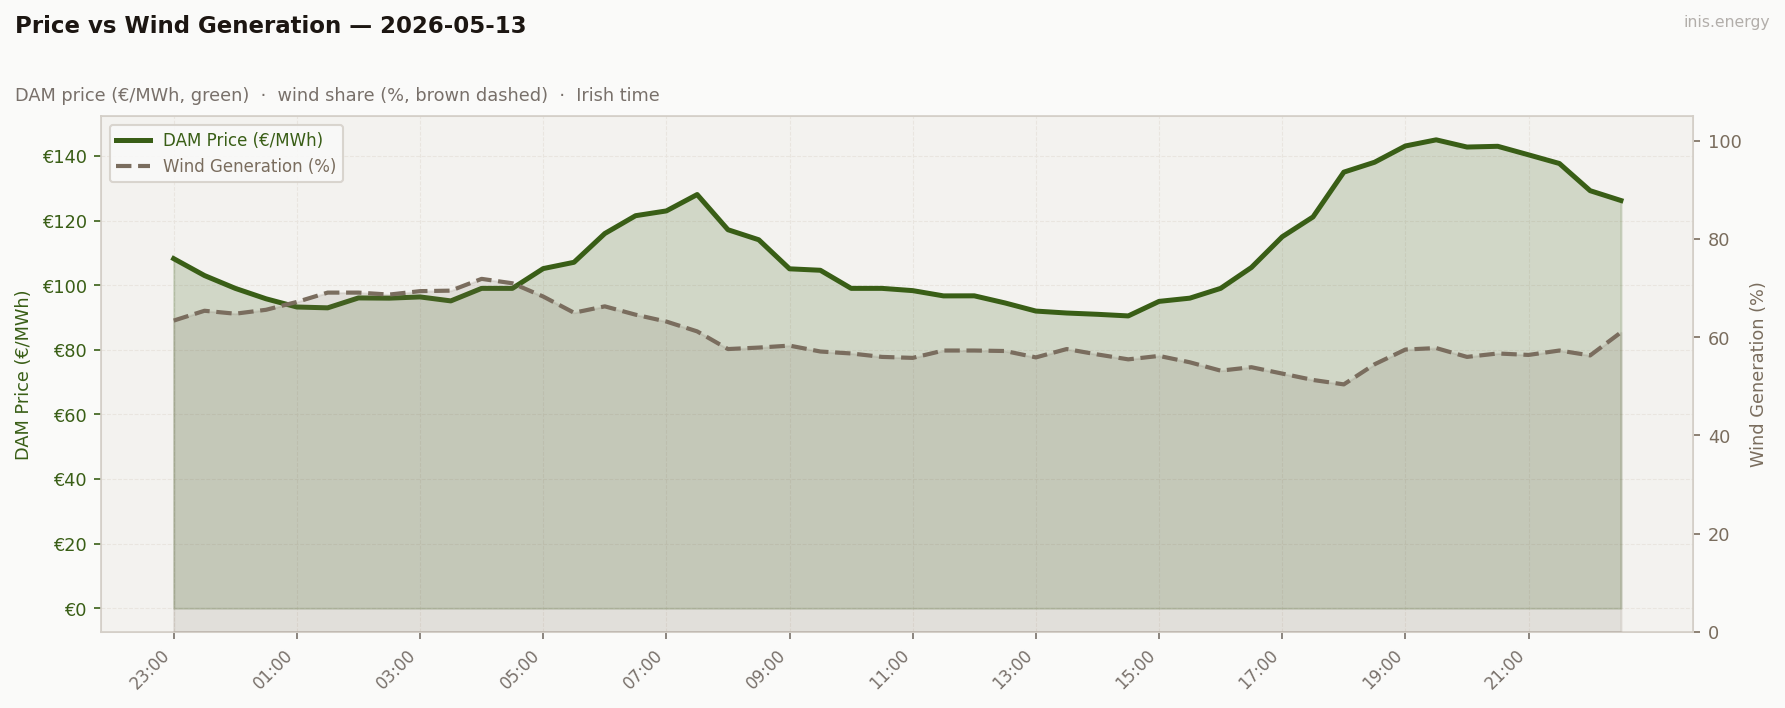
Mean wind: 60.1% · Range: 50.4%–71.9%
Wind 50.4%–71.9%, mean 60.1%. The narrowness matters more than the level — a 21-point band, wind above 50% for every single half-hour, above 60% for 30 of them. No sudden drops, no ramp events, no overnight drama.
Intra-day cannibalisation is small: wind generated steadily across cheap midday and the slightly-more-expensive evening alike, putting capture price maybe €5/MWh below the daily mean. Normal, unremarkable.
The bigger story is structural. Today’s wind earned approximately €105/MWh across its output. May 4 (13% wind) earned close to €170/MWh. Same merit-order mechanics, very different revenue. Wind cannibalises itself by levelling the market, not just by capturing the cheap hours of a volatile day. At 60% penetration, wind owns the merit order end to end — and the entire price level comes down with it.
Week in Context #
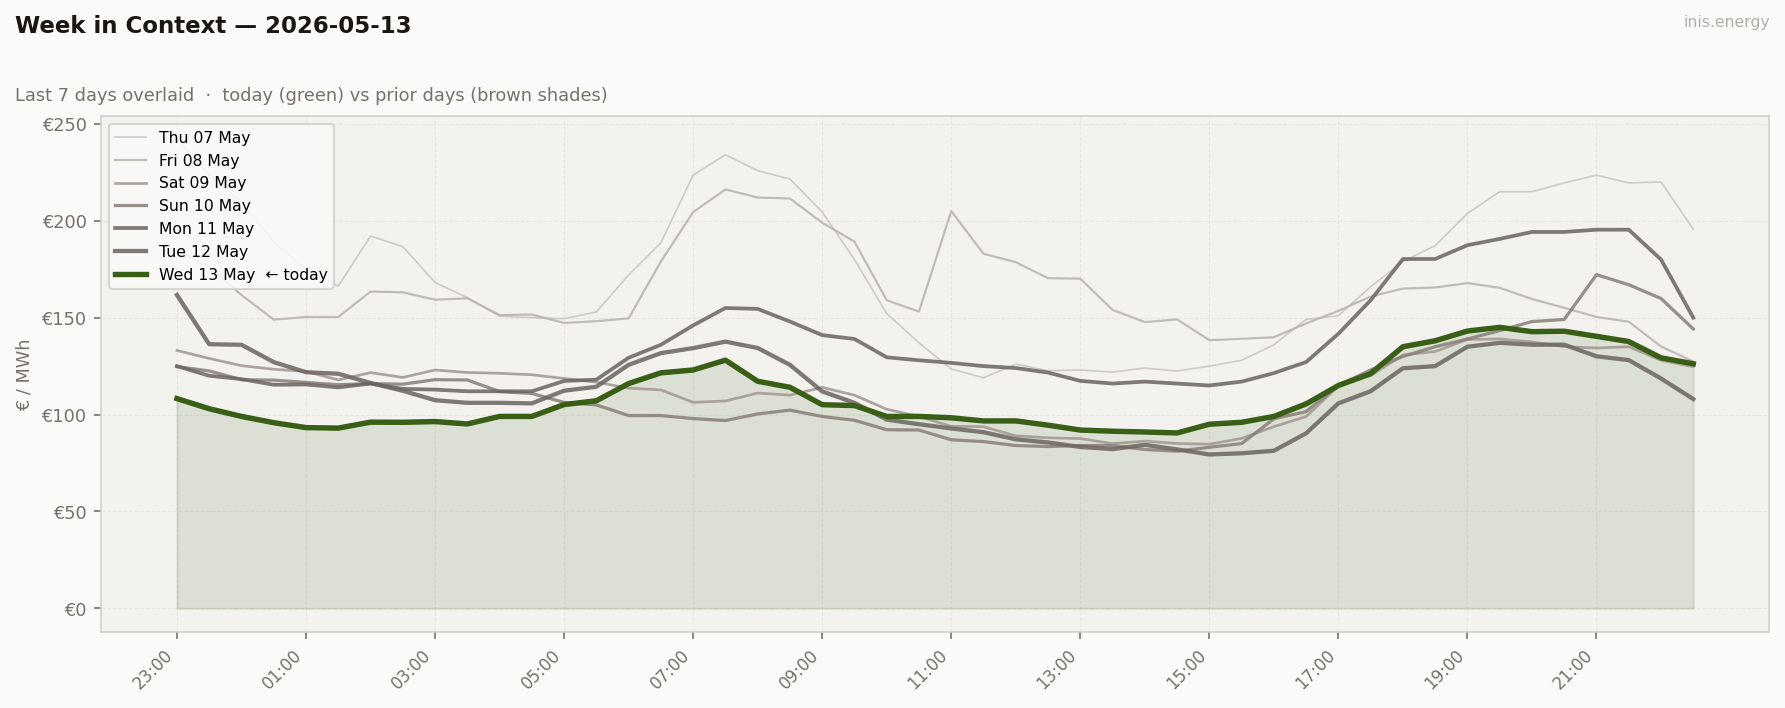
Three days of the working week visible. The Mon–Tue–Wed progression — 23%, 47%, 60% wind, €138/€112/€110 mean — shows the suppression steepening between Monday and Tuesday (€26 drop) then flattening between Tuesday and Wednesday (€2 drop). Above roughly 50% wind penetration in current Irish demand conditions, additional wind keeps finding mid-merit gas still on the system at similar cost. The suppression curve is flattening. Wednesday sits at the bottom of the run so far.
Price Duration Curve #
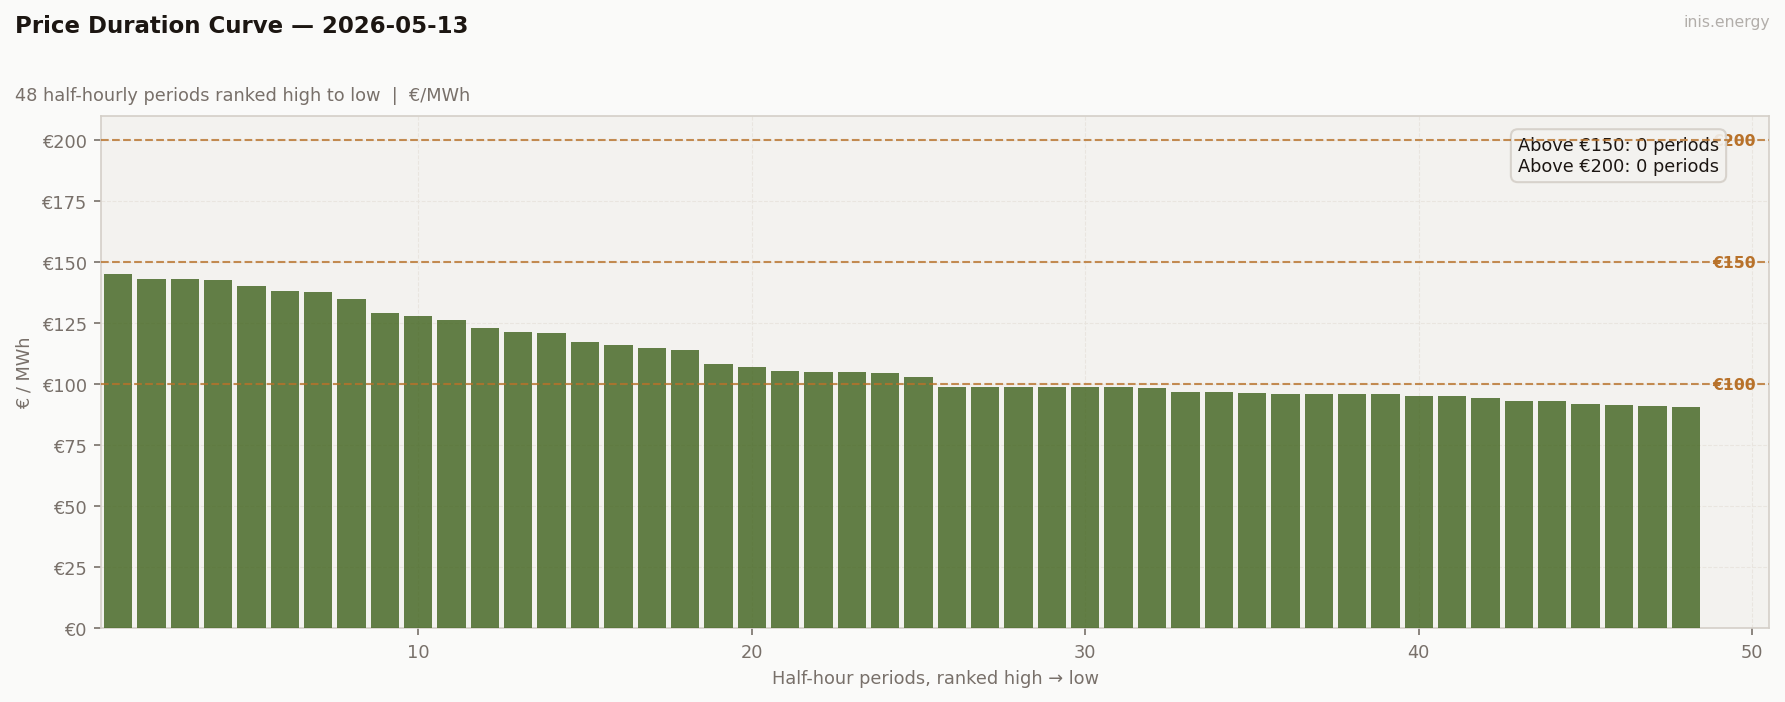
Periods above €150: 0 (0% of day) · Above €200: 0 (0% of day)
Zero above €150, zero above €200. Flat and low — the lowest of the run and the flattest working-day curve of the week.
The reference pair: May 5 was high and flat (gas marginal everywhere, floor €147, ceiling €232, no surplus). Today is the inverse twin — wind marginal, floor €91, ceiling €145, no scarcity. Same PDC archetype: a single fuel type price-sets the whole day, no bimodal cheap-trough-and-expensive-peak structure. Flat-and-low is not the same market as flat-and-high; the mechanism differs entirely. The curve shape rhymes.
Peak / Off-Peak Spread #
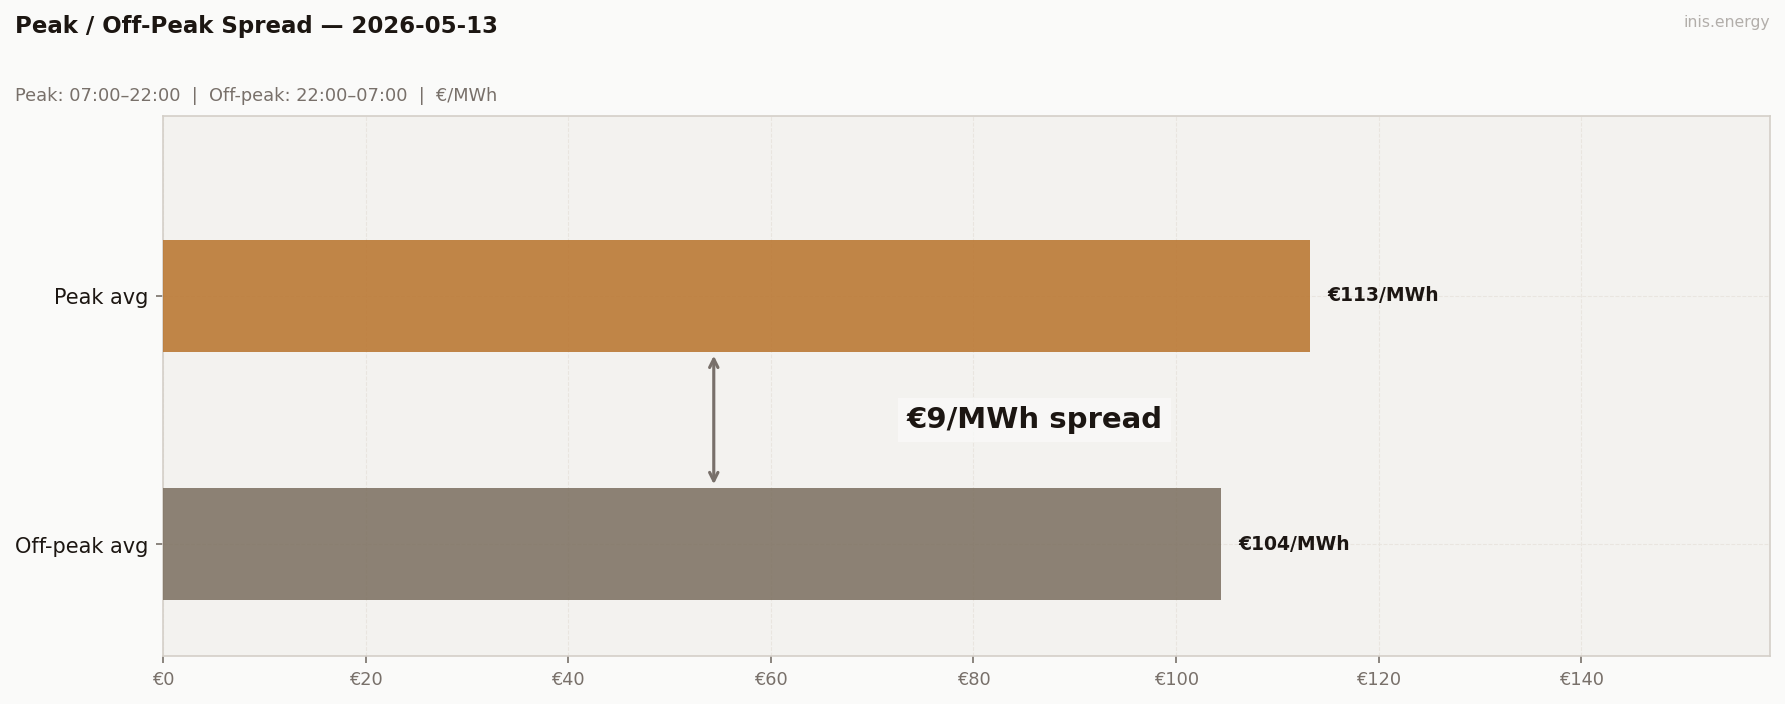
Peak avg (07:00–22:00): €113.26/MWh · Off-peak avg: €104.4/MWh · Spread: €8.86/MWh
+€8.86. Technically back in positive territory after Tuesday’s boundary-distorted inversion. Functionally below the battery break-even threshold.
Round-trip efficiency on a 2MWh cycle requires roughly €13/MWh to cover the energy loss alone, before degradation, capacity costs, or forecast error. A mechanical peak/off-peak cycling strategy today — charging overnight, discharging into the peak window — would have been net-negative. The discretionary dispatch (picking the cheapest 4 half-hours in the day regardless of calendar window) captured €52 of actual spread while the peak/off-peak window only offered €8.86. The entire profit margin lived in the strategy, not the market.
BESS Dispatch Signal #
| Price | Time | Energy | Value | |
|---|---|---|---|---|
| Charge | €91/MWh | 13:00 | 2 MWh | −€182 |
| Discharge | €143/MWh | 19:00 | 1.7 MWh (85% RTE) | +€244 |
| Gross profit | €61 | |||
| Price spread | €52/MWh | ROI: 33.7% |
Simulated 1MW/2MWh battery, one optimal DAM cycle. Gross before network charges and capacity costs.
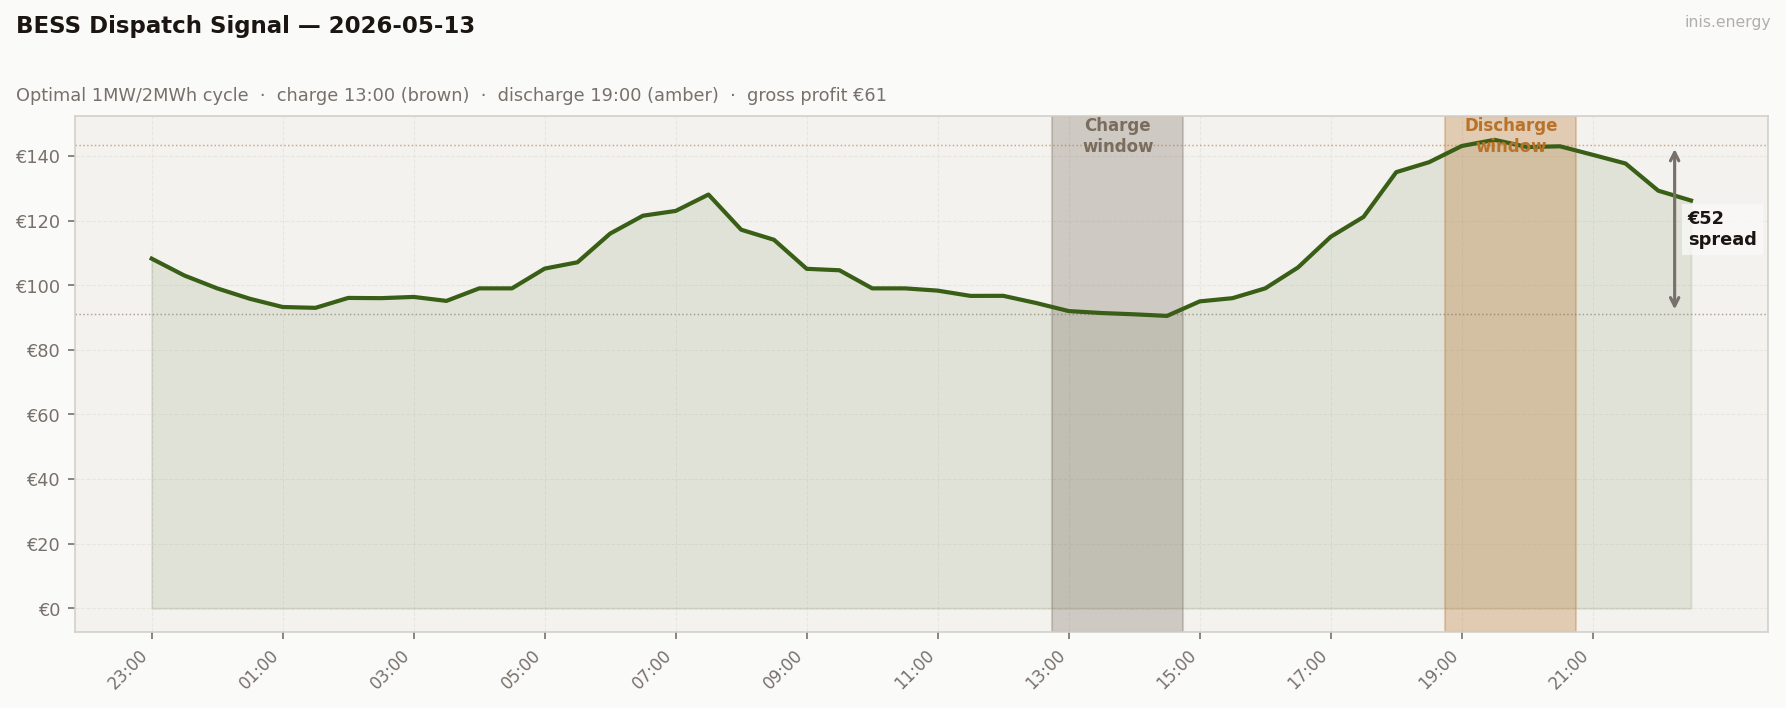
€61 gross — a weak working day. The model charged at 13:00 (€91, midday wind trough) and discharged at 19:00 (€143, early evening peak), capturing €52 of spread.
€52 is the structural ceiling on a 60%-wind working day: midday at €91–96, evening peak capped at €145, nowhere higher with perfect foresight. A forecast-driven operator — running on estimates rather than actuals — would almost certainly do worse. Trough-timing error alone could halve the captured spread on a day this flat.
Commentary #
The calmest day of the run. Wednesday’s mean of €109.94 is the lowest working-day mean of the series — std dev €17.33, range €54.50, zero periods above €150 all day. The first working day in this series without a single scarcity hour. Wind held at 60% across the entire day (range 50–72%) and the market compressed into a tight €91–145 band: overnight at €93–108, a morning ramp that added just €23 to reach €128, a long shallow midday trough at €91–99 from 10:00 to 16:00, an evening peak that topped at €145 and faded quietly.
The structural read is cannibalisation in its inter-day form. Intra-day, wind’s capture price sat maybe €5/MWh below the daily mean — a small effect, because wind generated steadily across both cheap and moderately-expensive hours. The bigger number: today’s mean is €30 below the 11-day running average because wind owned the merit order from end to end. Today’s wind earned approximately €105/MWh across its output. May 4 (13% wind) earned close to €170/MWh. Wind doesn’t just cannibalise its own captured price within a volatile day — it cannibalises the entire price level when it dominates supply. Same market mechanics, very different revenue.
For storage, €61 gross — a weak working day. The captured spread was €52; the peak/off-peak window only offered €8.86, below the round-trip efficiency break-even threshold. A blind mechanical cycling strategy today would have lost money. The discretionary dispatch (charge 13:00, discharge 19:00) is doing real work — and even with perfect foresight the ceiling was thin. Storage lives on shape — and today the shape was flat.
Half-hourly data — 2026-05-13
| Period | Time | Price (€/MWh) | Wind % |
|---|---|---|---|
| 1 | 23:00 | 108.23 | 63.4% |
| 2 | 23:30 | 103.00 | 65.4% |
| 3 | 00:00 | 99.03 | 64.8% |
| 4 | 00:30 | 95.80 | 65.6% |
| 5 | 01:00 | 93.26 | 67.2% |
| 6 | 01:30 | 93.00 | 69.1% |
| 7 | 02:00 | 96.07 | 69.1% |
| 8 | 02:30 | 96.00 | 68.7% |
| 9 | 03:00 | 96.38 | 69.4% |
| 10 | 03:30 | 95.15 | 69.5% |
| 11 | 04:00 | 99.03 | 71.9% |
| 12 | 04:30 | 99.03 | 71.0% |
| 13 | 05:00 | 105.15 | 68.3% |
| 14 | 05:30 | 107.10 | 65.0% |
| 15 | 06:00 | 116.00 | 66.3% |
| 16 | 06:30 | 121.52 | 64.6% |
| 17 | 07:00 | 123.00 | 63.2% |
| 18 | 07:30 | 128.07 | 61.2% |
| 19 | 08:00 | 117.18 | 57.6% |
| 20 | 08:30 | 114.07 | 57.9% |
| 21 | 09:00 | 105.08 | 58.3% |
| 22 | 09:30 | 104.63 | 57.1% |
| 23 | 10:00 | 99.03 | 56.7% |
| 24 | 10:30 | 99.03 | 56.0% |
| 25 | 11:00 | 98.33 | 55.8% |
| 26 | 11:30 | 96.70 | 57.3% |
| 27 | 12:00 | 96.72 | 57.3% |
| 28 | 12:30 | 94.51 | 57.2% |
| 29 | 13:00 | 92.00 | 55.9% |
| 30 | 13:30 | 91.40 | 57.6% |
| 31 | 14:00 | 91.00 | 56.5% |
| 32 | 14:30 | 90.50 | 55.5% |
| 33 | 15:00 | 95.00 | 56.2% |
| 34 | 15:30 | 96.00 | 54.9% |
| 35 | 16:00 | 99.03 | 53.2% |
| 36 | 16:30 | 105.50 | 53.9% |
| 37 | 17:00 | 115.00 | 52.6% |
| 38 | 17:30 | 121.14 | 51.3% |
| 39 | 18:00 | 135.00 | 50.4% |
| 40 | 18:30 | 138.07 | 54.5% |
| 41 | 19:00 | 143.10 | 57.5% |
| 42 | 19:30 | 145.00 | 57.8% |
| 43 | 20:00 | 142.77 | 56.0% |
| 44 | 20:30 | 143.00 | 56.7% |
| 45 | 21:00 | 140.36 | 56.4% |
| 46 | 21:30 | 137.68 | 57.3% |
| 47 | 22:00 | 129.26 | 56.3% |
| 48 | 22:30 | 126.22 | 61.0% |
Compare your business electricity and gas rates in minutes with INIS Energy Brokers.
Compare rates