I-SEM Daily Briefing — 14 May 2026
Table of Contents
Market Snapshot
| Metric | Value |
|---|---|
| Mean DAM Price | €127.08/MWh |
| Median Price | €121.14/MWh |
| Std Dev | €18.15/MWh |
| Peak Price | €157.0/MWh (21:00) |
| Min Price | €101.61/MWh (14:30) |
| Price Range | €55.39/MWh |
| Periods above €150 | 11 of 48 (23%) |
| Periods above €200 | 0 of 48 (0%) |
| Peak Avg (07–22) | €129.29/MWh |
| Off-peak Avg (22–07) | €123.39/MWh |
| Peak/Off-Peak Spread | €5.9/MWh |
| Wind % of Demand | 52.8% |
| Wind Range | 38.0%–63.9% |
| Mean Demand | 3895 MW |
Price Profile #
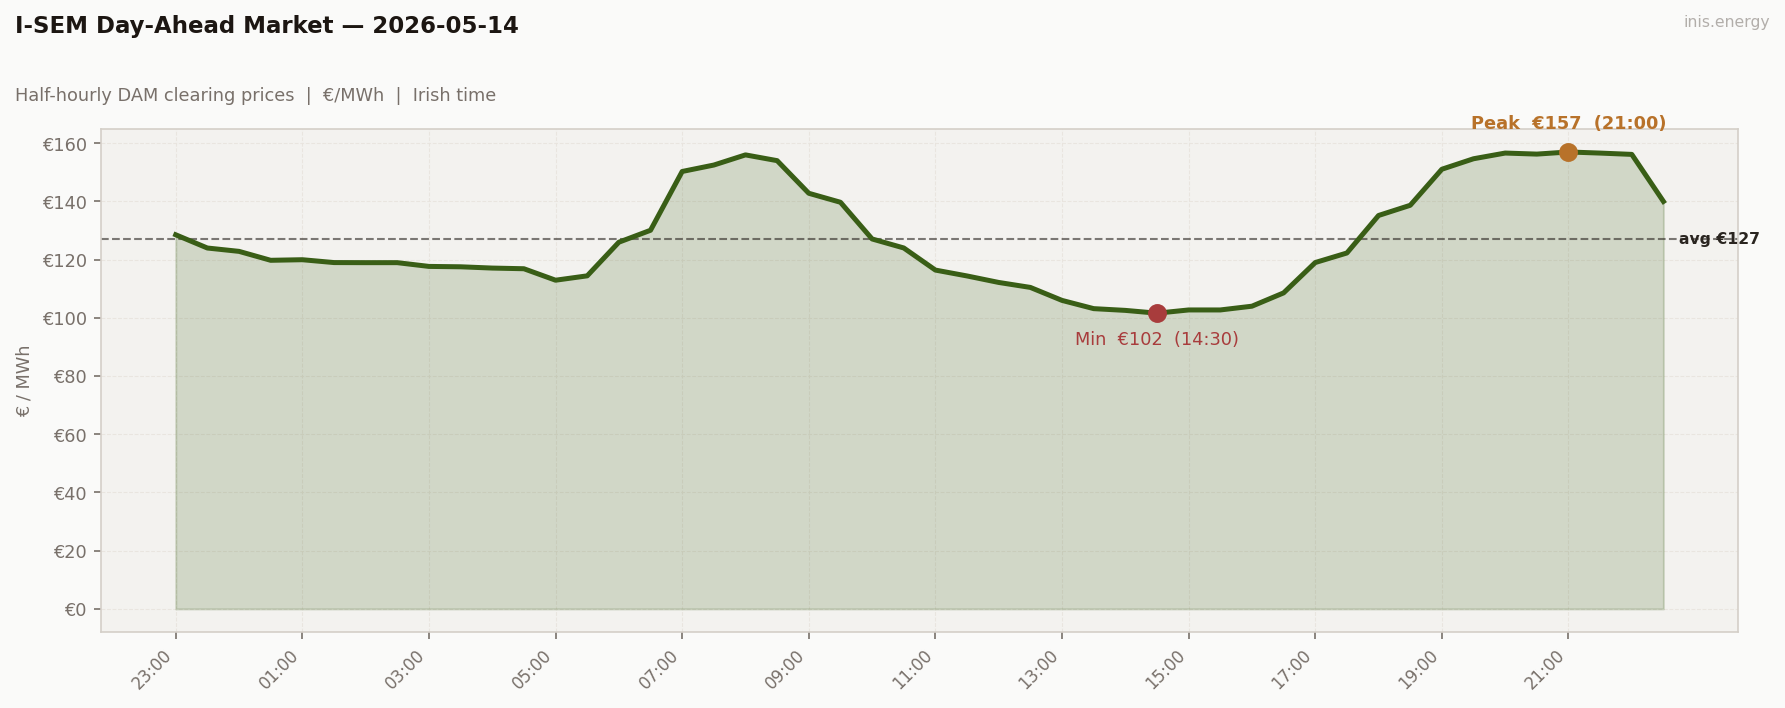
Std dev €18.15/MWh · Median €121.14/MWh · Periods above €150: 11 of 48 (23%)
Shape returned. Spread didn’t.
Morning ramp: 06:00 (€126) → 07:30 (€152) → 08:00 (€156), +€30 in 2.5 hours, sustained above €150 for four half-hours. Wind held 45–51% through the ramp window — the first working-day morning this week where wind dipped below 50% during the climb, letting the marginal plant step further up the merit order.
Midday belly: €101–117 from 11:00 to 16:30. Wind crept back to 53–56% through midday, demand softened, the marginal plant stepped back down. Floor held above €100 — €21 higher than Tuesday’s midday.
Evening peak: 16:30 (€109) → 19:00 (€151) → 21:00 (€157). Seven consecutive half-hours above €150. Wind held 51–55% through the evening build, capping the peak at €157. If wind had decayed through 21:00 as it did Sunday May 10, the evening would have run €180 comfortably.
For scale: Thursday’s demand of 3,895 MW nearly matches Tuesday May 5’s 3,940 MW. May 5’s morning peak hit €232. Today’s hit €156. The gap is 47 percentage points of wind.
Price vs Wind #
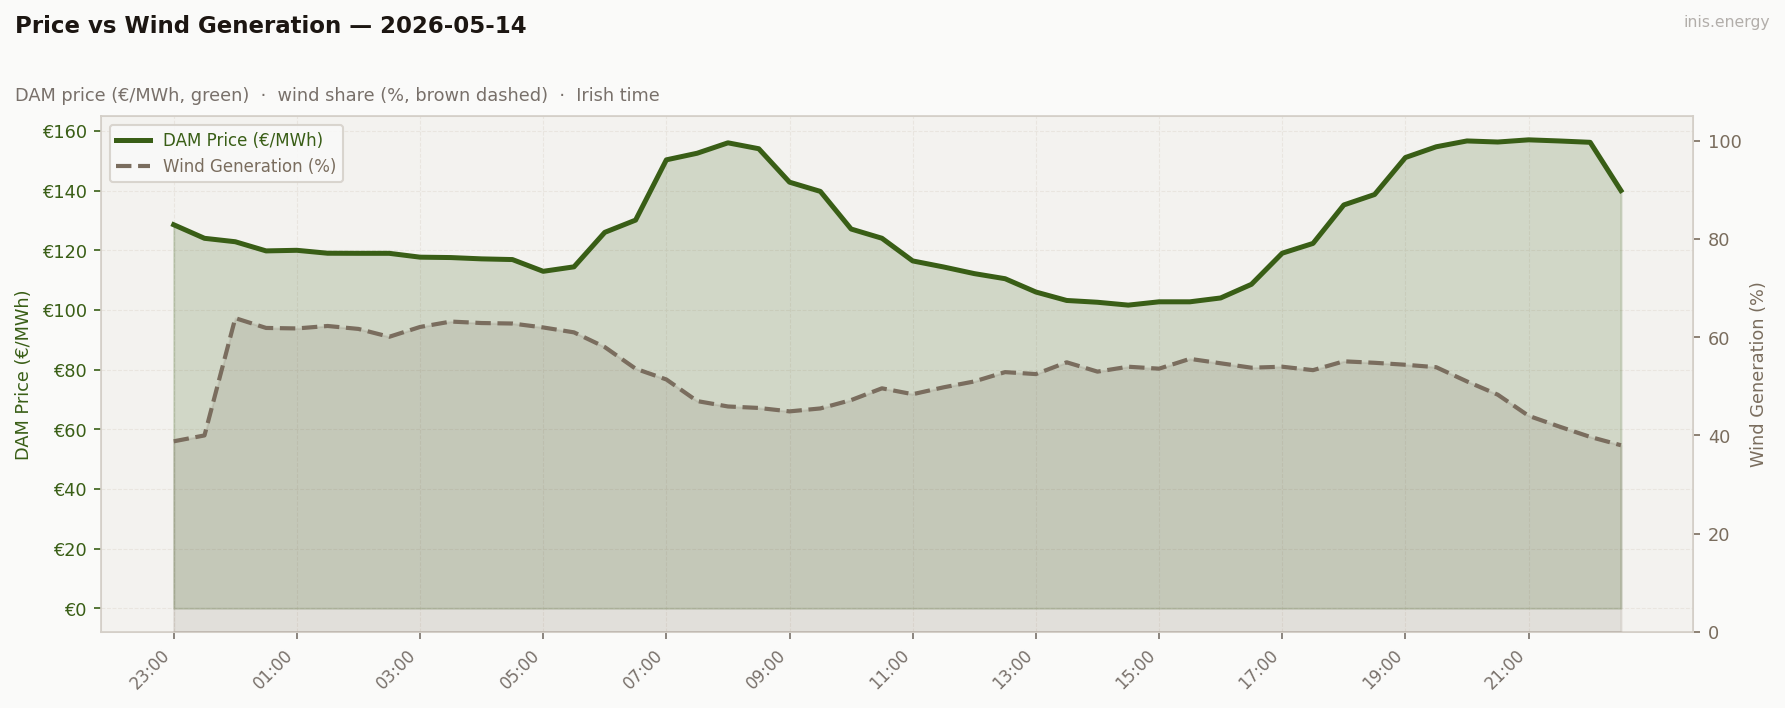
Mean wind: 52.8% · Range: 38.0%–63.9%
Wind 38–64%, mean 52.8%. More shape than Wednesday — climbed through the afternoon (48% → 55%), held through the evening build (54%), then decayed late (38–40% from 21:30). That late-evening decline let the evening block hold at €156–157 rather than collapsing; below 45% after 21:30, demand was still partly met by gas.
Capture price: modestly below the daily mean. Wind generated through cheap midday and the more expensive evening in roughly equal proportion. A structurally normal working-day cannibalisation profile — no reversal, no drama.
The week now has four data points: Mon 23% → €138, Tue 47% → €112, Wed 60% → €110, Thu 53% → €127. Each 10-point step up in wind suppressed the daily mean by roughly €10–12/MWh. Thursday’s partial recovery — 53% wind, €127 mean — is consistent with the slope reversing. The market responds symmetrically to wind in both directions at this penetration level.
Week in Context #
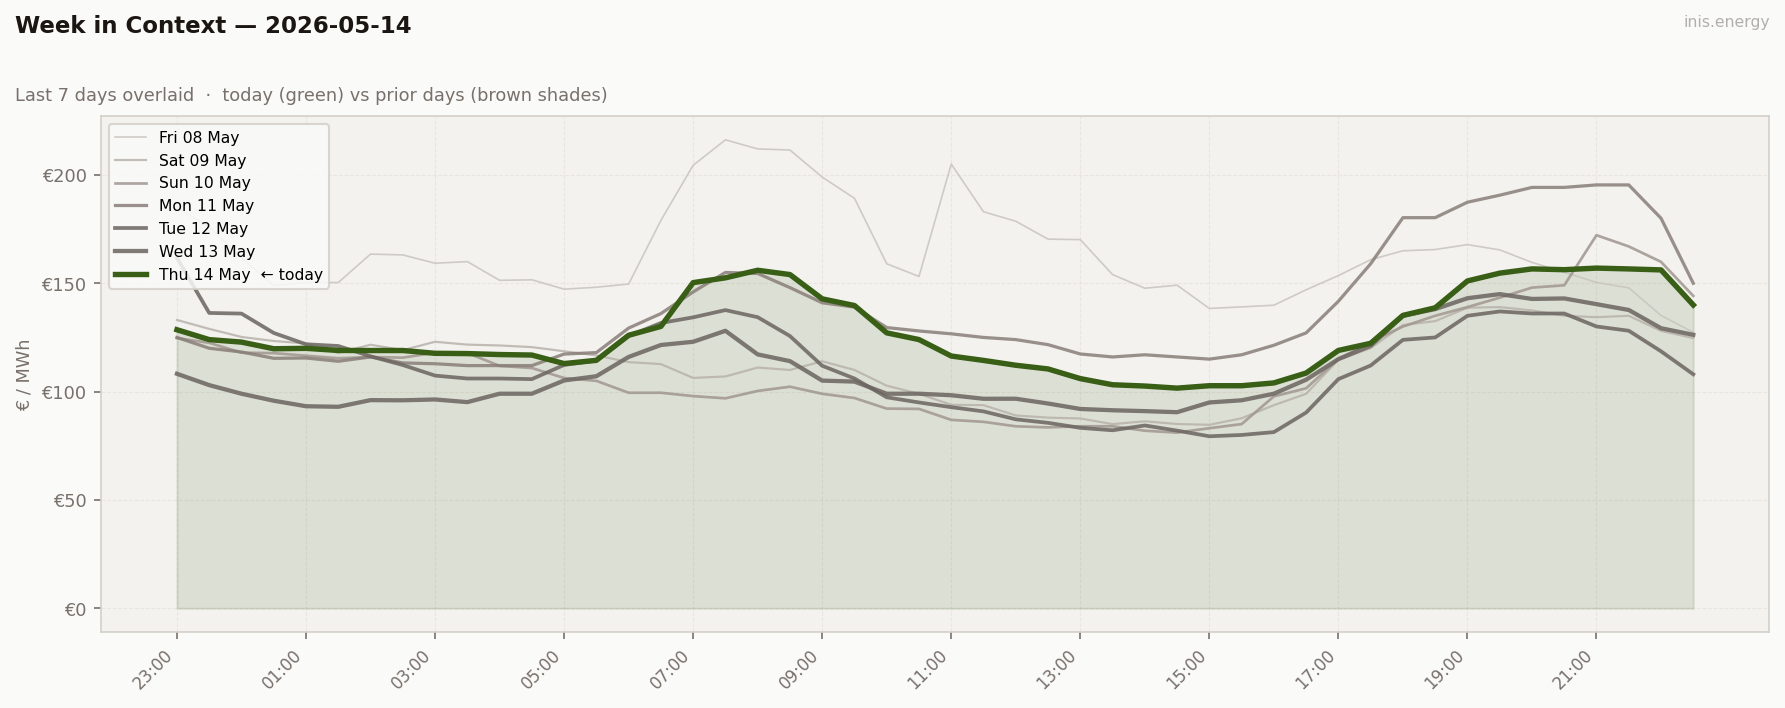
A full working week now in view. Mon–Tue–Wed–Thu wind: 23%, 47%, 60%, 53%. Mean: €138, €112, €110, €127. The arc is clear — two days of wind-driven compression, one recovery as wind eases back. Thursday’s line should track close to Wednesday through the midday but lift noticeably in the morning and evening peak blocks. Monday still sits at the top; Wednesday at the bottom. Thursday’s partial recovery is the tell: the market responds symmetrically to wind on the way back up as it did on the way down.
Price Duration Curve #
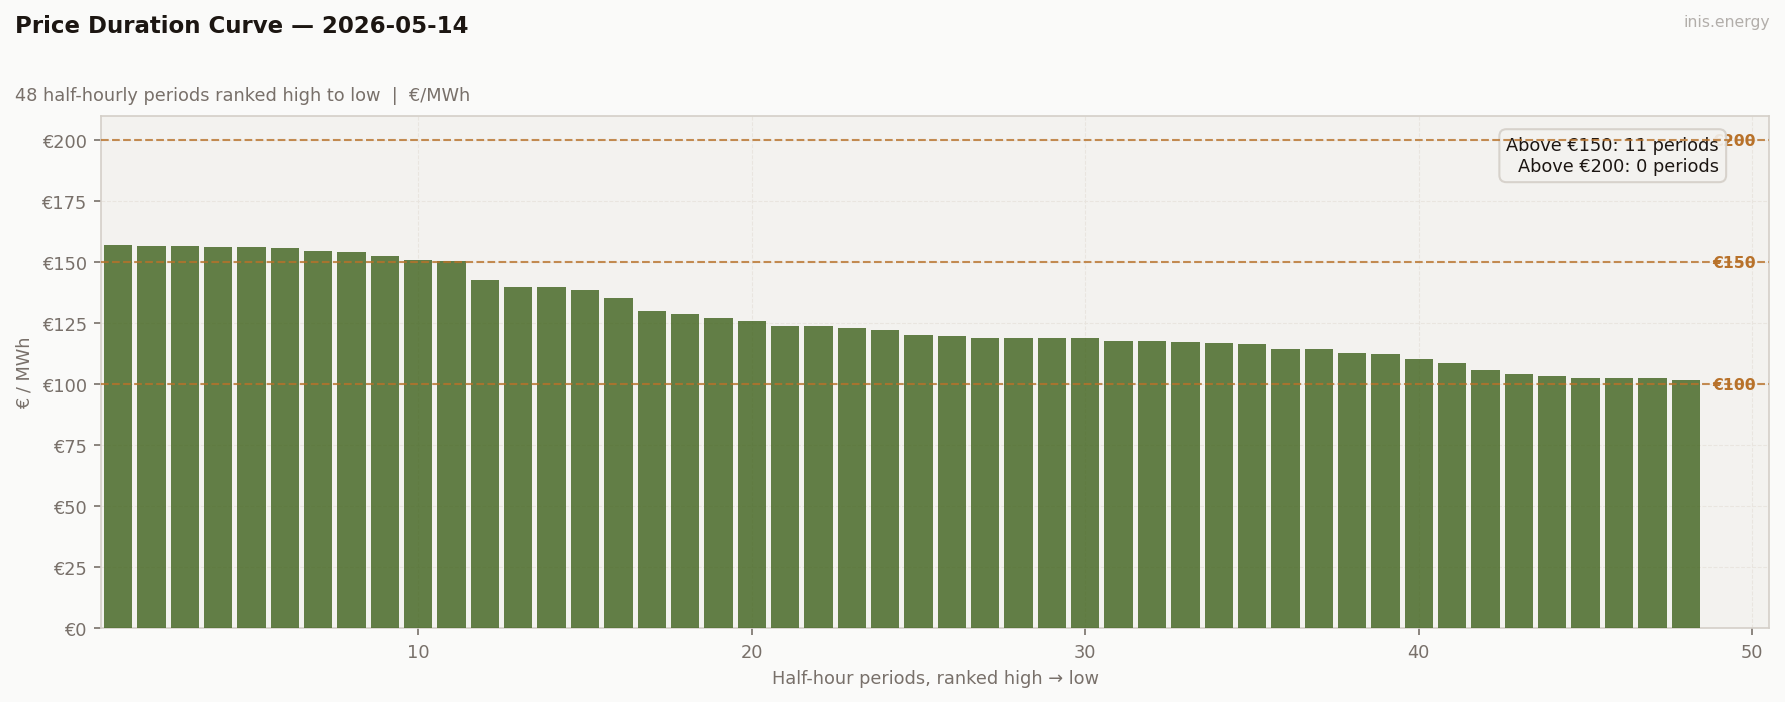
Periods above €150: 11 (23% of day) · Above €200: 0 (0% of day)
11 periods above €150, 0 above €200. A clear top shoulder: the morning peak block (4 periods, 07:00–08:30) and the evening peak block (7 periods, 19:00–22:00), separated by the midday belly.
Monday had 12 periods above €150. The top shoulders look similar in width and position. The bases diverge: Monday’s floor €112, Thursday’s €101. Monday’s peak €195, Thursday’s €157. Thursday’s curve is narrower in the middle and shorter at the top. Same scarcity-hour count, very different spread economics — the PDC is showing you the shape but not the two-tail story. That’s what the spread section is for.
Peak / Off-Peak Spread #
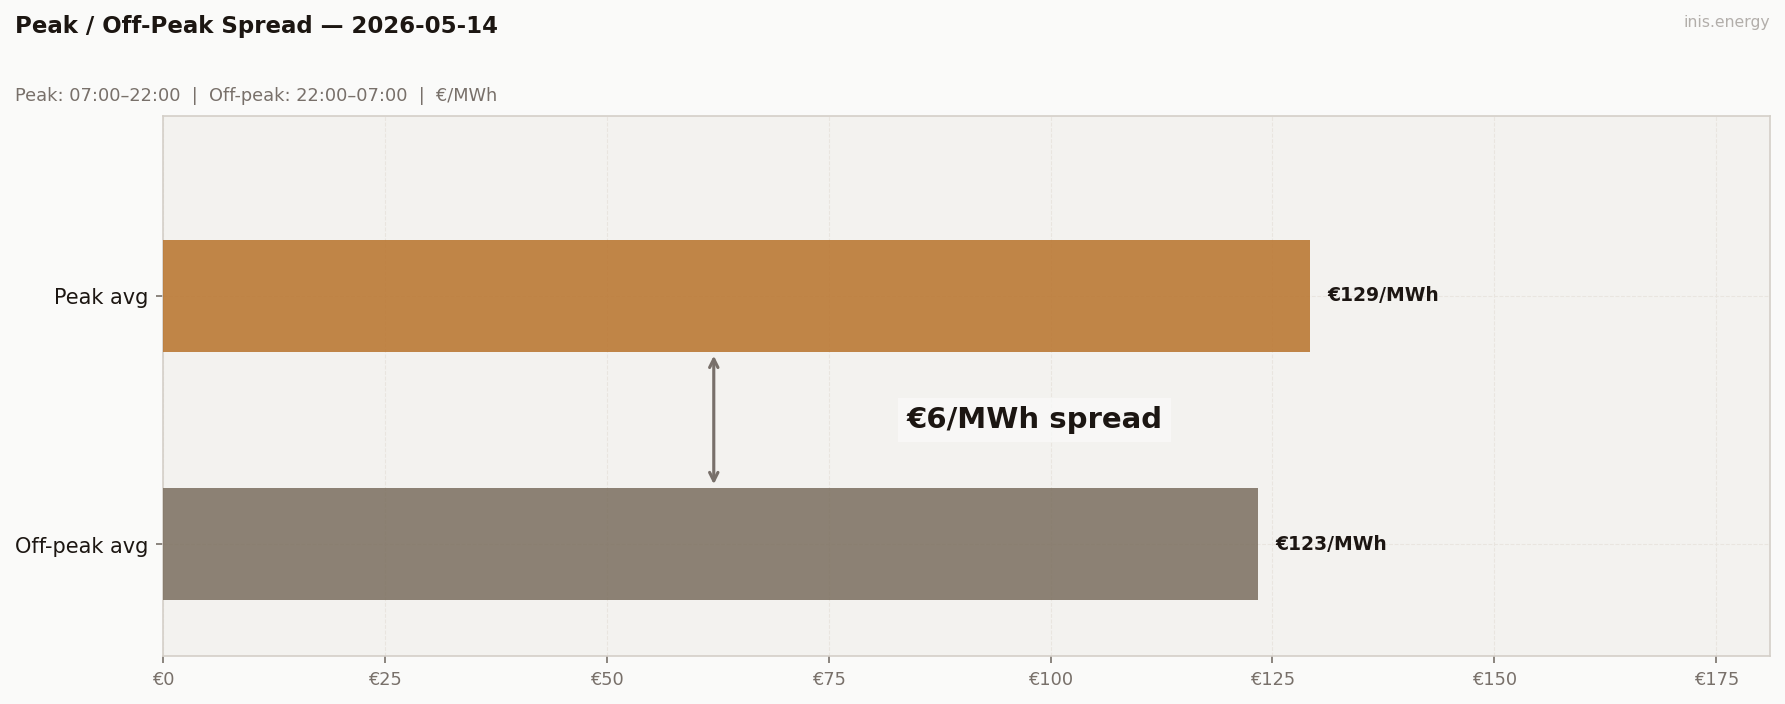
Peak avg (07:00–22:00): €129.29/MWh · Off-peak avg: €123.39/MWh · Spread: €5.9/MWh
+€5.90. Monday had the same scarcity-hour count. Monday’s spread: €23.62.
The peak window is anchored by a long midday belly (€101–117, roughly 15 periods). The off-peak window ran €117–128 across all 18 overnight periods — €5/MWh dearer than Monday’s €112–125. That €5 off-peak lift compressed the spread by €18.
Peak/off-peak spread is a two-tail function. A strong evening peak doesn’t help arbitrage if the overnight isn’t structurally cheap. €5 of off-peak lift = €18 of spread compression. Monday had both a high peak and a cheap overnight. Thursday had the peak and 60%-wind-era overnight pricing: still gas-marginal, no structural cheap window, floor held by fuel cost not wind surplus.
BESS Dispatch Signal #
| Price | Time | Energy | Value | |
|---|---|---|---|---|
| Charge | €102/MWh | 14:00 | 2 MWh | −€205 |
| Discharge | €157/MWh | 20:00 | 1.7 MWh (85% RTE) | +€266 |
| Gross profit | €61 | |||
| Price spread | €54/MWh | ROI: 30.0% |
Simulated 1MW/2MWh battery, one optimal DAM cycle. Gross before network charges and capacity costs.
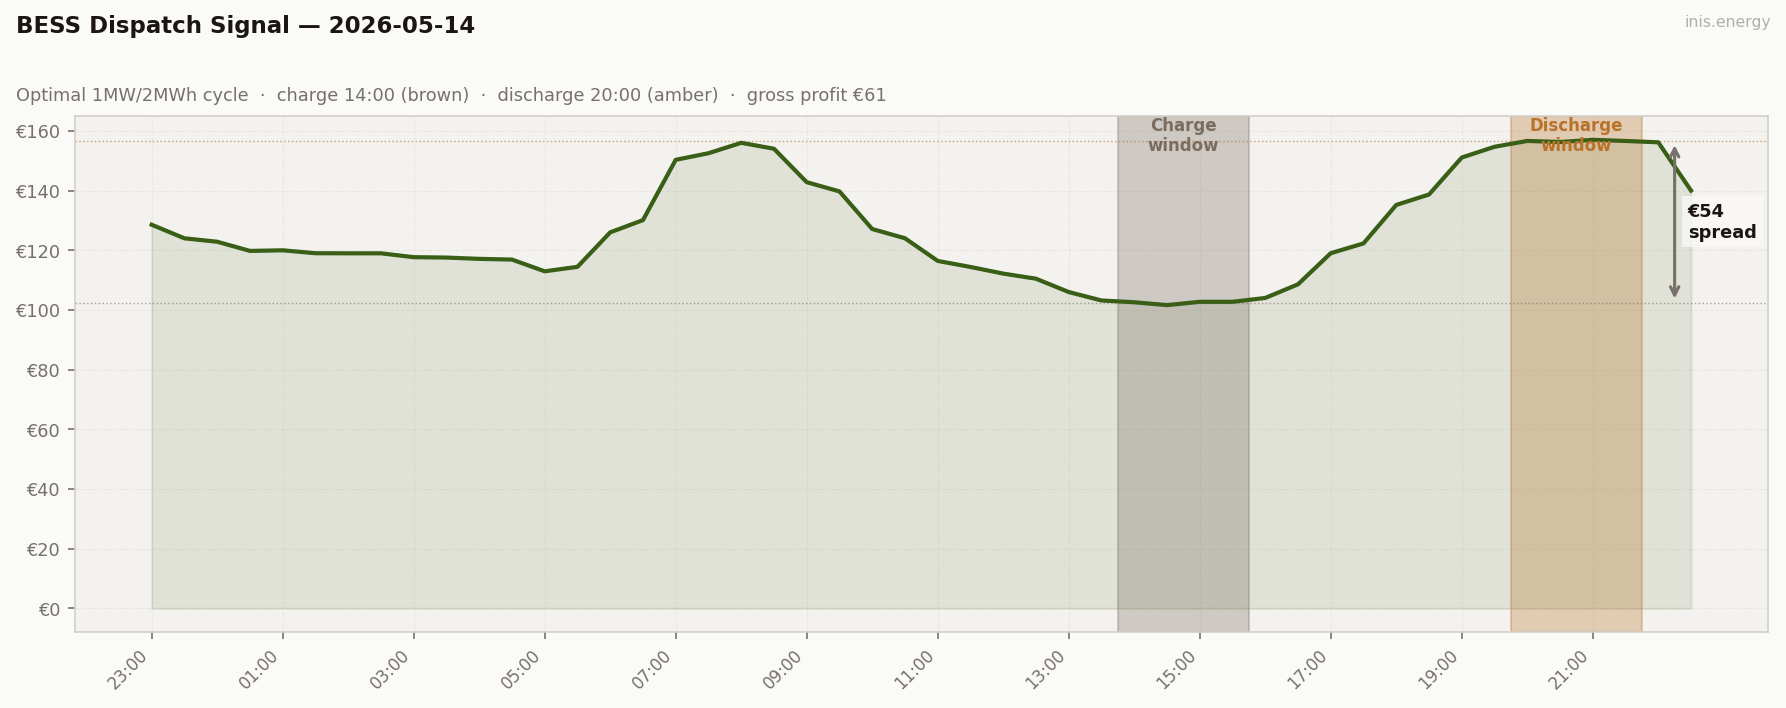
€61 gross. Charged at 14:00 (€102, midday belly), discharged at 20:00 (€157, evening peak). Captured spread €54.
Wednesday: €110 mean, €52 spread, €61 BESS. Thursday: €127 mean, €54 spread, €61 BESS. €17 of daily price-level lift produced zero additional BESS revenue. The captured spread barely moved.
The charge window stayed at 14:00 for the third consecutive working day. Monday was the single exception: 23% wind, overnight cheap, charge moved to 03:00. Every other day this week: midday. Wind penetration above 40% keeps the structural trough in the afternoon. Charge-time choice is now a wind-regime classifier.
Commentary #
Thursday lifted €17 to €127.08 as wind eased from Wednesday’s 60% to 53% and demand reached 3,895 MW — the week’s highest. The shape returned in conventional form: a morning ramp to €156 by 08:00, a long midday belly at €101–117 from 11:00 to 16:30, a sustained evening peak averaging €154 from 19:00 to 22:00. 11 periods above €150, zero above €200. Thursday’s demand nearly matches Tuesday May 5 (3,940 MW); the morning peak hit €156 rather than €232 because wind held 47 percentage points higher.
The Monday-Thursday comparison is the structural lesson of the week. Both days: 11–12 periods above €150. Monday’s peak/off-peak spread: +€23.62. Thursday’s: +€5.90. The overnight off-peak window ran €5/MWh dearer on Thursday (€117–128 vs Monday’s €112–125). That €5 difference compressed the spread by €18. Peak/off-peak spread is a two-tail function — a strong evening peak doesn’t help arbitrage if the overnight isn’t structurally cheap. Monday had both. Thursday had the peak and a gas-marginal overnight with no cheap window, the floor pinned by fuel cost rather than wind surplus.
For storage, €61 gross — tied with Wednesday, despite the €17 higher daily mean. Captured spread €54 vs Wednesday’s €52: functionally identical. €17 of price-level lift produced zero additional BESS revenue. Storage lives on spread, not level. Thursday’s €127 mean bought exactly the same BESS day as Wednesday’s €110. Send Friday when you have it — with five wind levels in one week, the weekly recap structure writes itself.
Half-hourly data — 2026-05-14
| Period | Time | Price (€/MWh) | Wind % |
|---|---|---|---|
| 1 | 23:00 | 128.55 | 38.8% |
| 2 | 23:30 | 124.00 | 40.0% |
| 3 | 00:00 | 122.85 | 63.9% |
| 4 | 00:30 | 119.78 | 61.9% |
| 5 | 01:00 | 119.98 | 61.8% |
| 6 | 01:30 | 119.00 | 62.3% |
| 7 | 02:00 | 118.97 | 61.7% |
| 8 | 02:30 | 118.97 | 60.1% |
| 9 | 03:00 | 117.68 | 62.1% |
| 10 | 03:30 | 117.55 | 63.2% |
| 11 | 04:00 | 117.11 | 62.9% |
| 12 | 04:30 | 116.88 | 62.8% |
| 13 | 05:00 | 112.94 | 62.0% |
| 14 | 05:30 | 114.44 | 61.0% |
| 15 | 06:00 | 126.00 | 58.0% |
| 16 | 06:30 | 130.10 | 53.6% |
| 17 | 07:00 | 150.30 | 51.4% |
| 18 | 07:30 | 152.51 | 47.0% |
| 19 | 08:00 | 156.00 | 45.9% |
| 20 | 08:30 | 154.02 | 45.6% |
| 21 | 09:00 | 142.81 | 44.9% |
| 22 | 09:30 | 139.72 | 45.5% |
| 23 | 10:00 | 127.11 | 47.2% |
| 24 | 10:30 | 124.02 | 49.6% |
| 25 | 11:00 | 116.42 | 48.4% |
| 26 | 11:30 | 114.40 | 49.8% |
| 27 | 12:00 | 112.17 | 51.0% |
| 28 | 12:30 | 110.46 | 52.9% |
| 29 | 13:00 | 106.00 | 52.5% |
| 30 | 13:30 | 103.17 | 54.9% |
| 31 | 14:00 | 102.57 | 53.0% |
| 32 | 14:30 | 101.61 | 54.0% |
| 33 | 15:00 | 102.72 | 53.6% |
| 34 | 15:30 | 102.72 | 55.6% |
| 35 | 16:00 | 104.01 | 54.7% |
| 36 | 16:30 | 108.58 | 53.8% |
| 37 | 17:00 | 119.01 | 54.0% |
| 38 | 17:30 | 122.29 | 53.3% |
| 39 | 18:00 | 135.18 | 55.1% |
| 40 | 18:30 | 138.68 | 54.8% |
| 41 | 19:00 | 151.07 | 54.4% |
| 42 | 19:30 | 154.67 | 53.9% |
| 43 | 20:00 | 156.63 | 51.0% |
| 44 | 20:30 | 156.27 | 48.3% |
| 45 | 21:00 | 157.00 | 44.0% |
| 46 | 21:30 | 156.62 | 41.8% |
| 47 | 22:00 | 156.17 | 39.7% |
| 48 | 22:30 | 140.00 | 38.0% |
Compare your business electricity and gas rates in minutes with INIS Energy Brokers.
Compare rates