I-SEM Daily Briefing — 15 May 2026
Table of Contents
Market Snapshot
| Metric | Value |
|---|---|
| Mean DAM Price | €149.91/MWh |
| Median Price | €132.25/MWh |
| Std Dev | €37.62/MWh |
| Peak Price | €244.26/MWh (22:00) |
| Min Price | €112.59/MWh (14:30) |
| Price Range | €131.67/MWh |
| Periods above €150 | 16 of 48 (33%) |
| Periods above €200 | 9 of 48 (19%) |
| Peak Avg (07–22) | €154.68/MWh |
| Off-peak Avg (22–07) | €141.95/MWh |
| Peak/Off-Peak Spread | €12.73/MWh |
| Wind % of Demand | 15.8% |
| Wind Range | 7.9%–38.1% |
| Mean Demand | 3983 MW |
Price Profile #
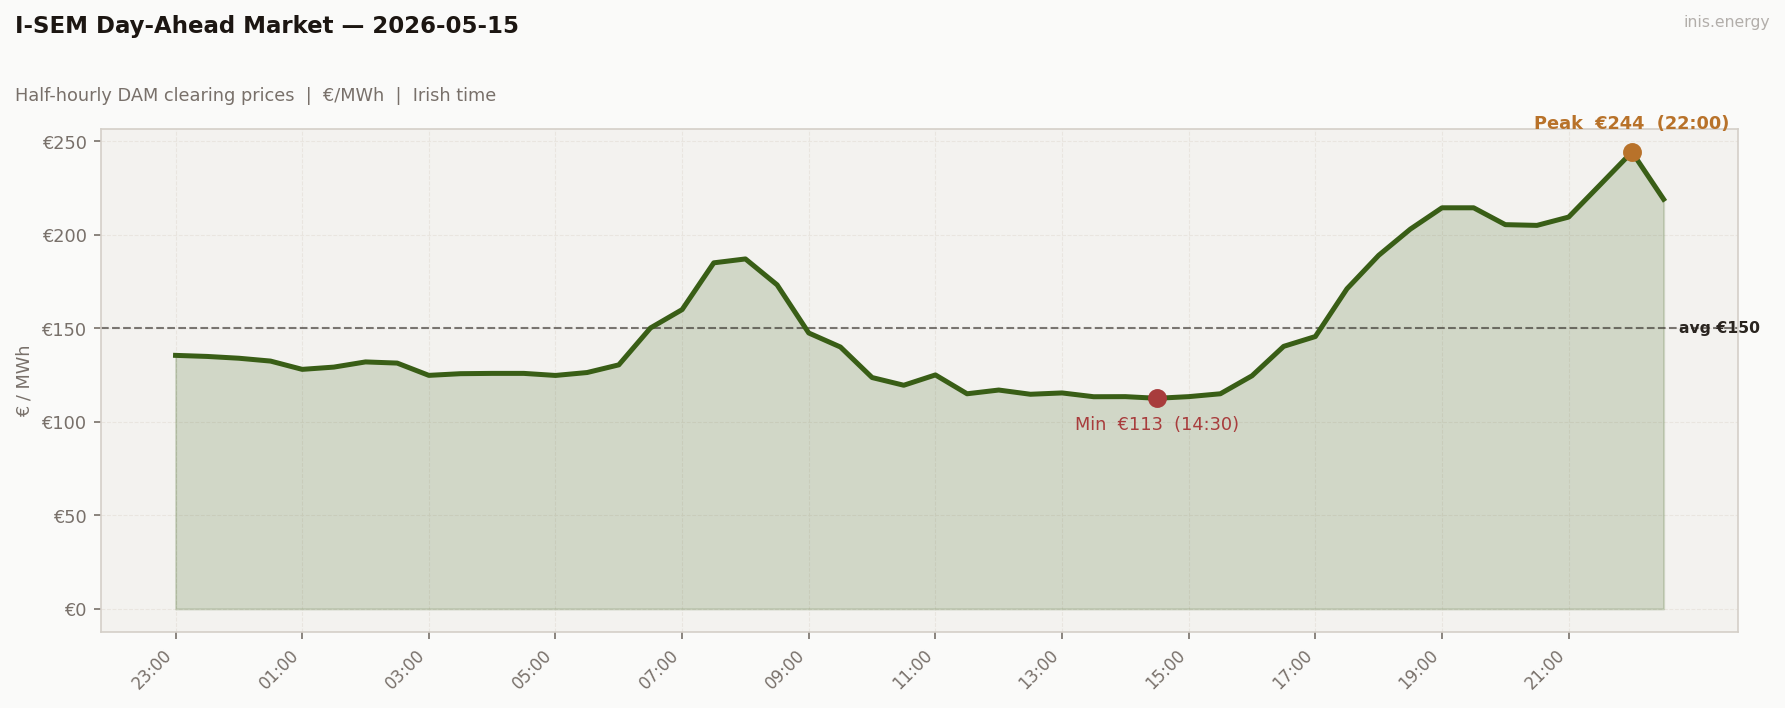
Std dev €37.62/MWh · Median €132.25/MWh · Periods above €150: 16 of 48 (33%)
Three blocks on the chart, two of them scarcity-adjacent.
Morning peak (06:30–08:30): €150 → €185 → €187 → €173. Wind dropped from 17.5% at 06:30 to 9.8% at 08:30 — the morning ramp coincided with wind hitting its early-day minimum. Gas did all the lifting: +€57 between 06:00 (€130) and 08:00 (€187) in under two hours. Four periods above €150, two above €180. The working-day morning ramp at low wind, familiar from May 5.
Midday belly (10:00–15:00): €113–125. The minimum (€112.59 at 14:30) sits here. With wind at a meagre 12–15% through this block, the trough is demand-driven rather than wind-driven — shallow compared to the wind-rich middays of Tuesday and Wednesday. This is what the midday looks like when wind isn’t doing the heavy lifting: €37 below the median, not the €60+ trough a 50%+ wind day produces.
Evening peak (17:30–22:30): €171 → €189 → €203 → €214 → €214 → €205 → €205 → €209 → €227 → €244 → €219. Ten consecutive half-hours above €170, nine above €200. Wind held at 8–9% throughout. The merit order ran out of mid-merit gas, peakers came on, and the clearing price stepped upward in chunks. €244 is plant-scarcity territory — at this level the marginal unit is a peaker or a stressed import, not a CCGT at normal cost. The step structure is visible in the chart: the gap between €189 at 18:00 and €244 at 22:00 isn’t more expensive gas — it’s a different plant class entirely.
The peak built for five hours before topping at 22:00 — late, not the conventional 19:00–20:00. Demand stayed high into the late evening and wind never recovered to provide relief.
Price vs Wind #
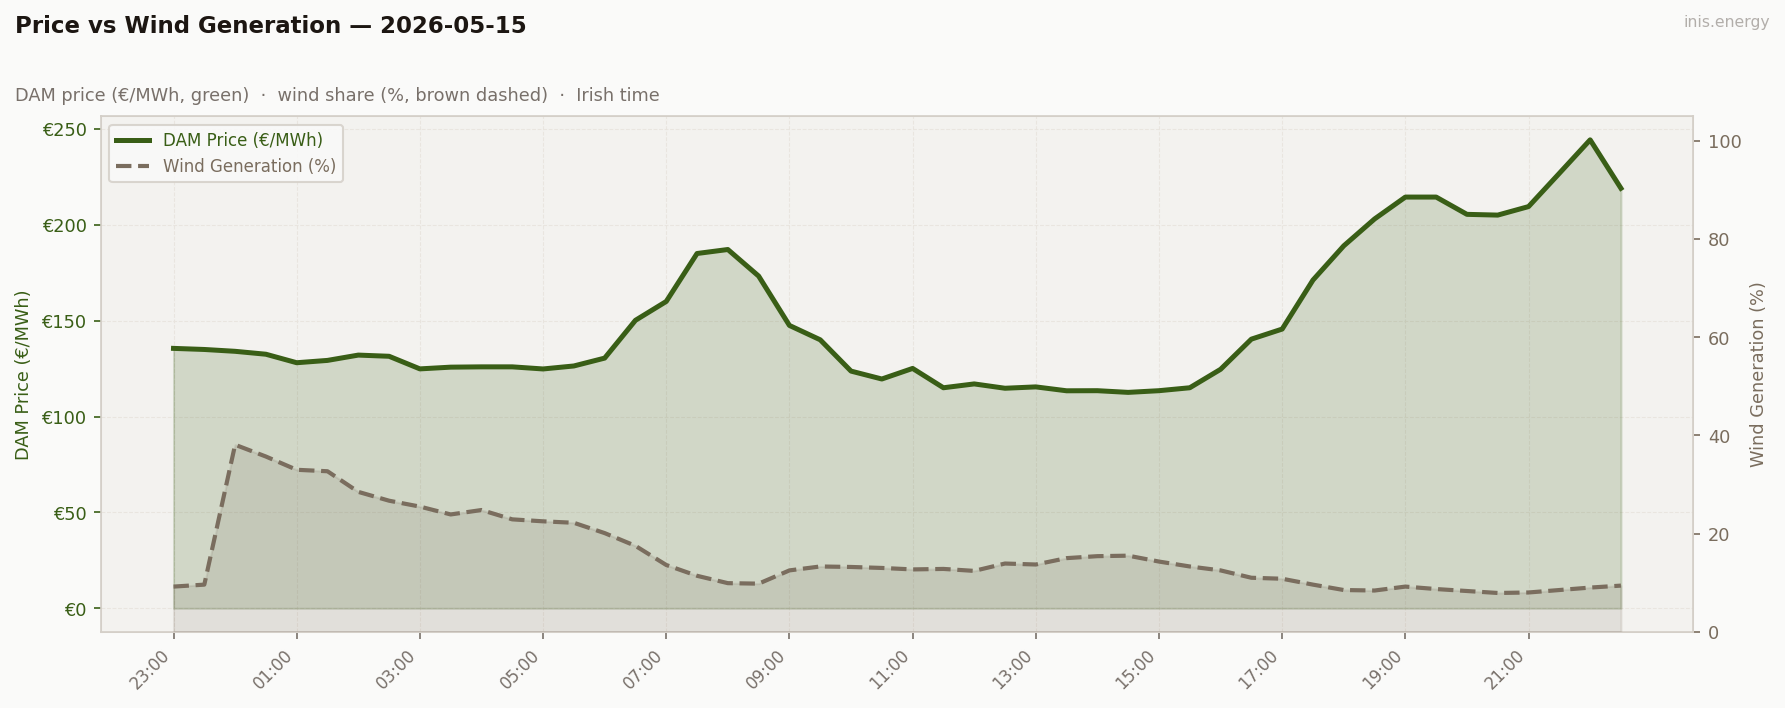
Mean wind: 15.8% · Range: 7.9%–38.1%
Wind 7.9%–38.1%, mean 15.8%. The period-3 (00:00) reading of 38.1% is the now-familiar EirGrid boundary glitch — prices at 00:00 (€134) didn’t respond to it, confirming it wasn’t a physical event.
Through the actual day: wind generated most in the modestly-priced overnight hours (22–33% from 02:00–05:00 when prices were €124–132) and least during the evening scarcity block (8–9% from 18:00–22:30 when prices ran €189–244). Wind’s capture price sits well above the daily mean in percentage terms — but that figure needs context. Wind generated almost nothing during the €200+ scarcity block, so the elevated capture rate is earned on a low volume of evening MWh. The scarcity premium was missed almost entirely.
A wind farm’s annual revenue suffers most not on uniformly cheap days like Wednesday (where the mean is suppressed, but wind captures all of a suppressed market) but on days like Friday — where prices are high and wind happens to be at minimum during the expensive hours. May 13 looked worse on the headline (€110 mean); May 15 was structurally worse for revenue per MWh actually generated in peak periods. The price-suppression argument and the capture-price argument run in opposite directions and a serious wind analyst needs both.
Week in Context #
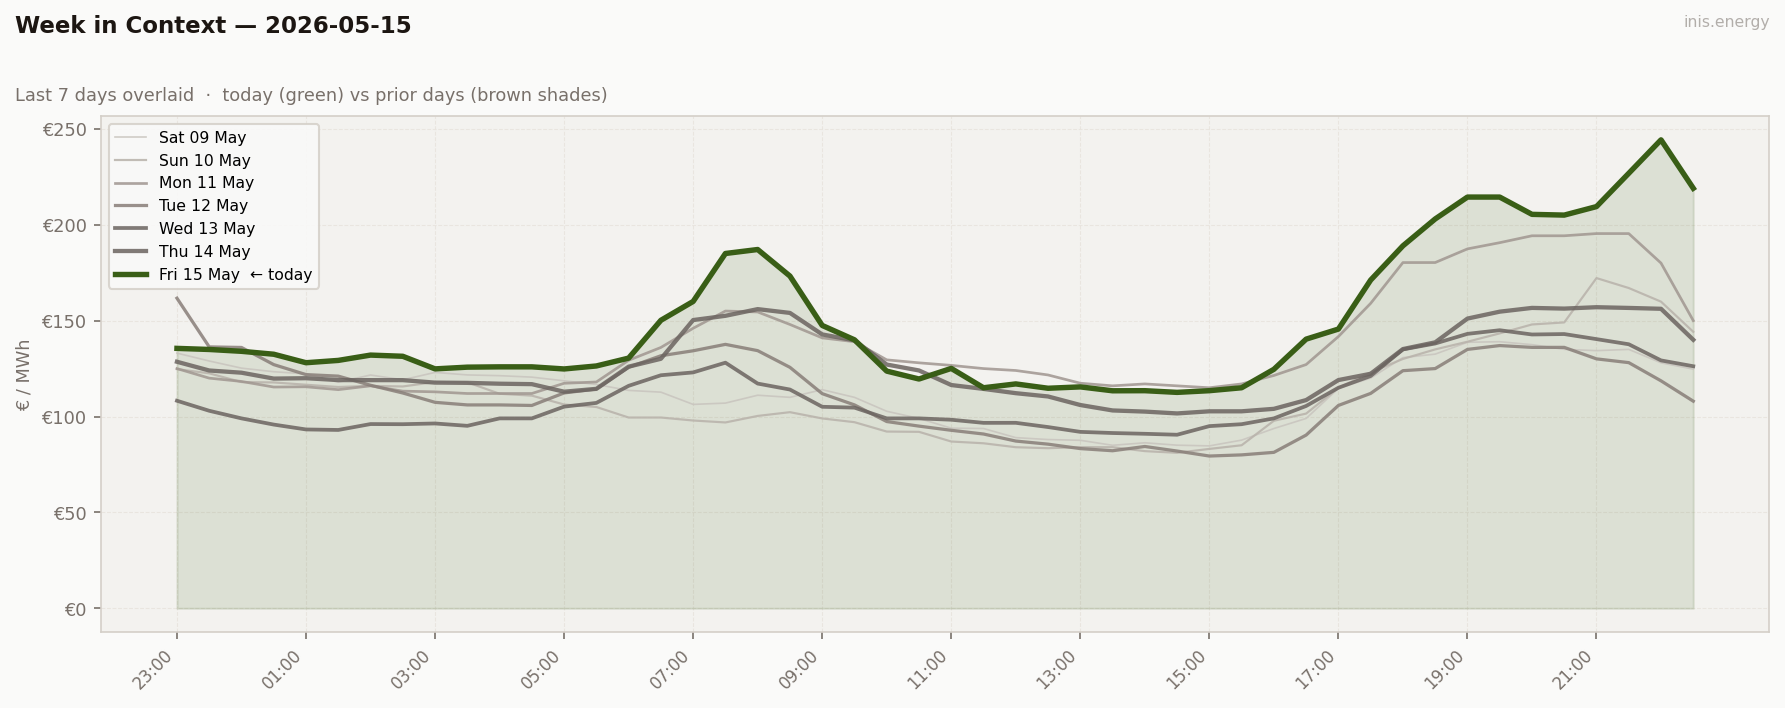
The full Mon–Fri working week now in view. Five data points: 23% / 47% / 60% / 53% / 16% wind → €138 / €112 / €110 / €127 / €150 mean.
The non-linearity is visible in the data. Going from 47% to 60% (+13pp, Tue→Wed) dropped the mean €2 — diminishing returns at the top of the wind distribution. Going from 53% to 16% (−37pp, Thu→Fri) lifted the mean €23 and produced 9 scarcity hours. The merit order doesn’t price linearly: incremental wind above 40% barely moves prices because gas is already at low load; pull wind down through the 20–25% threshold and the marginal plant steps up into peakers. Friday’s line should tower above the rest in the evening block. The week’s arc in a single chart.
Price Duration Curve #
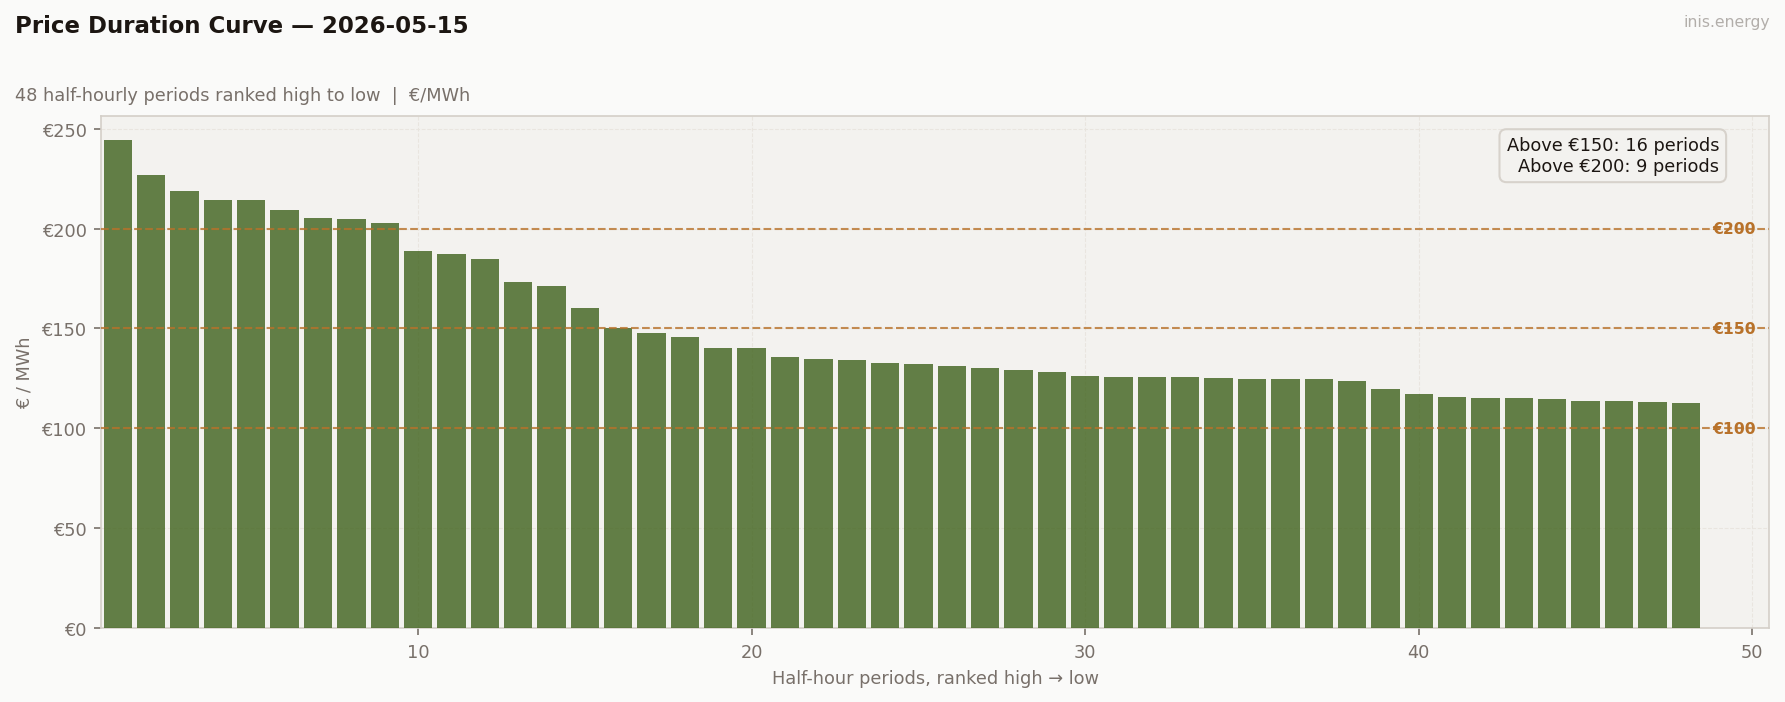
Periods above €150: 16 (33% of day) · Above €200: 9 (19% of day)
16 above €150, 9 above €200. A top-plateau structure, distinct from the top-shoulder shapes of Monday and Thursday.
The comparison: May 13 (Wed) was flat-and-low — wind dominating, no structure. May 14 (Thu) had a top shoulder — two peak blocks above €150, broad middle. Today has a top plateau: 9 periods clustered in the €200–244 range, a broad middle section, a thin tail. The plateau is the scarcity block. Periods within a scarcity event cluster near the same clearing price (peaker marginal cost), so the PDC compresses them into a flat top rather than spreading them across a slope.
May 4 bank holiday had zero periods above €200 despite a €152 mean. Today has 9 above €200 on a €150 mean. Same price level, completely different PDC topologies. The average hides the distribution; the distribution is what matters for storage.
Peak / Off-Peak Spread #
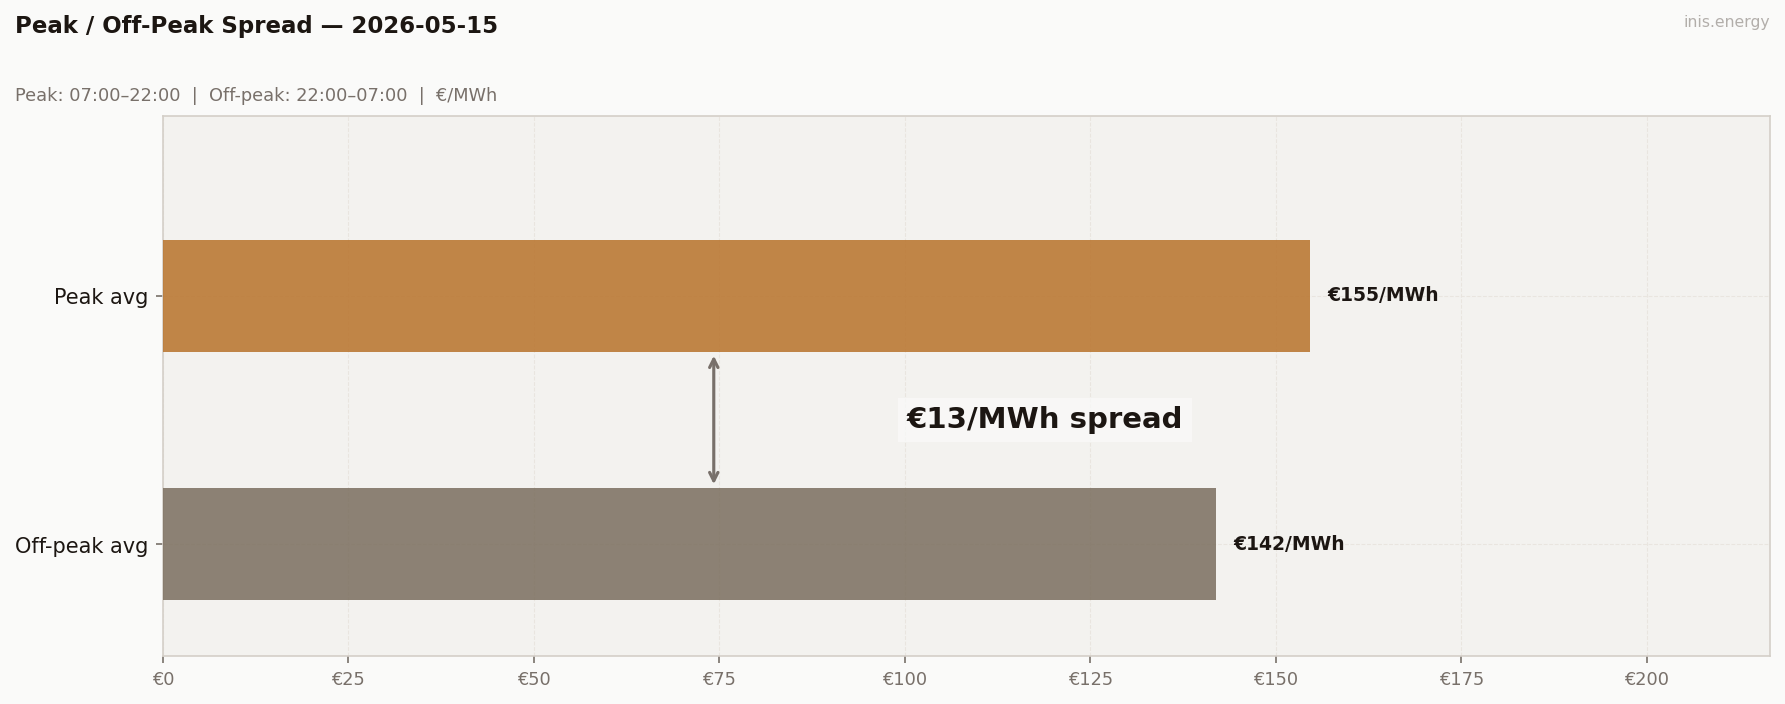
Peak avg (07:00–22:00): €154.68/MWh · Off-peak avg: €141.95/MWh · Spread: €12.73/MWh
+€12.73. With 9 periods above €200 in the peak window, you might expect a spread of €60+. You don’t get one, because the overnight wasn’t cheap.
The off-peak ran €124–135 across 18 periods — gas marginal at 15–22% wind, no surplus, no structural trough. The same gas-marginal overnight floor that compressed Thursday’s spread to €5.90 is here limiting Friday’s to €12.73, even with €200+ scarcity in the peak window.
The practical consequence: peak/off-peak averaging understates Friday’s volatility by nearly 9x (spread €12.73, captured BESS spread €112). Peak/off-peak is a coarse instrument. The PDC plateau is the correct frame for reading a scarcity day. A BESS operator sizing revenue expectations against the peak/off-peak spread would have missed 90% of today’s opportunity.
BESS Dispatch Signal #
| Price | Time | Energy | Value | |
|---|---|---|---|---|
| Charge | €113/MWh | 13:30 | 2 MWh | −€226 |
| Discharge | €225/MWh | 21:00 | 1.7 MWh (85% RTE) | +€382 |
| Gross profit | €156 | |||
| Price spread | €112/MWh | ROI: 68.8% |
Simulated 1MW/2MWh battery, one optimal DAM cycle. Gross before network charges and capacity costs.
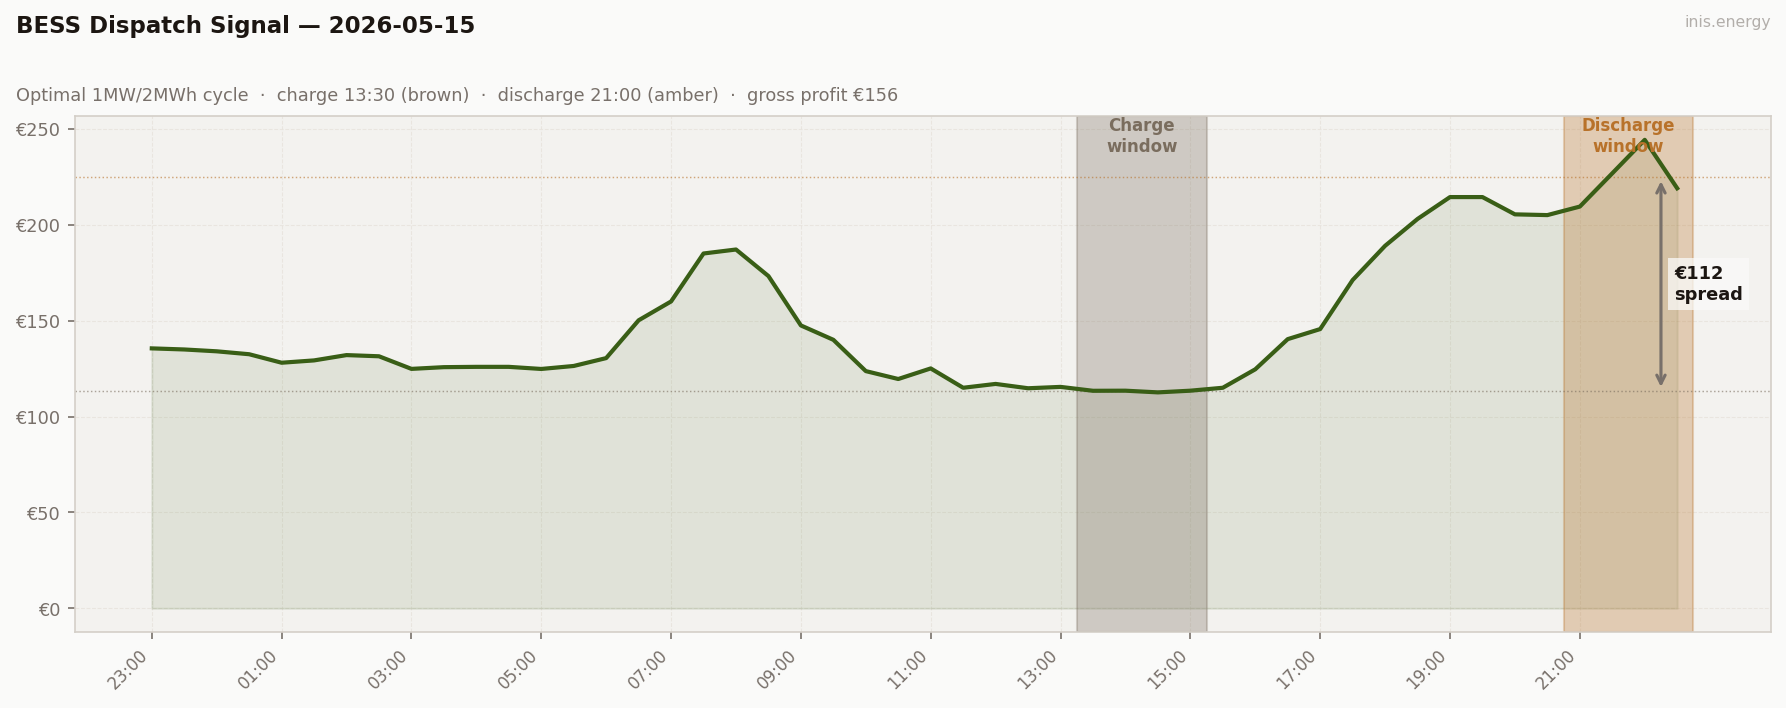
€156 gross — the new high of the run. Charged at 13:30 (€113, midday belly), discharged into the 21:00–22:30 scarcity block (averaging €225). Captured spread €112 — the widest of the series by a wide margin.
Discharge window note: the optimiser captured four consecutive late-evening half-hours (21:00, 21:30, 22:00, 22:30) cleanly inside the SEM day proper. No boundary caveat, no misattribution. Today’s €156 belongs entirely to May 15.
The operational implication is direct: BESS revenue concentrates in a small number of volatile days, and forecast skill on those days is worth more than dispatch optimisation on the calm majority. Friday is the case in point.
Commentary #
The wind regime broke. After four consecutive working days at 23%, 47%, 60%, 53%, Friday cleared with 15.8% wind — and the I-SEM produced the first scarcity event since May 7. Mean lifted €23 to €149.91, the peak hit €244.26 at 22:00 (the highest single print of the 13-day run), and 9 of 48 half-hours cleared above €200. Std dev at €37.62 was more than double Thursday’s €18.15. The week’s wind-suppression arc played in reverse, hard.
The full Mon–Fri wind series is now the week’s most analytically valuable sequence: 23% / 47% / 60% / 53% / 16% → €138 / €112 / €110 / €127 / €150. The non-linearity is the point. Going from 47% to 60% (+13pp, Tue→Wed) dropped the mean €2 — diminishing returns at the top of the wind distribution. Going from 53% to 16% (−37pp, Thu→Fri) added €23 and produced 9 scarcity hours. The merit-order curve is convex: incremental wind above 40% barely moves prices; pull wind down through the 20–25% threshold and the marginal plant steps into peakers. The price doesn’t ramp — it steps. Friday’s evening chart shows the step structure: €189 at 18:00, €214 by 19:00, €244 by 22:00. That’s a different plant class clearing the market, not more expensive gas.
For storage, the payday. A simulated 1MW/2MWh battery captured a €112 spread by charging in the midday belly (€113 at 13:30) and discharging cleanly into the 21:00–22:30 scarcity block (€225 average). Gross €156, ROI 68.8%. BESS revenue concentrates in a small number of volatile events. Forecast skill on those days is worth more than perfect dispatch on the calm 80% of the year. Friday is the case in point.
Half-hourly data — 2026-05-15
| Period | Time | Price (€/MWh) | Wind % |
|---|---|---|---|
| 1 | 23:00 | 135.53 | 9.2% |
| 2 | 23:30 | 134.96 | 9.6% |
| 3 | 00:00 | 134.00 | 38.1% |
| 4 | 00:30 | 132.48 | 35.7% |
| 5 | 01:00 | 128.05 | 33.0% |
| 6 | 01:30 | 129.26 | 32.7% |
| 7 | 02:00 | 132.03 | 28.5% |
| 8 | 02:30 | 131.41 | 26.7% |
| 9 | 03:00 | 124.84 | 25.5% |
| 10 | 03:30 | 125.74 | 23.9% |
| 11 | 04:00 | 125.90 | 24.8% |
| 12 | 04:30 | 125.90 | 22.9% |
| 13 | 05:00 | 124.80 | 22.5% |
| 14 | 05:30 | 126.36 | 22.2% |
| 15 | 06:00 | 130.46 | 20.1% |
| 16 | 06:30 | 150.17 | 17.5% |
| 17 | 07:00 | 160.00 | 13.6% |
| 18 | 07:30 | 185.00 | 11.4% |
| 19 | 08:00 | 187.08 | 9.9% |
| 20 | 08:30 | 173.23 | 9.8% |
| 21 | 09:00 | 147.49 | 12.5% |
| 22 | 09:30 | 140.00 | 13.3% |
| 23 | 10:00 | 123.68 | 13.2% |
| 24 | 10:30 | 119.56 | 13.0% |
| 25 | 11:00 | 125.08 | 12.7% |
| 26 | 11:30 | 115.00 | 12.8% |
| 27 | 12:00 | 117.00 | 12.4% |
| 28 | 12:30 | 114.74 | 13.9% |
| 29 | 13:00 | 115.45 | 13.7% |
| 30 | 13:30 | 113.42 | 15.0% |
| 31 | 14:00 | 113.47 | 15.4% |
| 32 | 14:30 | 112.59 | 15.5% |
| 33 | 15:00 | 113.47 | 14.3% |
| 34 | 15:30 | 115.00 | 13.3% |
| 35 | 16:00 | 124.62 | 12.5% |
| 36 | 16:30 | 140.35 | 11.0% |
| 37 | 17:00 | 145.60 | 10.8% |
| 38 | 17:30 | 171.15 | 9.6% |
| 39 | 18:00 | 189.00 | 8.5% |
| 40 | 18:30 | 203.01 | 8.4% |
| 41 | 19:00 | 214.42 | 9.2% |
| 42 | 19:30 | 214.42 | 8.7% |
| 43 | 20:00 | 205.41 | 8.3% |
| 44 | 20:30 | 205.02 | 7.9% |
| 45 | 21:00 | 209.46 | 8.0% |
| 46 | 21:30 | 226.81 | 8.5% |
| 47 | 22:00 | 244.26 | 9.0% |
| 48 | 22:30 | 219.00 | 9.4% |
Compare your business electricity and gas rates in minutes with INIS Energy Brokers.
Compare rates