I-SEM Daily Briefing — 16 May 2026
Table of Contents
Market Snapshot
| Metric | Value |
|---|---|
| Mean DAM Price | €149.27/MWh |
| Median Price | €141.93/MWh |
| Std Dev | €22.7/MWh |
| Peak Price | €220.0/MWh (23:00) |
| Min Price | €123.99/MWh (16:00) |
| Price Range | €96.01/MWh |
| Periods above €150 | 16 of 48 (33%) |
| Periods above €200 | 1 of 48 (2%) |
| Peak Avg (07–22) | €144.96/MWh |
| Off-peak Avg (22–07) | €156.45/MWh |
| Peak/Off-Peak Spread | €-11.49/MWh |
| Wind % of Demand | 31.2% |
| Wind Range | 9.2%–57.0% |
| Mean Demand | 3688 MW |
Price Profile #
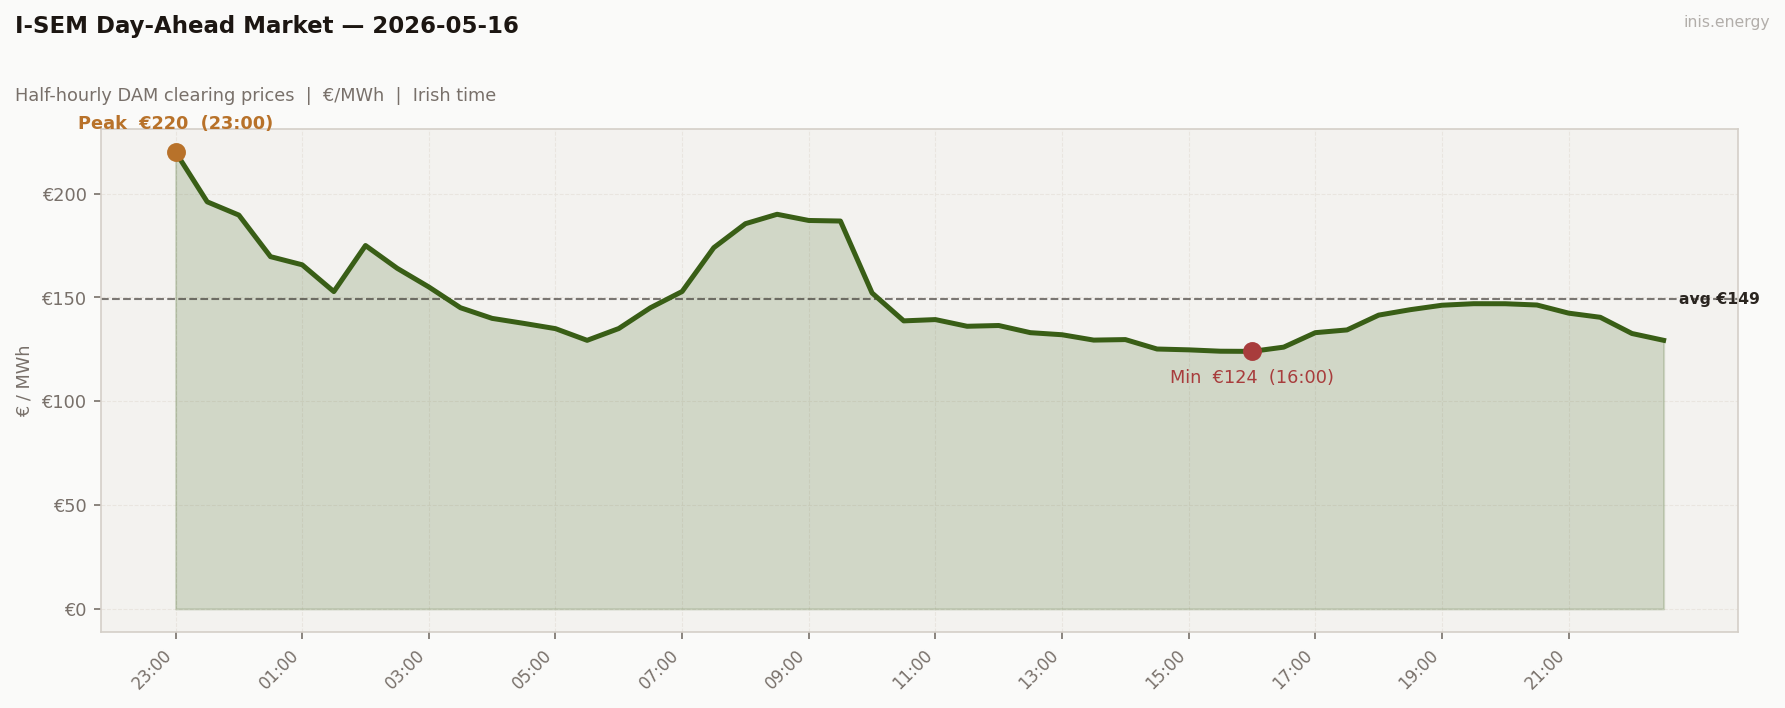
Std dev €22.7/MWh · Median €141.93/MWh · Periods above €150: 16 of 48 (33%)
The chart opens with two periods that belong to Friday: 23:00 at €220 and 23:30 at €196 — the very tail of Friday’s scarcity event. By 00:00 the scarcity has cleared and Saturday’s actual profile takes over. Four distinct blocks:
Scarcity tail + descent (23:00–05:30): €220 → €196 → €190 → €145 → €129. The post-scarcity wind-down, demand-driven and gradual. Weekend overnight load is light; wind held at 9–13% through this block with no recovery surge. €91 of price fall in six hours.
Morning ramp (06:00–08:30): €135 → €145 → €153 → €174 → €185 → €190. €55 added in 2.5 hours, wind holding at 10–25%. One of the rare weekend mornings this run that looked like a working-day ramp. €190 at 08:30 is more expensive than anything Thursday managed.
Wind recovery midday (09:00–16:00): €187 → €152 → €138 → €133 → €124. €63 of suppression across seven hours, tracking wind climbing from 22% to 57%. Near-linear wind climb, near-linear price fall. The cleanest within-day cannibalisation chart of the run.
Contained evening (17:00–22:30): €133 → €141 → €147 → €147 → €133 → €129. Peak capped at €147 at 19:30 with wind still at 45–55%. No scarcity, mid-merit gas sufficient.
Saturday morning was Friday’s market — low wind, peaker-adjacent, €190 ramp. Saturday afternoon was last Saturday’s market — high wind, suppressed, €124 floor. Two different regimes, separated by the noon wind recovery.
Price vs Wind #
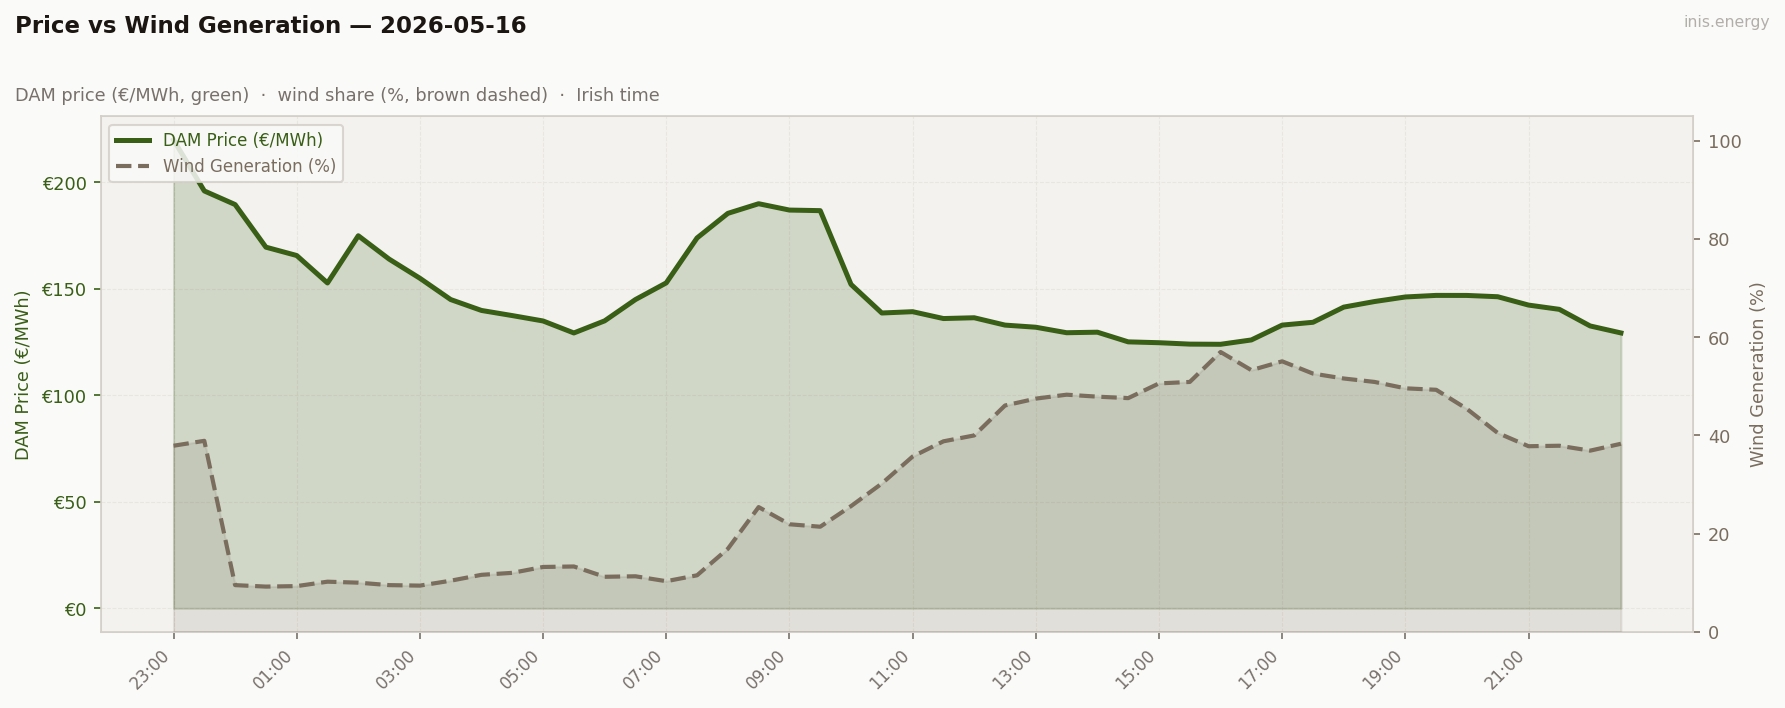
Mean wind: 31.2% · Range: 9.2%–57.0%
Wind 9.2%–57.0%, mean 31.2%. The 48-point range is the structural story — 9–13% overnight and morning, then a near-linear climb from 22% at 09:30 to 57% at 16:00, then a modest easing to 38–40% in the late evening.
Period 3 (00:00) shows another EirGrid boundary glitch: 23:30 wind 38.9%, 00:00 wind 9.5%. The market cleared at €190 at 00:00 — consistent with 9–10% wind, not 39%. Third consecutive occurrence of this specific artefact at period 3. It flips direction day-to-day (Friday’s file had wind appearing at 00:00, Saturday’s has it disappearing), which suggests a systematic timezone or SEM-day offset bug in the source data rather than random noise. Worth raising as a real data quality issue.
Wind’s capture price today sits well below the daily mean: wind generated three to four times more during cheap afternoon hours (47–57% wind at €124–133) than expensive morning hours (10–25% wind at €152–190). Capture rate: roughly 80–85% of the daily mean. The within-day cannibalisation story, isolated from everything else — wind absent in the expensive block, abundant in the cheap one.
Week in Context #
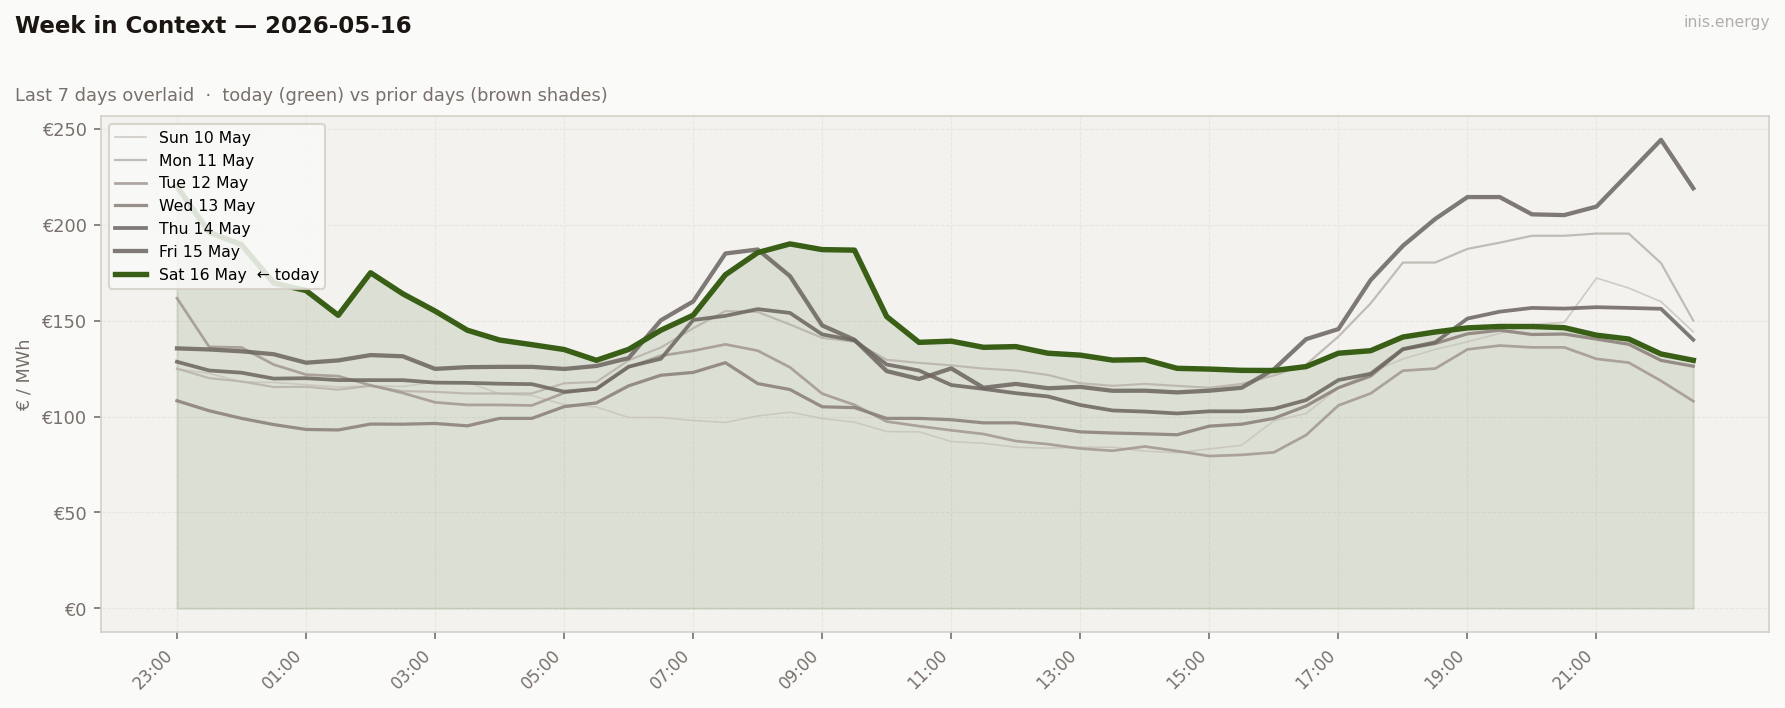
Friday’s spike should be the most visually dominant line in the comparison — evening block running €200–244, clear step above every other day of the week. Saturday’s line sits near Friday’s mean level but with completely inverted shape: high in the first few hours (boundary spillover), collapsing through the morning, flat and moderate in the evening. The chart shows why identical headline means can describe structurally different days.
Price Duration Curve #
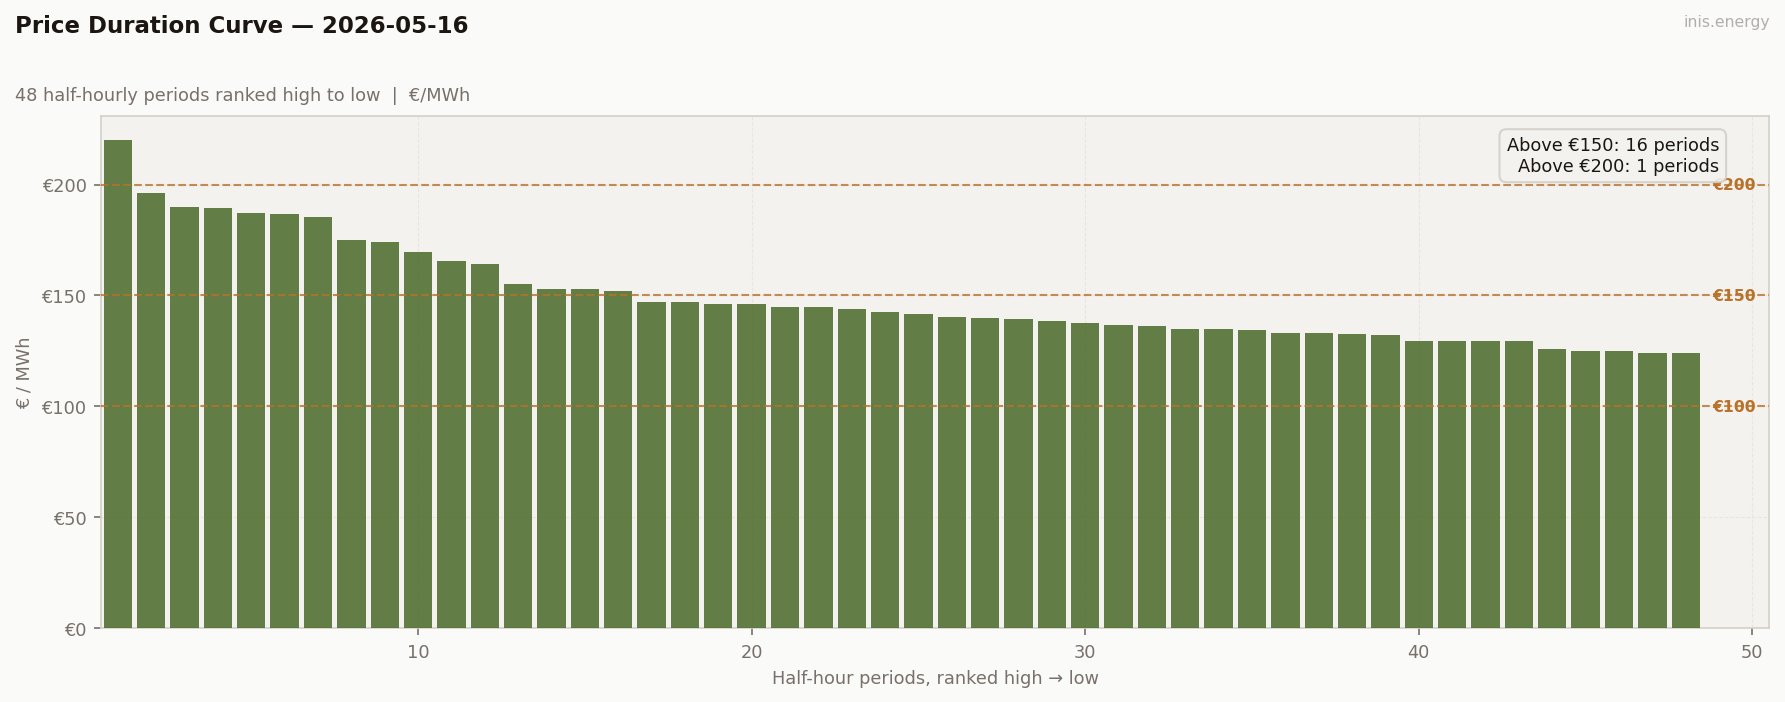
Periods above €150: 16 (33% of day) · Above €200: 1 (2% of day)
16 above €150, 1 above €200. The one above-€200 period is the boundary artefact (23:00, €220). The actual Saturday profile has zero scarcity periods.
The PDC looks similar to Thursday’s top-shoulder shape — same scarcity-hour count, similar curve structure. Cause is entirely different. Thursday’s top shoulder was two genuine working-day peak blocks. Saturday’s is Friday-spillover + a low-wind morning ramp + a contained €147 evening peak. Same curve, different mechanics. A PDC compresses the time dimension; the chronological chart is required to tell the two apart.
Peak / Off-Peak Spread #
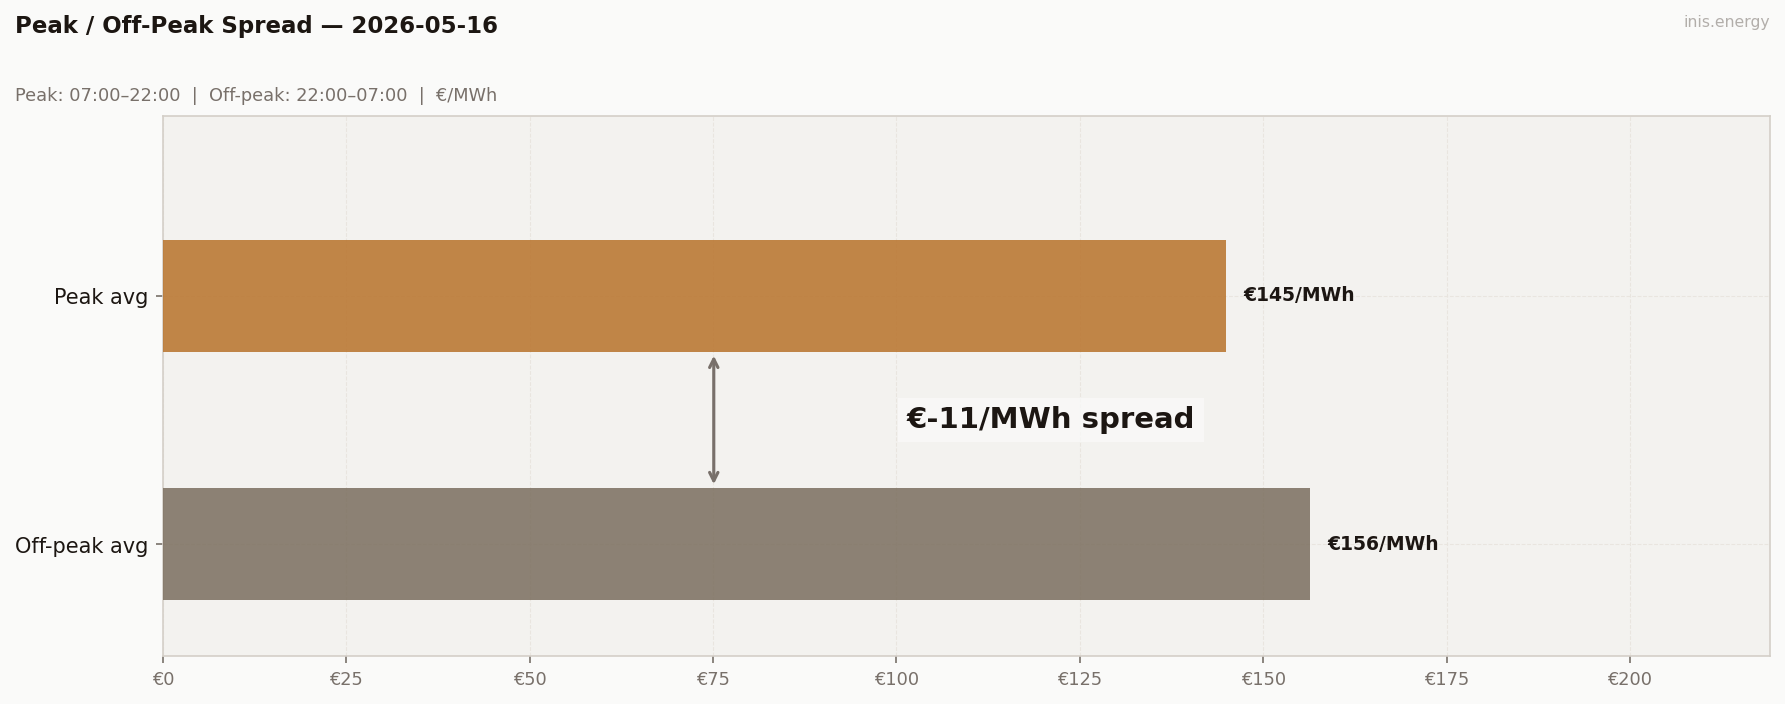
Peak avg (07:00–22:00): €144.96/MWh · Off-peak avg: €156.45/MWh · Spread: €-11.49/MWh
-€11.49. The off-peak window contains both boundary spillover (€220, €196) and the post-scarcity elevated overnight (€152–190 through 00:30–09:00), dragging the off-peak average above the peak. Strip the two boundary periods and the off-peak average drops to roughly €141 — the spread flips positive.
Third inverted spread of the run (May 9, May 12, May 16). All three are weekend or post-scarcity days where the off-peak window picks up structurally expensive hours. The pattern is consistent: the peak/off-peak metric assumes cheap hours sit overnight. On weekends with high renewables or days following a scarcity event, the assumption fails. The spread is a portfolio-management artifact; it is not a dispatch signal on these days.
BESS Dispatch Signal #
| Price | Time | Energy | Value | |
|---|---|---|---|---|
| Charge | €124/MWh | 14:30 | 2 MWh | −€249 |
| Discharge | €147/MWh | 19:00 | 1.7 MWh (85% RTE) | +€249 |
| Gross profit | €0 | |||
| Price spread | €22/MWh | ROI: 0.1% |
Simulated 1MW/2MWh battery, one optimal DAM cycle. Gross before network charges and capacity costs.
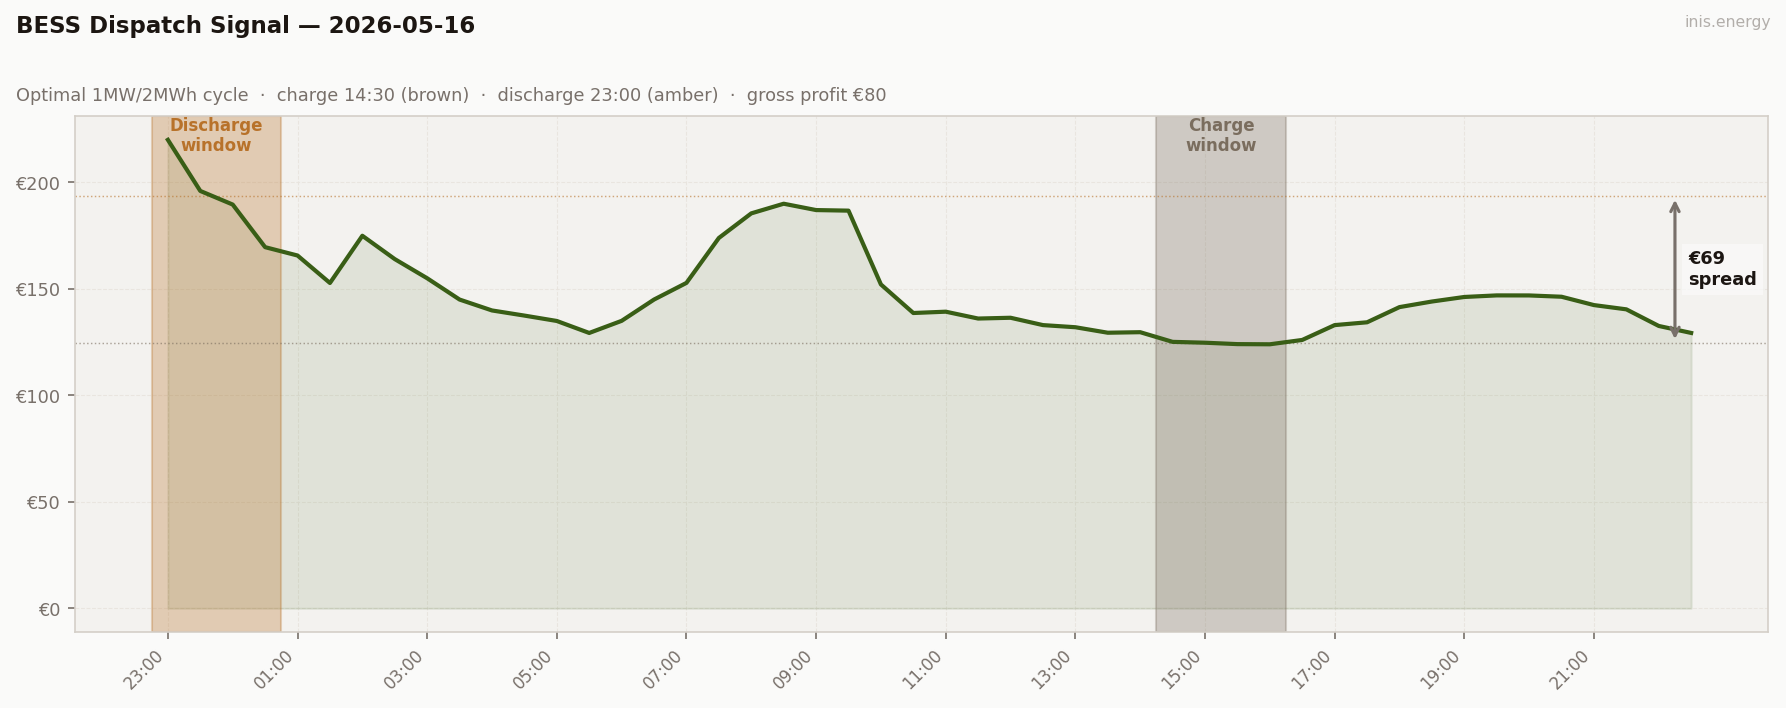
Updated 2026-08-27: the BESS simulation previously allowed the discharge window to occur before the charge window ended, which is physically impossible for a battery — in this case, by picking the 23:00–00:30 block that’s actually Friday’s evening tail carried into Saturday’s file, before Saturday’s own 14:30 charge. Recalculated enforcing charge-before-discharge: gross profit corrected from €80 to €0 (a €0.26 breakeven).
Almost no trade today. The optimiser charges at 14:30 (€124, wind-rich afternoon) and the only causally-reachable discharge window left is the contained evening peak at 19:00 (€147) — €22 of spread, which just about covers round-trip losses and nothing more. Wind recovery killed the midday trough and left no real scarcity for the evening to price in: one of the weakest BESS days of the run on its own terms, not because of any attribution artefact.
Commentary #
Saturday’s mean of €149.27 reads as if the market sustained Friday’s scarcity. It didn’t. The I-SEM delivery day runs 23:00–22:30, and Saturday’s file opens with the tail of Friday’s evening peak: period 1 (23:00) at €220 and period 2 (23:30) at €196. By 00:00 the scarcity cleared to €190 and the conventional descent began. Strip the boundary periods and the underlying Saturday mean is closer to €146, with zero genuine scarcity events — the single above-€200 period in the stats is the artefact, not the day.
The actual Saturday structure is two different markets in one file, separated by the noon wind recovery. Before noon: wind at 9–25%, a morning ramp from €135 to €190 between 06:00 and 08:30 that looked more working-day than weekend. After noon: wind climbing near-linearly from 22% at 09:30 to 57% at 16:00, with prices falling in near-lockstep from €187 to €124. €63 of suppression across seven hours — the cleanest within-day cannibalisation chart of the run. The evening peak capped at €147 with wind still at 45–55%; a contained finish. Saturday morning was Friday’s market. Saturday afternoon was last Saturday’s.
For storage, essentially no trade: €0 gross. Charging at €124 into the wind-rich afternoon and discharging into a contained €147 evening peak captures just €22 of spread — a breakeven result once round-trip losses are counted. One of the weakest dispatch days of the run on its own terms: wind recovery flattened the midday trough, and the evening peak never built enough scarcity to price a real spread.
Half-hourly data — 2026-05-16
| Period | Time | Price (€/MWh) | Wind % |
|---|---|---|---|
| 1 | 23:00 | 220.00 | 37.9% |
| 2 | 23:30 | 196.00 | 38.9% |
| 3 | 00:00 | 189.61 | 9.5% |
| 4 | 00:30 | 169.60 | 9.2% |
| 5 | 01:00 | 165.68 | 9.3% |
| 6 | 01:30 | 152.78 | 10.2% |
| 7 | 02:00 | 174.96 | 10.0% |
| 8 | 02:30 | 164.00 | 9.5% |
| 9 | 03:00 | 155.00 | 9.4% |
| 10 | 03:30 | 145.00 | 10.4% |
| 11 | 04:00 | 139.88 | 11.6% |
| 12 | 04:30 | 137.47 | 12.0% |
| 13 | 05:00 | 134.94 | 13.2% |
| 14 | 05:30 | 129.31 | 13.3% |
| 15 | 06:00 | 135.00 | 11.2% |
| 16 | 06:30 | 145.00 | 11.3% |
| 17 | 07:00 | 152.82 | 10.3% |
| 18 | 07:30 | 173.92 | 11.5% |
| 19 | 08:00 | 185.47 | 16.9% |
| 20 | 08:30 | 190.00 | 25.4% |
| 21 | 09:00 | 187.02 | 21.9% |
| 22 | 09:30 | 186.75 | 21.4% |
| 23 | 10:00 | 152.10 | 25.6% |
| 24 | 10:30 | 138.68 | 30.2% |
| 25 | 11:00 | 139.30 | 35.7% |
| 26 | 11:30 | 136.08 | 38.8% |
| 27 | 12:00 | 136.45 | 40.0% |
| 28 | 12:30 | 133.00 | 46.1% |
| 29 | 13:00 | 132.00 | 47.5% |
| 30 | 13:30 | 129.42 | 48.3% |
| 31 | 14:00 | 129.67 | 47.9% |
| 32 | 14:30 | 125.13 | 47.6% |
| 33 | 15:00 | 124.73 | 50.6% |
| 34 | 15:30 | 124.07 | 50.9% |
| 35 | 16:00 | 123.99 | 57.0% |
| 36 | 16:30 | 126.03 | 53.3% |
| 37 | 17:00 | 133.00 | 55.1% |
| 38 | 17:30 | 134.32 | 52.6% |
| 39 | 18:00 | 141.45 | 51.6% |
| 40 | 18:30 | 144.07 | 50.9% |
| 41 | 19:00 | 146.21 | 49.6% |
| 42 | 19:30 | 146.95 | 49.3% |
| 43 | 20:00 | 146.93 | 45.4% |
| 44 | 20:30 | 146.32 | 40.5% |
| 45 | 21:00 | 142.40 | 37.8% |
| 46 | 21:30 | 140.40 | 37.9% |
| 47 | 22:00 | 132.60 | 36.9% |
| 48 | 22:30 | 129.32 | 38.3% |
Compare your business electricity and gas rates in minutes with INIS Energy Brokers.
Compare rates