I-SEM Daily Briefing — 17 May 2026
Table of Contents
Market Snapshot
| Metric | Value |
|---|---|
| Mean DAM Price | €136.77/MWh |
| Median Price | €120.17/MWh |
| Std Dev | €35.92/MWh |
| Peak Price | €227.28/MWh (22:00) |
| Min Price | €108.35/MWh (13:30) |
| Price Range | €118.93/MWh |
| Periods above €150 | 11 of 48 (23%) |
| Periods above €200 | 6 of 48 (12%) |
| Peak Avg (07–22) | €137.7/MWh |
| Off-peak Avg (22–07) | €135.22/MWh |
| Peak/Off-Peak Spread | €2.48/MWh |
| Wind % of Demand | 36.1% |
| Wind Range | 15.6%–50.0% |
| Mean Demand | 3634 MW |
Price Profile #
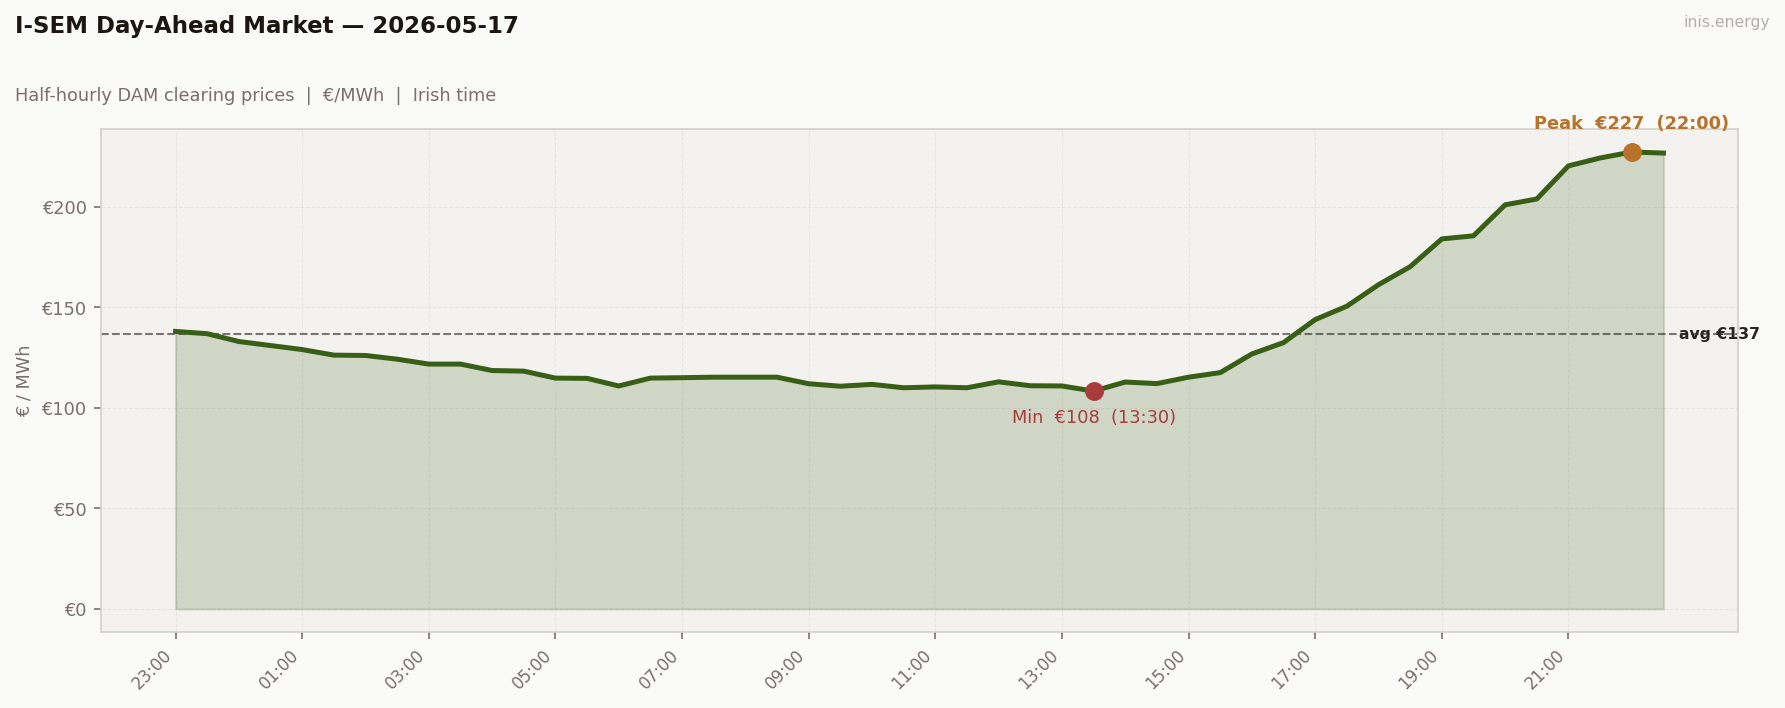
Std dev €35.92/MWh · Median €120.17/MWh · Periods above €150: 11 of 48 (23%)
Three blocks, and the build is the chart.
Soft overnight and morning (23:00 → 14:00): €108–138. Wind held 36–50% across this entire window. The day’s minimum (€108.35 at 13:30) sits here, with wind at 46.7% — a wind-rich midday on weekend demand. No meaningful morning ramp: the highest price before 17:00 was €120 at 06:30. With demand at weekend-low and wind providing 40%+ through the morning, the marginal plant stayed on mid-merit gas throughout.
The transition (14:00 → 17:00): €113 → €144. Wind began decaying from 50% at 14:00 to 37–38% by 17:00, demand returning to its weekend evening level. €31 added across six half-hours — a modest slope, but the direction was clear. The next four hours would run the same gradient three times over.
The wind-decay evening build (17:00 → 22:30): €144 → €151 → €161 → €170 → €184 → €186 → €201 → €204 → €220 → €224 → €227 → €227. Eleven consecutive half-hours rising without interruption. Wind fell from 38% at 17:00 to 20% at 22:30 — a 30-point drop over 8.5 hours — and price tracked that decline almost linearly. The peak arrived at 22:00 (€227.28), not the conventional 19:00–20:00 window. This is the structural tell: a demand-driven evening peak builds to its high when residential and commercial demand overlap, then fades as people go to bed. A wind-decay peak builds whenever wind is leaving, and Sunday’s wind kept leaving until 22:30. Different driver, different shape, different timing.
Price vs Wind #
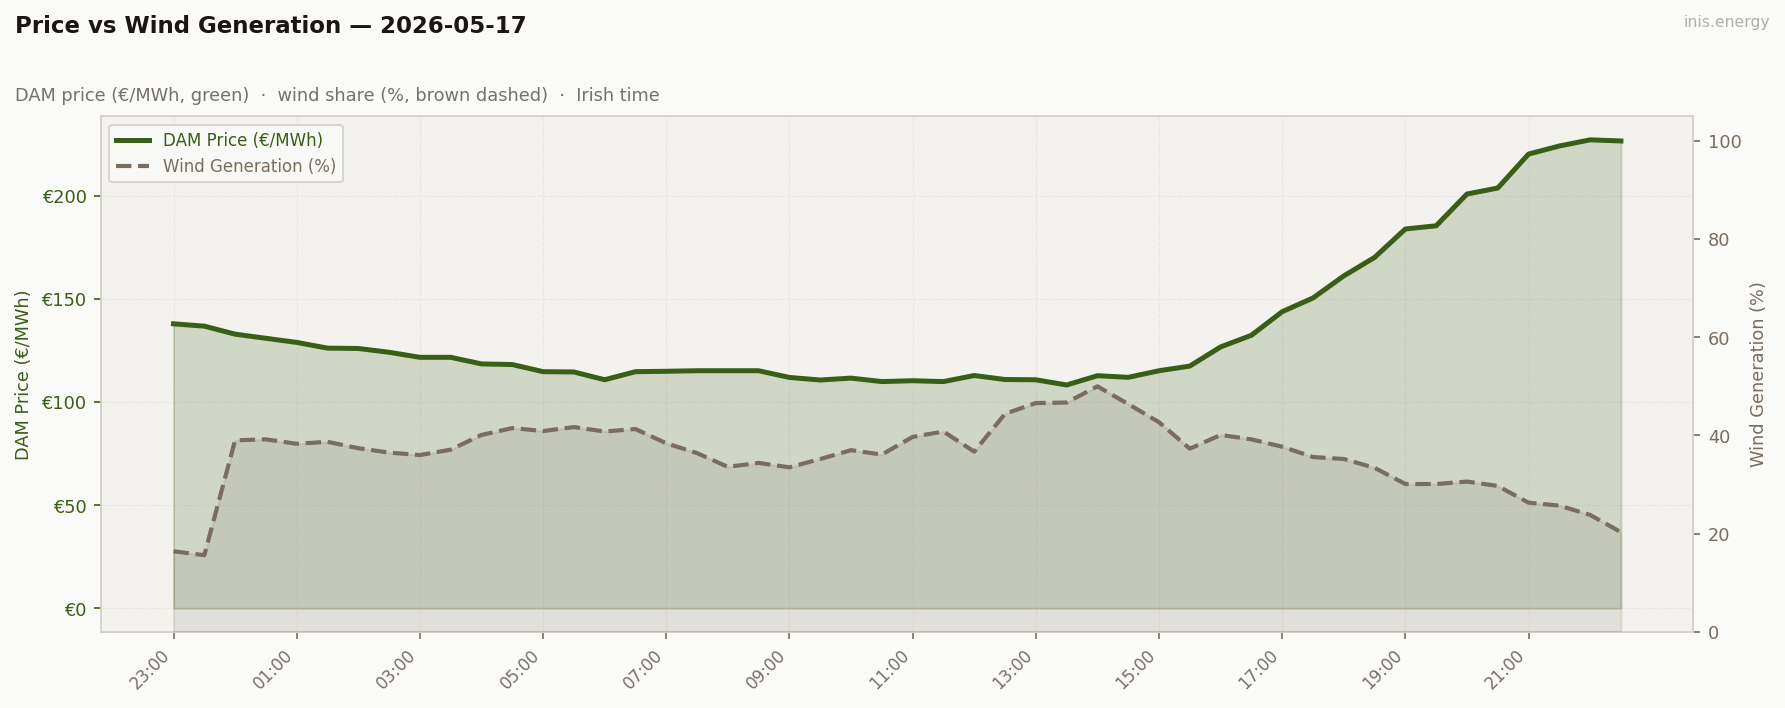
Mean wind: 36.1% · Range: 15.6%–50.0%
Wind 15.6%–50.0%, mean 36.1%. The decay from 50% at 14:00 to 20% at 22:30 — a 30-point fall over eight and a half hours — should read as a near-linear downslope on the wind chart, with prices rising in near-lockstep. Each ~3 percentage points of wind lost added roughly €11/MWh to the clearing price. Same slope as May 10’s evening decay.
Wind’s capture price was well below the daily mean. Wind generated heaviest in the cheap midday window (45–50% wind, €91–115) and minimally during the expensive late evening (20–28% wind, €201–227). Classic intra-day cannibalisation — the scarcity premium was generated exactly when wind had largely left. Capture rate roughly 80–85% of the daily mean.
Week in Context #
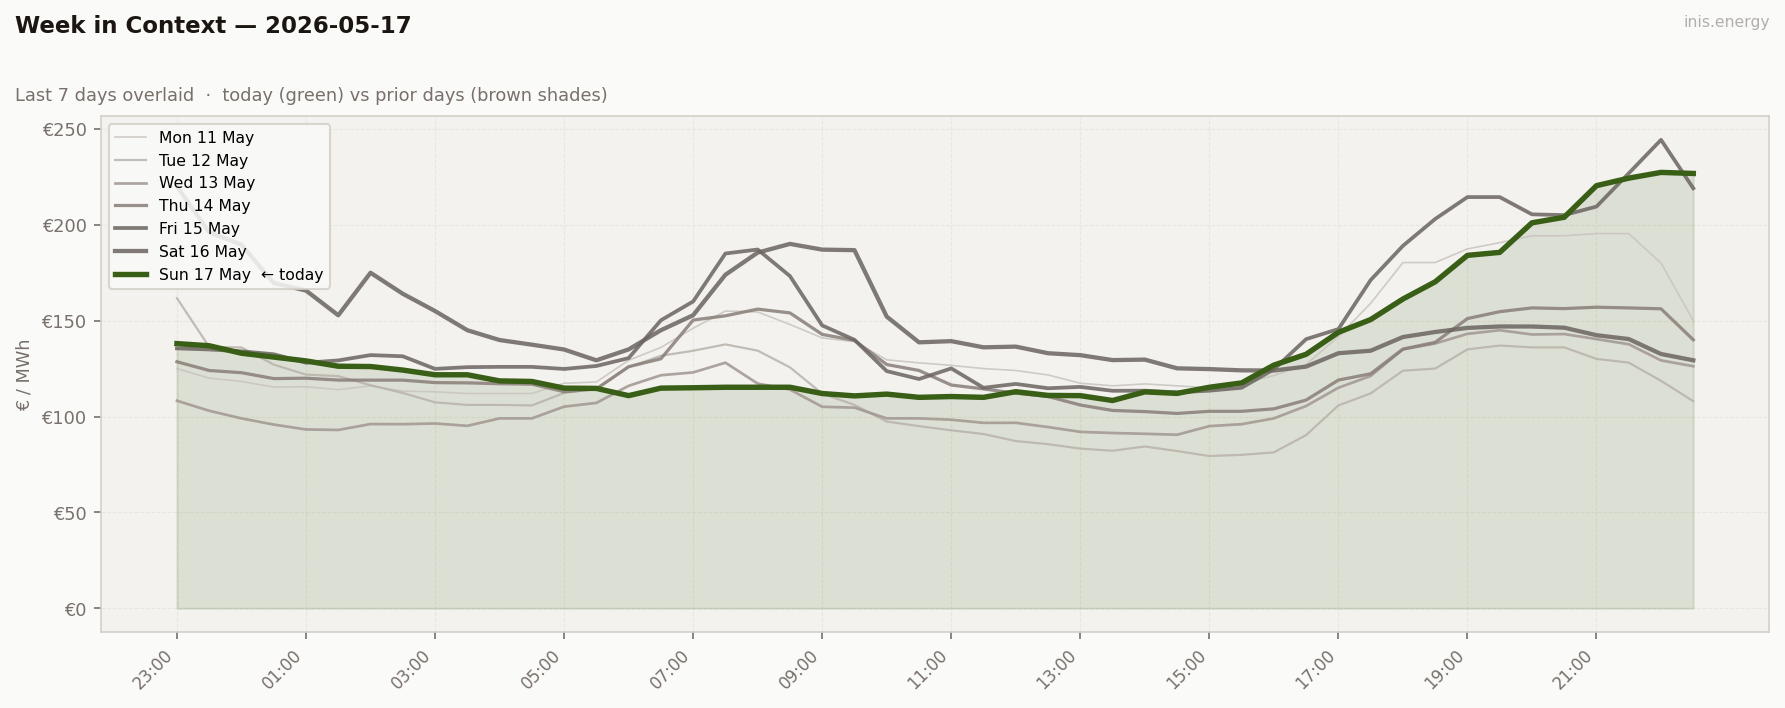
The second expensive Sunday of the run, and the clean week-on-week comparison is the analytical frame.
Sun May 10 vs Sun May 17: mean €111.62 → €136.77 (+€25), peak €172 → €227 (+€55), periods above €200 zero → six. Demand barely moved (3,444 → 3,634 MW). Wind mean dropped from 42.6% to 36.1% — but the mean hides the structural difference. May 10’s wind ranged 24–74%, oscillating from a high morning to a low evening. May 17’s wind ranged 15.6–50%, running a modest midday into a very low evening. May 17’s wind floor was lower than May 10’s evening floor. The high end was also lower. Same pattern — wind decay through the evening, residential demand building — but May 17’s trough was structurally deeper, at the worst time.
Same driver, deeper trough. Six scarcity periods from zero.
Price Duration Curve #
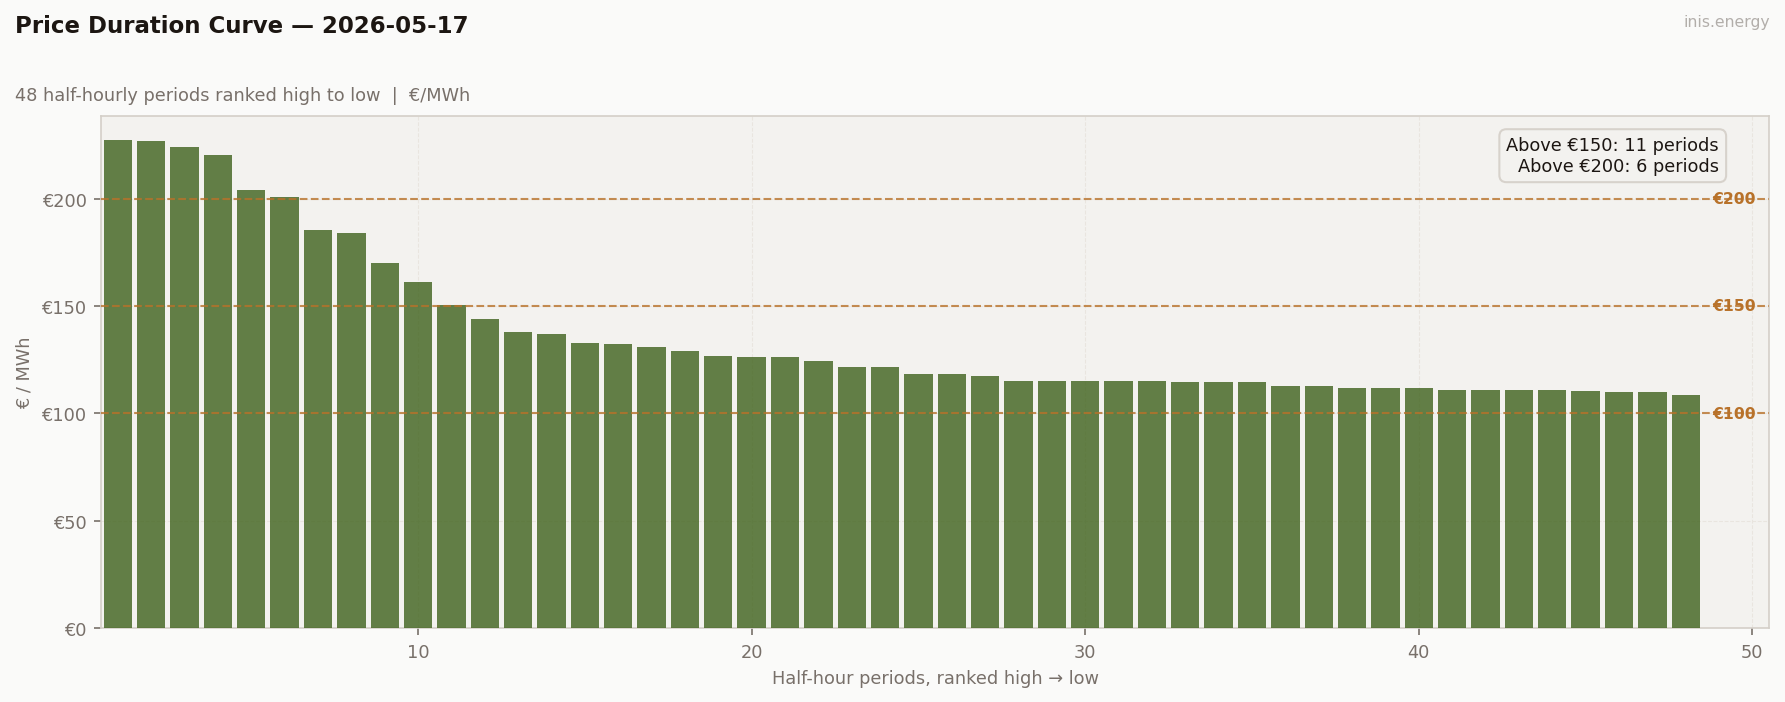
Periods above €150: 11 (23% of day) · Above €200: 6 (12% of day)
11 above €150, 6 above €200. Top plateau of 6 periods (€200–227, the 20:00 onwards block), a broad middle of roughly 25 periods clustered between €110–135, and a shallow tail that never gets below €108.
The absence of a cheap tail is the structural feature. Wind-rich midday only compressed prices to €108 — compare the €80s on May 9 or May 10 when wind was running 65–74%. May 17’s midday was moderately wind-rich (45–50%) on weekend demand, not surplus-wind. The floor is expensive relative to the peak. Expensive base, scarcity spike, no real cheap surplus — and that combination is what kills the peak/off-peak spread despite six periods above €200.
Peak / Off-Peak Spread #
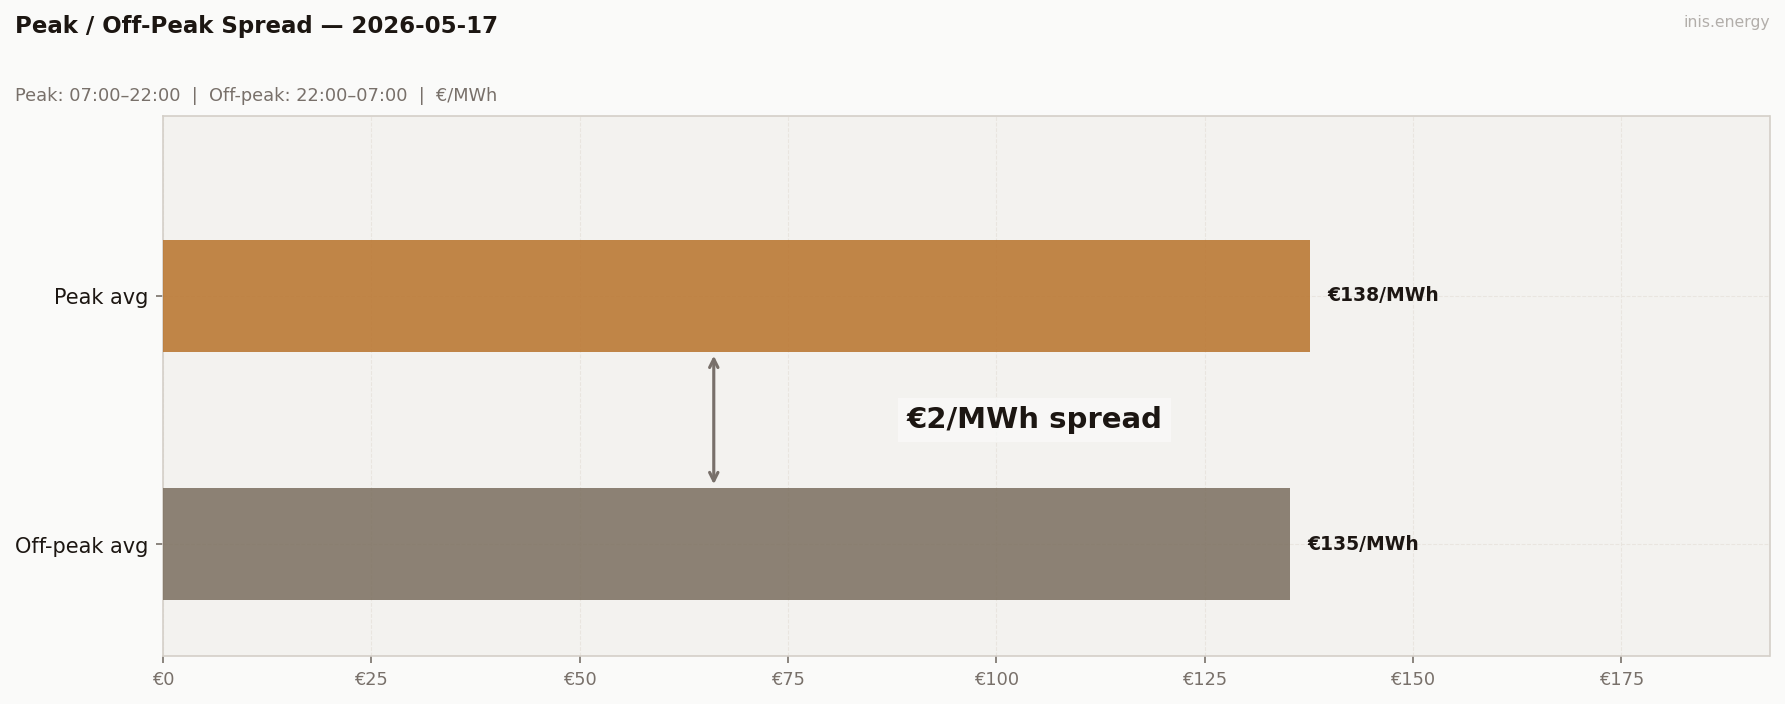
Peak avg (07:00–22:00): €137.7/MWh · Off-peak avg: €135.22/MWh · Spread: €2.48/MWh
+€2.48. Six periods above €200, and the spread is sub-€3. The puzzle unwraps when you look at which periods fall on which side of 22:00.
The SEM peak window runs 07:00–22:00. The 22:00 period (€227.28) and the 22:30 period (€226.73) — two of the six €200+ prints — land in the off-peak window by calendar convention. The off-peak window also picks up the Saturday tail at 23:00 and 23:30 (€138–137) and the entire wind-rich overnight and morning (€108–133). Two expensive half-hours and a cheap overnight dragging the off-peak average up; four expensive half-hours diluted by a wind-rich midday pulling the peak average down. The two windows collide.
The SEM peak window was defined to capture weekday demand peaks. On a Sunday where the scarcity was wind-driven, the price peaked at 22:00 — after the window closes. The metric measured what its definition told it to. The day didn’t behave the way the metric was designed for.
BESS Dispatch Signal #
| Price | Time | Energy | Value | |
|---|---|---|---|---|
| Charge | €111/MWh | 10:00 | 2 MWh | −€221 |
| Discharge | €225/MWh | 21:00 | 1.7 MWh (85% RTE) | +€382 |
| Gross profit | €161 | |||
| Price spread | €114/MWh | ROI: 72.8% |
Simulated 1MW/2MWh battery, one optimal DAM cycle. Gross before network charges and capacity costs.
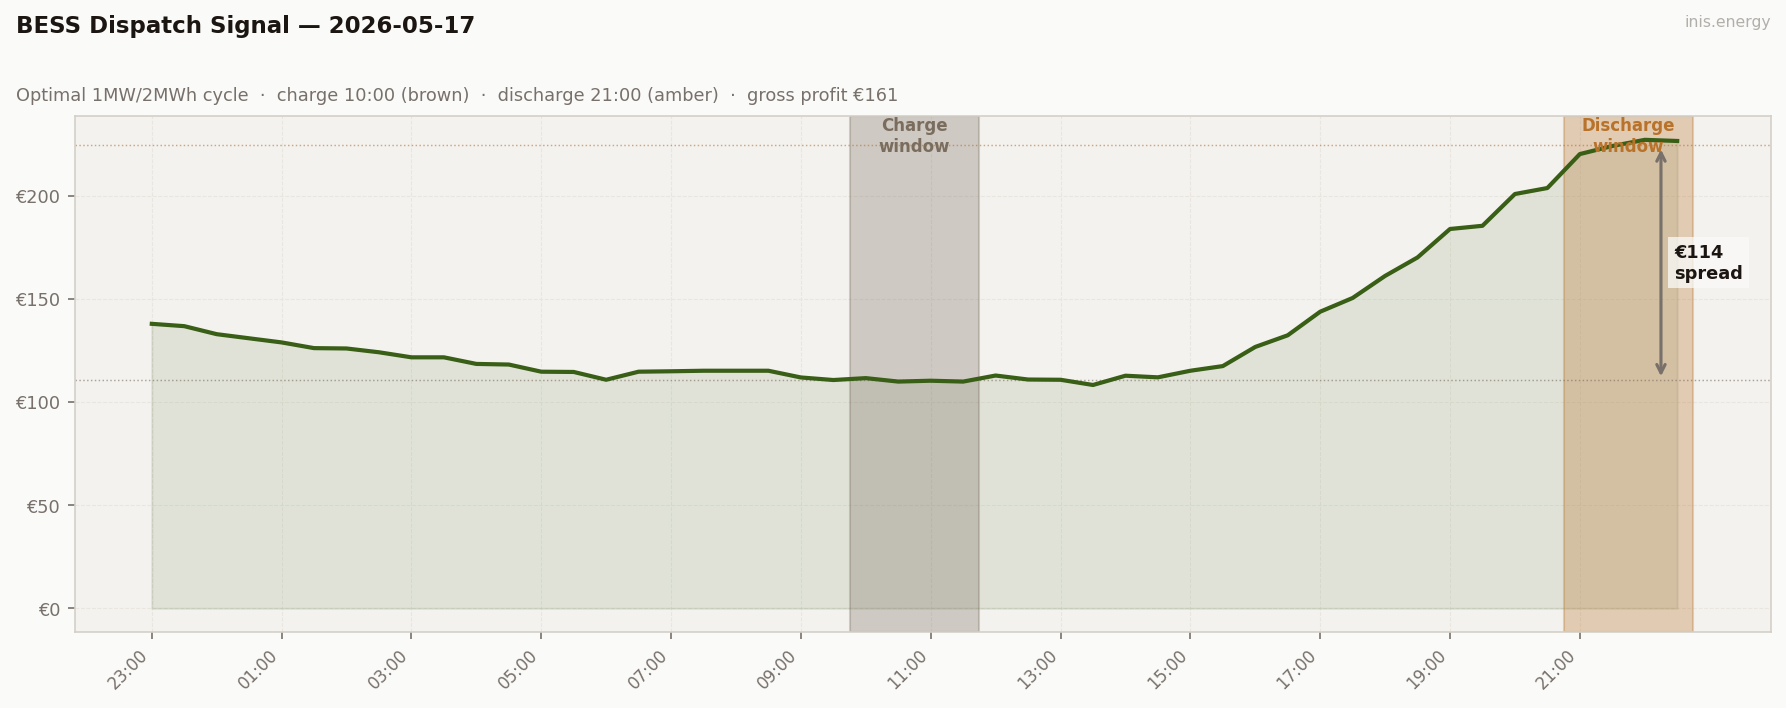
€161 gross — the highest of the run at the point of dispatch. Charged at 10:00 (€111, the late-morning fold where wind was rising and weekend demand hadn’t yet reached its afternoon level) and discharged into the 21:00–22:30 scarcity block (€225 average). Captured spread €114 — wider than May 15’s €112.
The charge time is the operational note. 10:00 isn’t the conventional midday slot (most days in the run used 13:00–14:30). The model found the day’s cheapest window in the late-morning fold rather than the standard early-afternoon trough. A real operator forecasting today’s shape would need to identify that late-morning cheapness rather than defaulting to the 13:30 charge that works on most days.
Commentary #
A Sunday with €200+ prints. Mean €136.77/MWh, peak €227.28 at 22:00, six consecutive half-hours above €200 from 20:00 to 22:30. The most expensive Sunday of the run — and it ran on weekend demand of 3,634 MW. The driver was pure wind decay: wind held 45–50% through midday, then fell steadily from 50% at 14:00 to 20% by 22:30. Prices climbed in lockstep — an eleven-half-hour continuous build from €144 at 17:00 to €227 by 22:00, each ~3 percentage points of wind lost adding roughly €11/MWh to the clearing price.
The peak arrived at 22:00, not the conventional 19:00–20:00. That’s the structural tell. A demand-driven evening peak builds to its high when residential and commercial demand overlap, then fades as people go to bed. A wind-decay peak builds whenever wind is leaving — and Sunday’s wind kept leaving until 22:30. Different driver, different shape, different timing. The PDC shows it: a top plateau of 6 periods above €200, a broad middle in the €110–135 band, a shallow tail that never got below €108. Expensive base, scarcity spike, no real cheap surplus — and that absence of a cheap tail is why the peak/off-peak spread came in at just +€2.48 despite six scarcity periods. The SEM peak window closes at 22:00; two of the six €200+ prints are off-peak by calendar convention. The metric measured what its definition told it to.
For storage, a strong day at the point of dispatch. A simulated 1MW/2MWh battery charged in the late-morning fold (€111 at 10:00 — earlier than the conventional midday slot) and discharged into the 21:00–22:30 scarcity block (€225 average). Captured spread €114, gross €161, ROI 72.8%. The unusual charge time is the operational footnote: the cheapest window was late morning, not early afternoon, and a real operator would need to spot it rather than default to the conventional 13:30 charge.
Half-hourly data — 2026-05-17
| Period | Time | Price (€/MWh) | Wind % |
|---|---|---|---|
| 1 | 23:00 | 138.02 | 16.4% |
| 2 | 23:30 | 136.89 | 15.6% |
| 3 | 00:00 | 133.00 | 39.0% |
| 4 | 00:30 | 131.00 | 39.2% |
| 5 | 01:00 | 129.00 | 38.3% |
| 6 | 01:30 | 126.23 | 38.7% |
| 7 | 02:00 | 126.06 | 37.4% |
| 8 | 02:30 | 124.22 | 36.5% |
| 9 | 03:00 | 121.77 | 36.0% |
| 10 | 03:30 | 121.77 | 37.1% |
| 11 | 04:00 | 118.57 | 40.1% |
| 12 | 04:30 | 118.27 | 41.5% |
| 13 | 05:00 | 114.80 | 40.9% |
| 14 | 05:30 | 114.67 | 41.7% |
| 15 | 06:00 | 110.89 | 40.8% |
| 16 | 06:30 | 114.80 | 41.3% |
| 17 | 07:00 | 115.00 | 38.4% |
| 18 | 07:30 | 115.26 | 36.4% |
| 19 | 08:00 | 115.26 | 33.6% |
| 20 | 08:30 | 115.26 | 34.4% |
| 21 | 09:00 | 112.00 | 33.5% |
| 22 | 09:30 | 110.76 | 35.2% |
| 23 | 10:00 | 111.68 | 37.0% |
| 24 | 10:30 | 110.00 | 36.1% |
| 25 | 11:00 | 110.42 | 39.7% |
| 26 | 11:30 | 110.00 | 40.8% |
| 27 | 12:00 | 112.94 | 36.7% |
| 28 | 12:30 | 111.00 | 44.4% |
| 29 | 13:00 | 110.88 | 46.6% |
| 30 | 13:30 | 108.35 | 46.7% |
| 31 | 14:00 | 112.85 | 50.0% |
| 32 | 14:30 | 112.06 | 46.4% |
| 33 | 15:00 | 115.26 | 42.7% |
| 34 | 15:30 | 117.52 | 37.3% |
| 35 | 16:00 | 126.81 | 40.1% |
| 36 | 16:30 | 132.46 | 39.2% |
| 37 | 17:00 | 143.90 | 37.7% |
| 38 | 17:30 | 150.56 | 35.6% |
| 39 | 18:00 | 161.26 | 35.2% |
| 40 | 18:30 | 170.23 | 33.4% |
| 41 | 19:00 | 184.03 | 30.1% |
| 42 | 19:30 | 185.58 | 30.1% |
| 43 | 20:00 | 201.00 | 30.6% |
| 44 | 20:30 | 203.90 | 29.7% |
| 45 | 21:00 | 220.37 | 26.3% |
| 46 | 21:30 | 224.29 | 25.7% |
| 47 | 22:00 | 227.28 | 23.8% |
| 48 | 22:30 | 226.73 | 20.3% |
Compare your business electricity and gas rates in minutes with INIS Energy Brokers.
Compare rates