I-SEM Daily Briefing — 18 May 2026
Table of Contents
Market Snapshot
| Metric | Value |
|---|---|
| Mean DAM Price | €162.73/MWh |
| Median Price | €150.39/MWh |
| Std Dev | €35.29/MWh |
| Peak Price | €255.0/MWh (07:30) |
| Min Price | €121.51/MWh (15:30) |
| Price Range | €133.49/MWh |
| Periods above €150 | 25 of 48 (52%) |
| Periods above €200 | 8 of 48 (17%) |
| Peak Avg (07–22) | €169.8/MWh |
| Off-peak Avg (22–07) | €150.95/MWh |
| Peak/Off-Peak Spread | €18.85/MWh |
| Wind % of Demand | 25.0% |
| Wind Range | 1.0%–55.7% |
| Mean Demand | 4036 MW |
Price Profile #
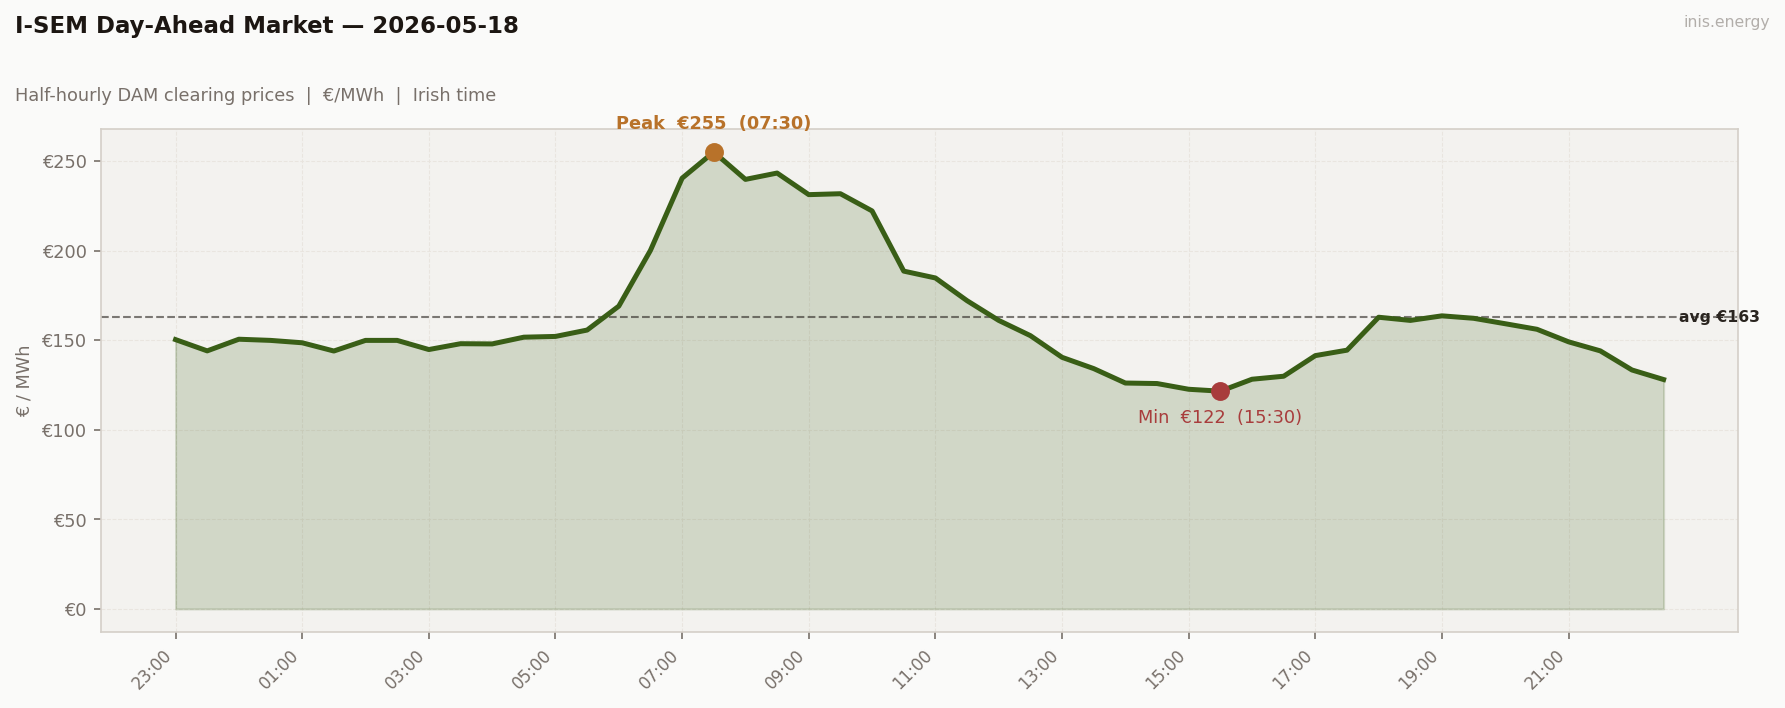
Std dev €35.29/MWh · Median €150.39/MWh · Periods above €150: 25 of 48 (52%)
A seesaw. Tall morning scarcity, a long collapse, a contained evening. Three distinct half-days in one chart.
Elevated overnight (23:00 → 05:30): €144–156. Wind fell from 48% at 23:00 to 3% by 04:30 — the familiar EirGrid boundary artefact places Sunday’s 48% in periods 1–2, then the real decline runs through the small hours. The overnight floor lifted into mid-merit gas territory as renewables left the system. No period below €144; a floor that would have been a peak on last Tuesday.
The morning scarcity event (06:00 → 09:30): €169 → €200 → €240 → €255 → €240 → €243 → €231 → €232. Five consecutive half-hours from 07:00 to 09:00 averaging €240/MWh. Wind during this block: 1.0%–3.0% — effectively zero on the entire system at the height of the morning demand peak. The merit order ran out of mid-merit gas, climbed into peakers, and the next MW of demand pulled the next plant up the stack. €255 is plant-scarcity pricing: these are peaker costs, probably within €10–20 of the I-SEM’s structural ceiling at 4,000 MW demand.
The wind-driven recovery (10:00 → 15:30): €222 → €189 → €185 → €172 → €161 → €152 → €140 → €134 → €126 → €126 → €123 → €121. €101 of collapse across eleven half-hours, tracking wind climbing from 4.7% to 48.8%. The inverse of May 17’s evening decline — same slope, same physics, opposite direction. Each ~4 percentage points of wind added removed roughly €12/MWh from the clearing price.
Contained evening (16:00 → 22:30): €128 → €163 → €163 → €159 → €149 → €133 → €128. Evening peak capped at €164 around 18:00–19:00. Wind held 44–55% through the evening — the wind that disappeared at dawn was back by dinner — and the merit order found mid-merit gas comfortably throughout. The evening peak was €91 below the morning peak. Same demand profile, completely different wind regime by 18:00.
Price vs Wind #
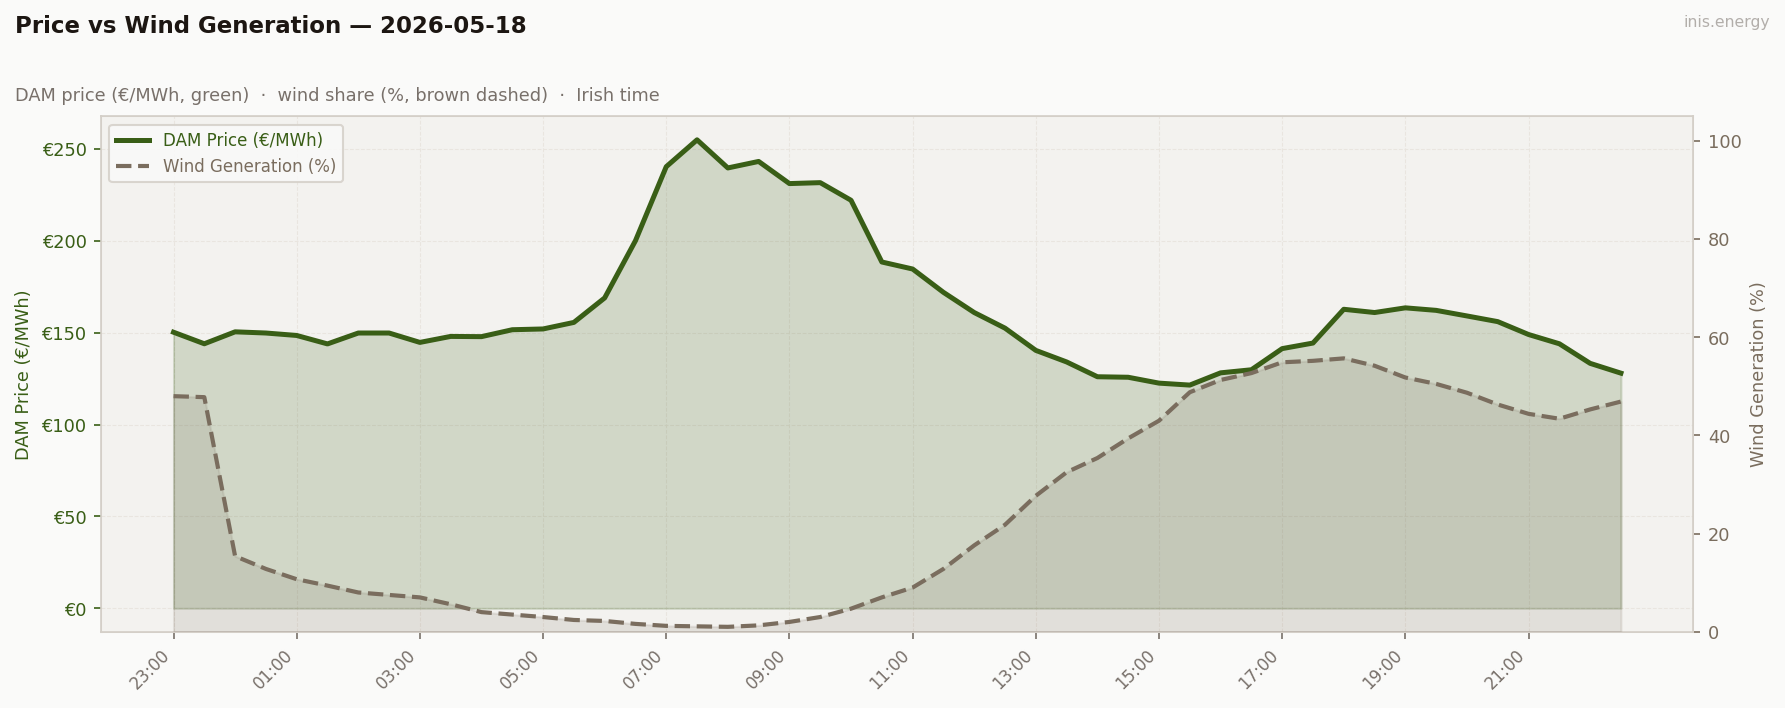
Mean wind: 25.0% · Range: 1.0%–55.7%
Wind 1.0%–55.7%, mean 25.0%. The 55-point range is the analytical statement: today wasn’t a low-wind day or a high-wind day, it was both, in sequence. The wind chart reads as a staircase — close to zero through the morning (1–10%), climbing fast from 10:00 to 16:00 (7% → 55%), holding 45–55% through the evening, easing back to 46% late.
Wind’s capture price today was substantially below the daily mean — probably 65–70%, one of the worst structural days for wind revenue in the run. Wind generated almost nothing during the €240+ morning and abundantly during the €120–165 afternoon and evening. The paradox lands clearly: this was simultaneously the day that made the strongest case for wind build-out (look what happens to prices when there is none) and the worst structural day for wind revenue per MWh actually generated. The system-need signal and the capture-price problem point in opposite directions. A wind investor and a wind farm operator look at the same chart and reach opposite conclusions.
Week in Context #
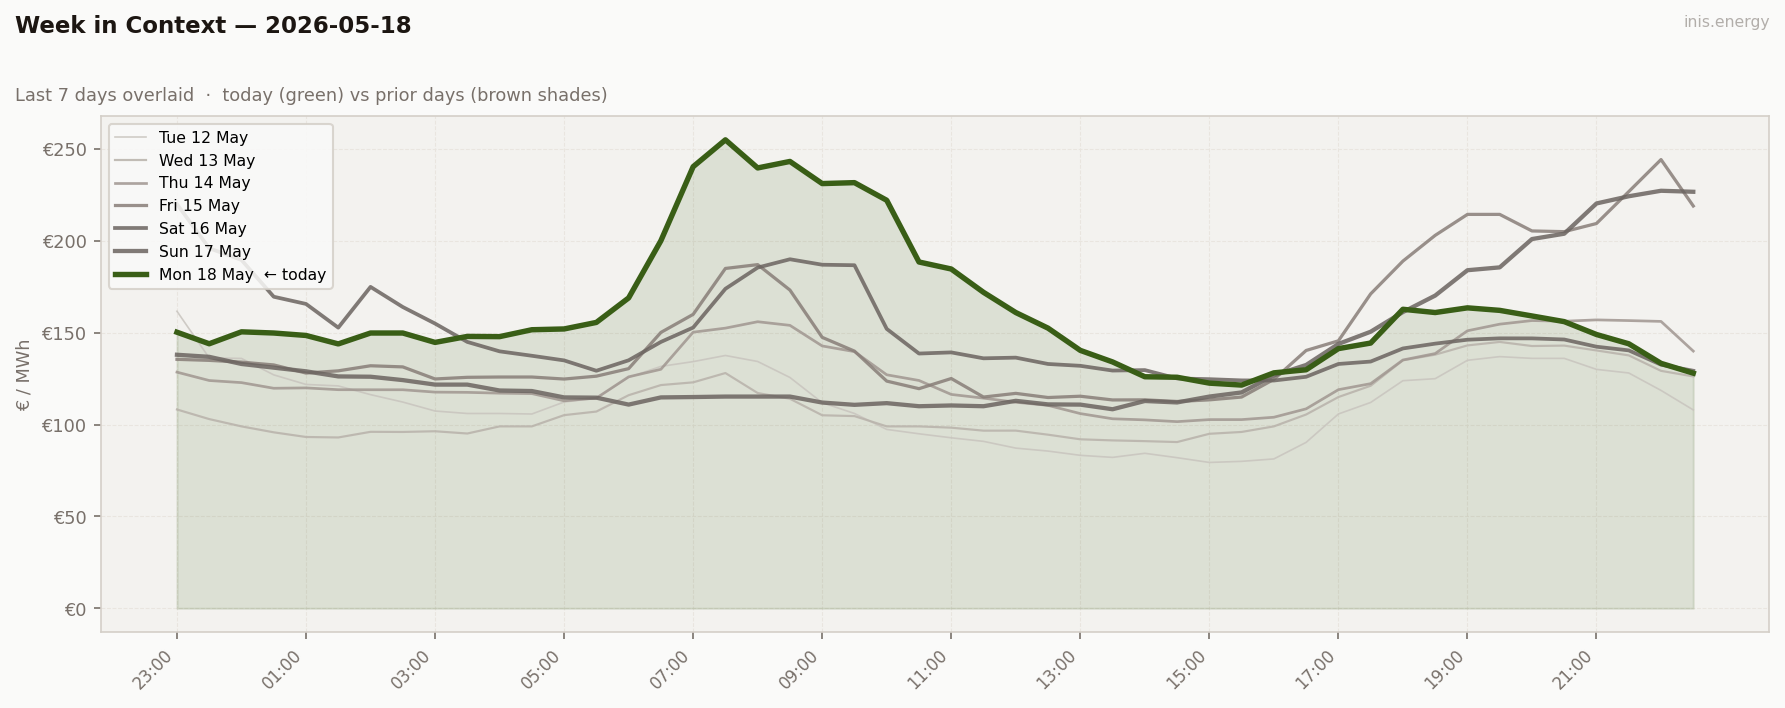
Three comparisons, same structural point from different angles.
May 5 (Tuesday, windless) ran 8.5% mean wind at €174 mean. Today ran 25.0% mean wind at €163 mean. Three times more wind on May 18, only €11/MWh cheaper. The reason is timing: May 5’s wind was uniformly low (4.4–15.7% range, bad timing all day but no extreme moment). May 18’s wind averaged 25% but ran 1.0% during the morning peak and 55.7% in the evening. Mean wind doesn’t capture the timing of wind shortfalls. Same average, near-identical market outcome.
May 11 (Monday, 23% mean wind, €138) vs today (Monday, 25% mean wind, €163): demand barely moved (3,810 → 4,036 MW), but the wind range went from 17–32% (15-point band, stable) to 1–56% (55-point band, extreme variability). The wind variability — not the wind level — drove the €25 difference between two Mondays with essentially the same mean wind.
Mean wind is not the right statistic for pricing analysis. Intra-day timing is.
Price Duration Curve #
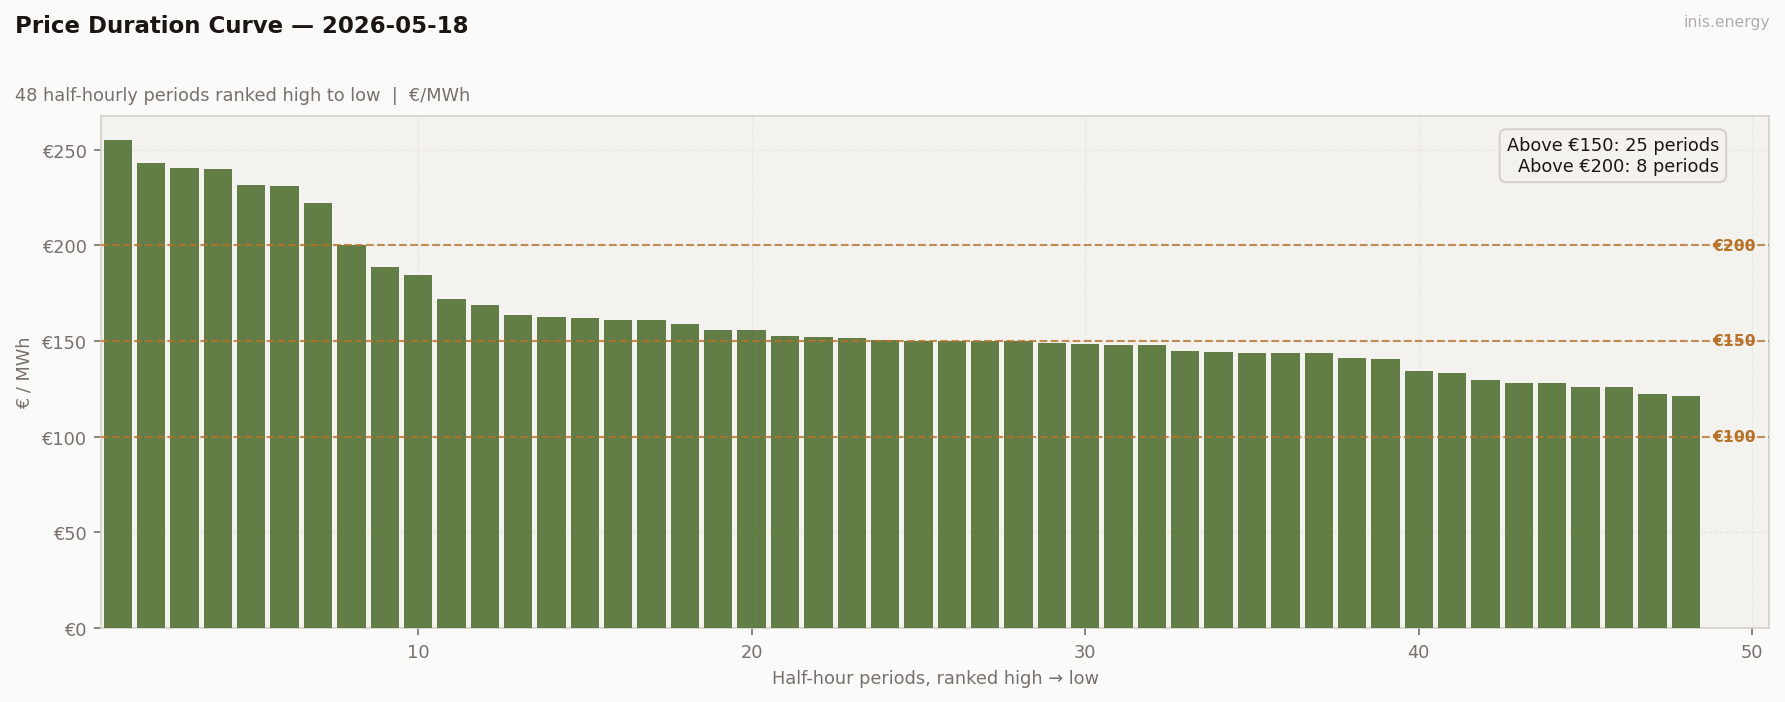
Periods above €150: 25 (52% of day) · Above €200: 8 (17% of day)
25 above €150 — more than half the day — and 8 above €200. A steep top half: the morning scarcity block (8 periods €200+, 5 periods above €230), extending down through the elevated overnight and recovery gradient into a broad middle around €150–190. Then a shallow tail of 23 periods below €150, mostly the afternoon and evening wind-rich lows.
The comparison to May 15 is instructive. Similar plateau height (€240+ today, €244+ on Friday), similar width at the top (8 vs 9 periods above €200). May 15’s plateau was clustered tightly near its ceiling; May 18’s extends further down through the morning recovery gradient. Both are scarcity fingerprints — peaker pricing concentrated in a short block — but May 18’s bimodality is more extreme: a €134 range with the floor at €122 versus May 15’s €113.
Peak / Off-Peak Spread #
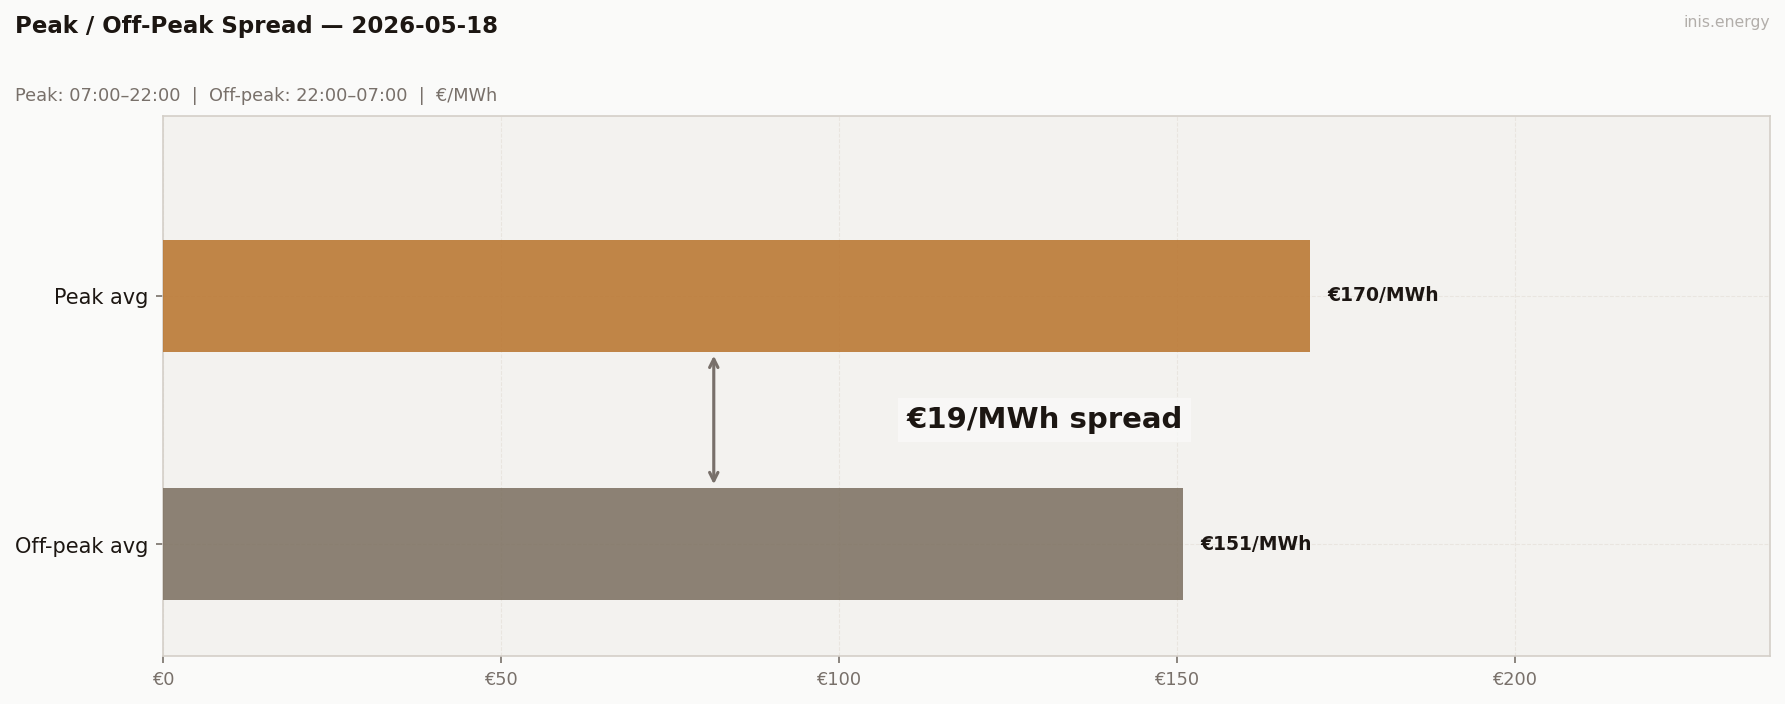
Peak avg (07:00–22:00): €169.8/MWh · Off-peak avg: €150.95/MWh · Spread: €18.85/MWh
+€18.85. A positive spread, and for once the metric earns its fee.
The morning scarcity falls cleanly inside the peak window (06:30–09:30, all above €169). The off-peak window catches the elevated overnight (€144–156, wind leaving the system through the small hours) but no scarcity. The peak window runs expensive at both ends — morning scarcity and a mild evening shoulder — while the off-peak window has only the elevated floor. €19 spread is the mechanical result of a morning-aligned scarcity event.
Compare to May 17: same order of magnitude of scarcity hours (6 vs 8), spread +€2.48 vs +€18.85. The difference is entirely which side of 22:00 the scarcity fell. Morning scarcity aligns with the peak window; the metric works. Late-evening wind-decay scarcity crosses the boundary; the metric breaks. Same instrument, different events, very different readings.
BESS Dispatch Signal #
| Price | Time | Energy | Value | |
|---|---|---|---|---|
| Charge | €124/MWh | 14:00 | 2 MWh | −€248 |
| Discharge | €162/MWh | 18:00 | 1.7 MWh (85% RTE) | +€276 |
| Gross profit | €28 | |||
| Price spread | €38/MWh | ROI: 11.3% |
Simulated 1MW/2MWh battery, one optimal DAM cycle. Gross before network charges and capacity costs.
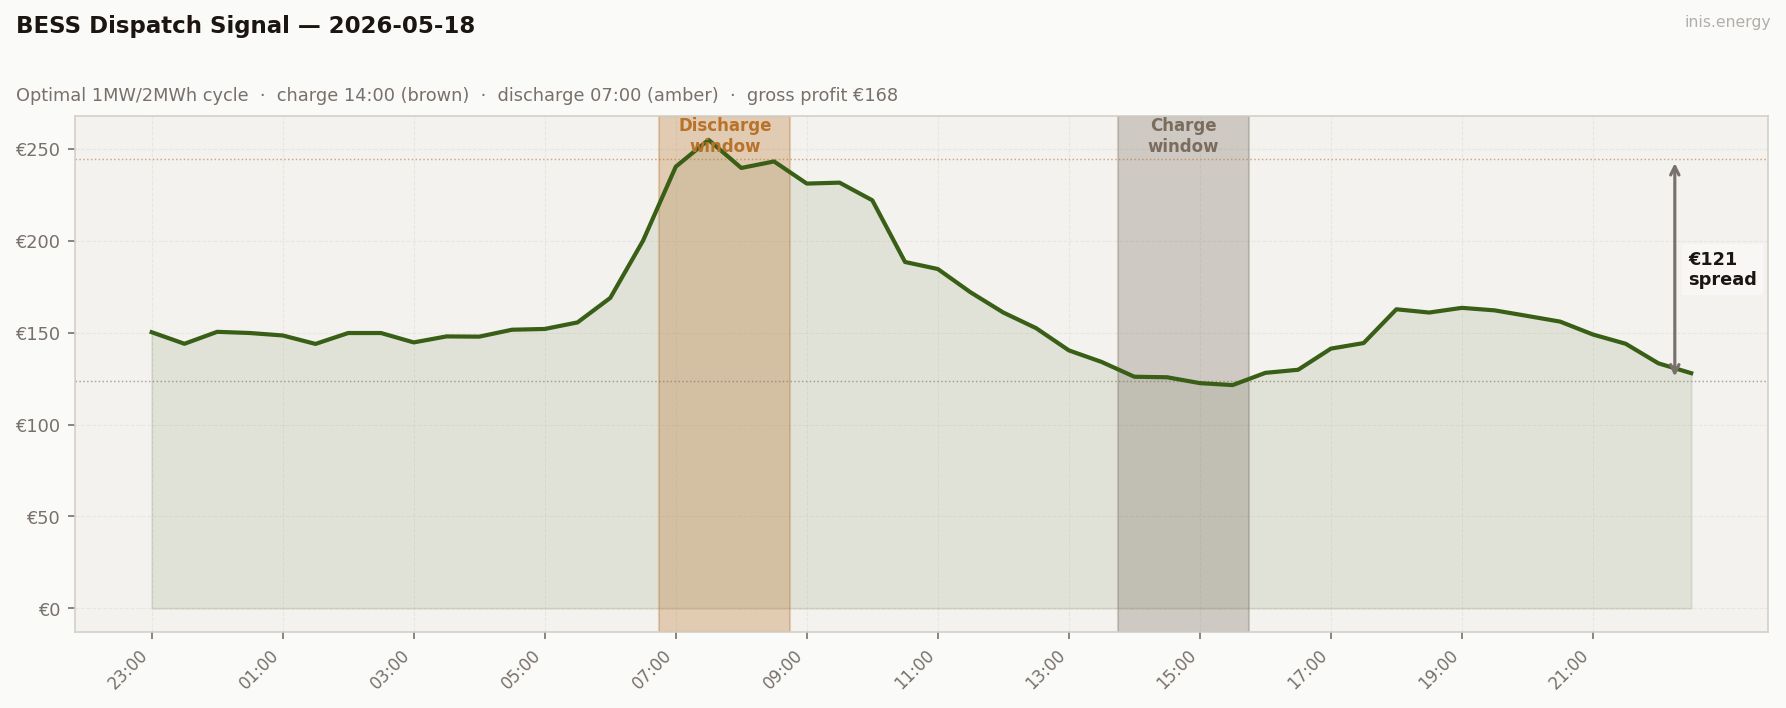
€28 gross, captured spread €38, ROI 11.3%. The morning scarcity block (07:00–08:30, averaging €244.78) was the day’s sharpest window by far — €82/MWh above the evening peak’s four-hour cluster (18:00–19:30, averaging €162.50). But it came before the afternoon wind-recovery trough (€124 at 14:00) where the battery charged, so a same-day cycle couldn’t reach it: the battery discharged into the evening peak instead, the best window still open after charging. The morning spike was the day’s real story; storage just couldn’t reach it.
Commentary #
Monday’s mean of €162.73/MWh is the highest of the 17-day run. The peak hit €255 at 07:30 — clearing May 15’s €244 — and eight half-hours cleared above €200, all in the morning block. The driver was wind at 1.0% during the morning peak: effectively zero on the entire system while demand was at 4,036 MW. The merit order ran out of mid-merit gas, climbed into peakers, and the next MW of demand pulled the next plant up the stack. Five consecutive half-hours from 07:00 to 09:00 averaged €240/MWh. €255 is plant-scarcity pricing — the marginal-plant costs of the cheapest peakers in the stack, probably within €10 of the I-SEM’s structural price ceiling at this demand level.
The most analytically important fact of the day isn’t the peak — it’s the comparison to May 5. May 5 (Tuesday): 8.5% mean wind, €174 mean. May 18 (Monday): 25.0% mean wind, €163 mean. Three times more wind on May 18, only €11/MWh cheaper. The reason is timing. May 5’s wind was uniformly low (range 4.4–15.7%): bad timing all day but no extreme moment. May 18’s wind averaged 25% but ran 1.0% at the morning peak and 55.7% in the evening. Mean wind doesn’t capture the timing of wind shortfalls. Same average, near-identical market outcomes. This has direct implications for capacity adequacy analysis: models using mean wind capacity factors will systematically understate how often the system runs into May 18-style morning events.
For storage, a modest day: €28 gross, captured spread €38, ROI 11.3%. The morning scarcity block (07:00–08:30, €245 avg) was €83/MWh above the evening peak — but it happened before the battery’s charge window, so a same-day cycle couldn’t reach it.
Half-hourly data — 2026-05-18
| Period | Time | Price (€/MWh) | Wind % |
|---|---|---|---|
| 1 | 23:00 | 150.29 | 48.0% |
| 2 | 23:30 | 144.00 | 47.8% |
| 3 | 00:00 | 150.50 | 15.4% |
| 4 | 00:30 | 149.85 | 12.8% |
| 5 | 01:00 | 148.52 | 10.7% |
| 6 | 01:30 | 143.92 | 9.4% |
| 7 | 02:00 | 149.85 | 8.0% |
| 8 | 02:30 | 149.85 | 7.5% |
| 9 | 03:00 | 144.74 | 7.0% |
| 10 | 03:30 | 148.00 | 5.6% |
| 11 | 04:00 | 147.88 | 4.0% |
| 12 | 04:30 | 151.64 | 3.5% |
| 13 | 05:00 | 152.06 | 3.0% |
| 14 | 05:30 | 155.62 | 2.4% |
| 15 | 06:00 | 168.96 | 2.2% |
| 16 | 06:30 | 200.09 | 1.6% |
| 17 | 07:00 | 240.39 | 1.2% |
| 18 | 07:30 | 255.00 | 1.1% |
| 19 | 08:00 | 239.70 | 1.0% |
| 20 | 08:30 | 243.24 | 1.3% |
| 21 | 09:00 | 231.19 | 2.0% |
| 22 | 09:30 | 231.70 | 3.0% |
| 23 | 10:00 | 222.10 | 4.7% |
| 24 | 10:30 | 188.51 | 7.0% |
| 25 | 11:00 | 184.69 | 9.0% |
| 26 | 11:30 | 172.00 | 12.8% |
| 27 | 12:00 | 161.00 | 17.6% |
| 28 | 12:30 | 152.50 | 21.8% |
| 29 | 13:00 | 140.40 | 27.7% |
| 30 | 13:30 | 134.11 | 32.5% |
| 31 | 14:00 | 126.05 | 35.4% |
| 32 | 14:30 | 125.77 | 39.4% |
| 33 | 15:00 | 122.57 | 43.0% |
| 34 | 15:30 | 121.51 | 48.8% |
| 35 | 16:00 | 128.17 | 51.3% |
| 36 | 16:30 | 129.85 | 52.7% |
| 37 | 17:00 | 141.36 | 54.9% |
| 38 | 17:30 | 144.39 | 55.2% |
| 39 | 18:00 | 162.77 | 55.7% |
| 40 | 18:30 | 161.00 | 54.2% |
| 41 | 19:00 | 163.55 | 51.8% |
| 42 | 19:30 | 162.18 | 50.5% |
| 43 | 20:00 | 159.14 | 48.7% |
| 44 | 20:30 | 156.05 | 46.3% |
| 45 | 21:00 | 149.04 | 44.4% |
| 46 | 21:30 | 144.00 | 43.4% |
| 47 | 22:00 | 133.34 | 45.3% |
| 48 | 22:30 | 128.00 | 46.9% |
Compare your business electricity and gas rates in minutes with INIS Energy Brokers.
Compare rates